

Briefly: in our opinion, full (300% of the regular position size) speculative short positions in junior mining stocks are justified from the risk/reward point of view at the moment of publishing this Alert.
The key development for precious metals investors this week happened neither in gold, silver, nor mining stocks – it came from the USDX.
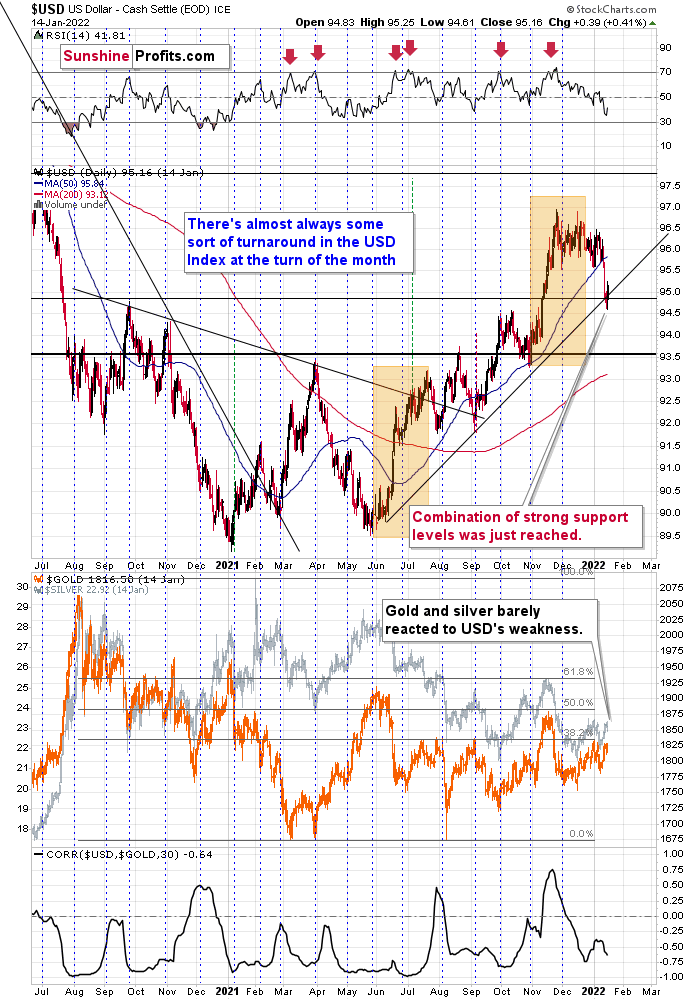
The thing that happened was that the U.S. currency bounced off the combination of strong support levels, the late-2020 high, and the rising medium-term support line. In my previous analyses, I wrote the following:
While the USD has a slight cold and is sitting out this inning, the precious metals are enjoying some sun. But for how long before the tables turn?
While six Fed officials warned of forthcoming rate hikes and signaled that the March meeting could result in liftoff, the USD Index responded like they had announced another round of QE. What does it give?
Well, with the U.S. dollar stuck in consolidation mode after its recent sprint higher, gold, silver, and mining stocks have enjoyed the pullback. However, since the charts provide the most accurate clues regarding the future price action, the technicals signal that the USD Index’s weakness should be short-lived.
For example, while unfulfilled prophecies of the dollar’s demise in 2021 have been resurrected in 2022, the USD Index rallied off of expected support. After declining intraday on Jan. 13, the dollar basket reversed higher and ended the day with a bullish hammer candle. Moreover, the USD Index closed above its rising support line (the dashed line below) and its September 2020 high. As a result, the dollar found support near the levels that I outlined on Jan. 13. I wrote:
At the beginning of 2021, I wrote that the year was likely to be bullish for the USD Index, and my forecast for gold (and the rest of the precious metals sector) was bearish – against that of almost every one of my colleagues.
The USD Index ended 2021 about 6% higher, gold was down about 3.5%, silver was down almost 12%, the GDX ETF was down by about 9.5%, and the GDXJ ETF (proxy for junior mining stocks, my primary tool for shorting the precious metals sector in 2021 – I wasn’t shorting gold at any point in 2021) was down by about 21%.
What about this year? It’s a tough call to say how the entire year will go, but it seems to me that the USD Index will move higher, and we’ll see both in the PMs: a massive decline, and then a huge rally. It’s very likely to be a year to remember for anyone interested in trading gold, silver, and/or mining stocks and/or investing in them.
The USD Index declined to fresh 2022 lows – well below the previous January lows, and also below the December and late-November lows.
We see that the USD Index just (in overnight trading, so the move is not even close to being confirmed) moved a little below USDX’s rising support line based on the previous June and October 2021 lows. At the same time, the USDX is slightly below its late-2020 top and slightly above its November 2021 top.
In light of the situation on the long-term USDX chart, this combination of support levels is likely to trigger a rebound and the continuation of the medium-term rally.
Well, we saw exactly that – a rebound. Is this the end of the corrective downswing? That’s quite likely, and this scenario is supported not only by the short-term charts, but also by the USD Index’s long-term chart.
I previously described the above chart in the following way:
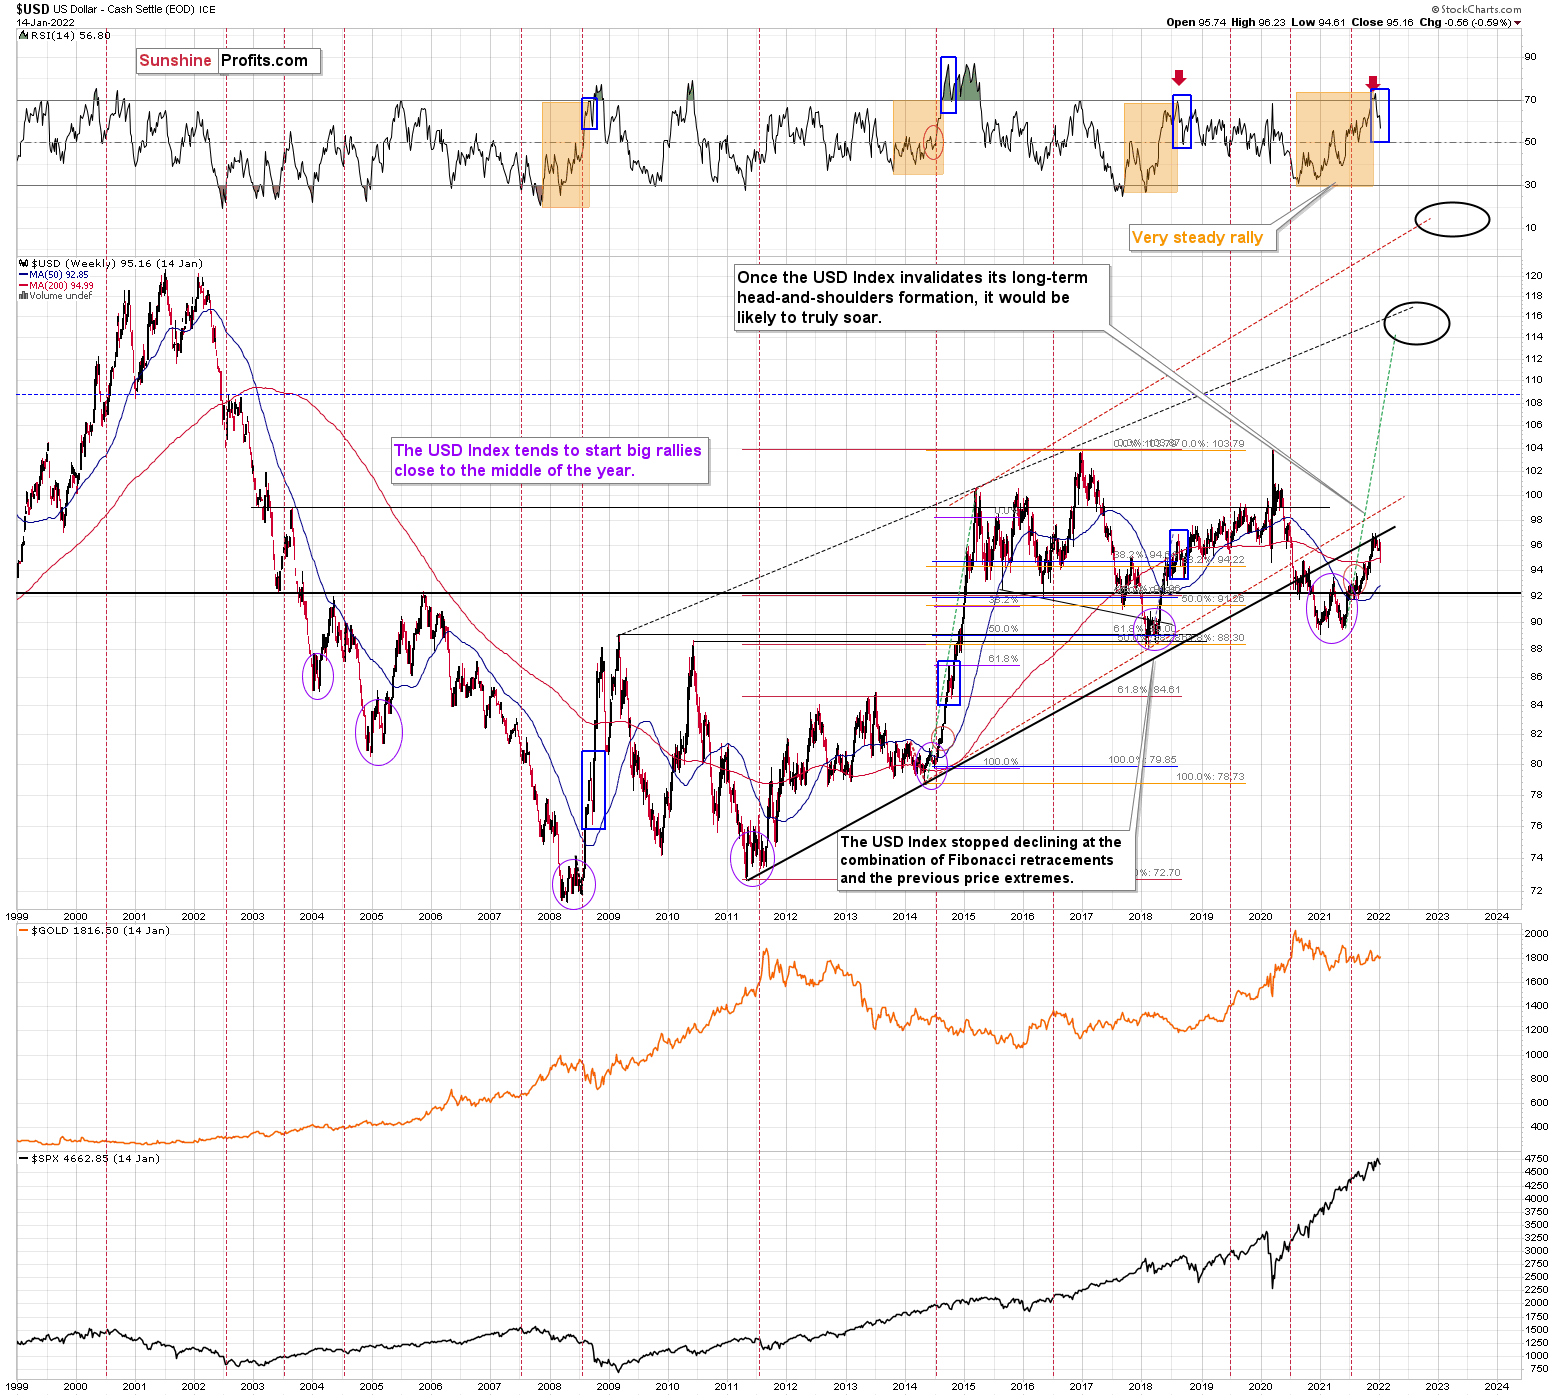
Moreover, if we zoom out and focus our attention on the USD Index’s weekly chart, an interesting pattern has developed. To explain, when the dollar basket’s weekly RSI (based on the weekly price changes) hit 70, I wrote the following:
Also, please note that the recent medium-term rally has been calmer than any major upswing witnessed over the last 20 years, where the USD Index’s RSI has hit 70. I marked the recent rally in the RSI with an orange rectangle, and I did the same with the second-least and third-least volatile of the medium-term upswings.
The sharp rallies in 2008 and 2014 were of much larger magnitudes. And in those historical analogies, the USD Index continued its surge for some time without suffering any material corrections.
As a result, the short-term outlook is more of a coin flip.
Consequently, the current [edit: previous] decline is not unexpected – it’s rather normal.
I marked additional situations on the chart below with orange rectangles – these were the recent cases when the RSI based on the USD Index moved from very low levels to or above 70. In all three previous cases, there was some corrective downswing after the initial part of the decline, but once it was over – and the RSI declined somewhat – the big rally returned and the USD Index moved to new highs.
I marked those declines in the RSI with blue rectangles, and I did the same thing for the current decline. As you can see, the size of the move lower is currently analogous to previous short-term corrections that were then followed by higher prices. This means that it’s quite likely over or very close to being over, and the medium-term rally can return any day now.
Indeed, the previous declines in the USD Index and the RSI correspond to what we saw recently. It seems that the verse is complete and that history has rhymed once again.
What is also important is that gold is responding to the USD’s strength.
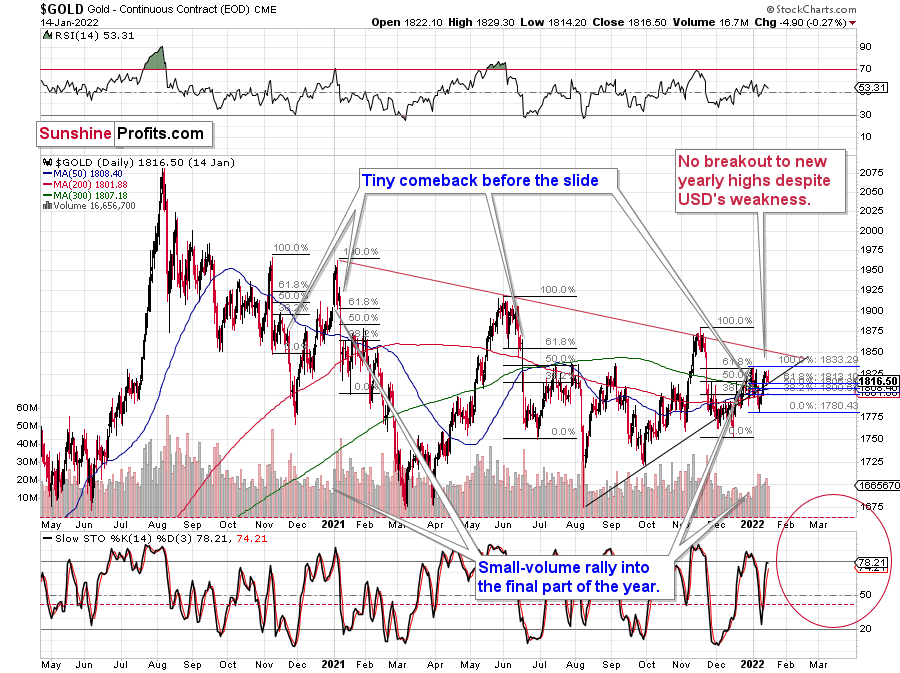
Just as the USD Index rallied recently, gold declined after failing to rally to new yearly highs. In today’s pre-market trading, the USD Index is up by about 0.2, and gold is down by about $9. So, the odds are that if the USD Index continues its short-term rally (which is very likely), gold will respond by declining. The outlook for gold is thus bearish.
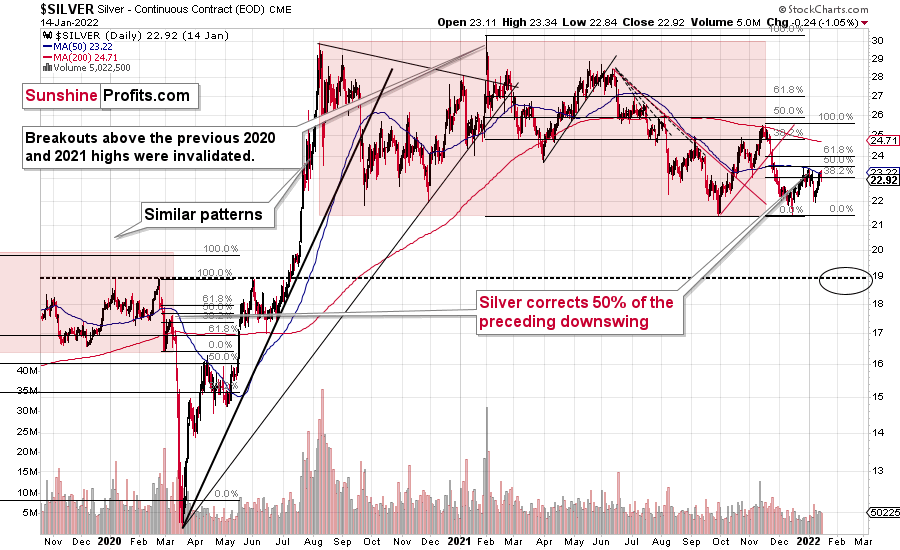
Silver, just like gold, didn’t move to new 2022 highs either. It bounced off its 50-day moving average, which proved to be important resistance once again. It seems that the silver forecast is bearish as silver appears ready to fall, just like gold is, especially now that we see weakness in the S&P 500 futures so far in today’s pre-market trading.
As a reminder, silver and mining stocks (especially junior mining stocks) are trading more in tune with the general stock market than gold does, so if the main stock indices fall, they will likely be affected to the greatest extent. Since it seems that the Fed has already made a fundamental U-turn regarding QE and interest rates, the situation is not looking good for the stock market.
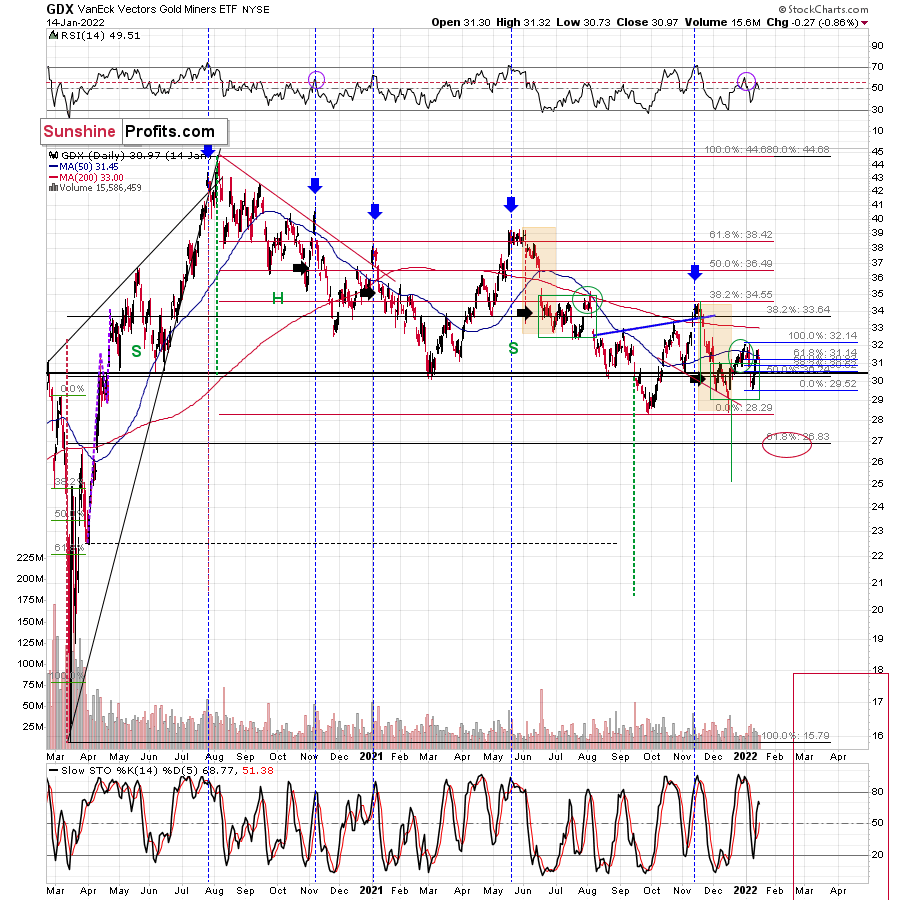
Just like gold and silver, mining stocks failed to move to new 2022 highs, despite the fact that the USD Index recently moved to new 2022 lows. They too reacted to the USD’s small (so far) rally. The implications are bearish, as the USD Index is likely to continue to rally, triggering more declines across the precious metals sector.
Having said that, let’s take a look at the markets from a more fundamental point of view.
Walking a Tightrope
With the Fed poised to materially tighten monetary policy in 2022, confusion has arisen over the likely path and possible ramifications. For example, raising interest rates is the most likely outcome, as a higher U.S. Federal Funds Rate is the Fed's primary tool. However, quantitative tightening (QT) (selling assets on the Fed's balance sheet) is another way to siphon liquidity from the system.
While Fed Chairman Jerome Powell told Congress on Jan. 11 that asset sales are unlikely at the moment, the revelation was far from unexpected. To explain, I wrote on Dec. 23:
Is this a plausible path for the Fed over the medium term? In a word: no. While the prospect is profoundly bullish for the USD Index and profoundly bearish for the PMs, Chairman Jerome Powell will likely avoid quantitative tightening.
For one, if the Fed tries to reduce its balance sheet from 35% to 20% of GDP, the financial markets would freak out. Currently, the Fed has such a large stockpile of bonds that private investors can’t absorb that kind of supply. Thus, another taper tantrum will likely unfold if the Fed tries to ‘normalize’ its balance sheet through the open market.
Second, the Fed’s only hawkish goal is to calm inflation. To explain, when inflation was running hot and most Americans bought into the “transitory” narrative, Fed officials exuded confidence. However, when consumer confidence sunk to a 10-year low and inflation became political, the Fed changed its tune. As a result, Powell wants to reduce inflation while tightening as little as possible (3% to 4% inflation may be considered acceptable in 2022). Thus, normalizing the balance sheet is likely a bridge too far.
As a result, Powell’s rhetoric aligned with our expectations, and his dovish pushback has little impact on the PMs’ bearish fundamental outlook. For context, several Fed officials have advocated for QT in recent weeks. While they may head down this road later in 2022, more important developments should materialize in the interim. Likewise, while a balance sheet runoff would bolster our fundamental expectations for a stronger USD Index, higher U.S. Treasury yields, and lower precious metals prices, it’s prudent to air on the side of caution. Thus, higher interest rates are the hawkish main course, and QT should be considered the dessert.
Despite that, though, Wells Fargo expects the Fed to raise interest rates and employ QT in 2022. If the scenario unfolds, it could supercharge the PMs’ suffering.
Please see below:
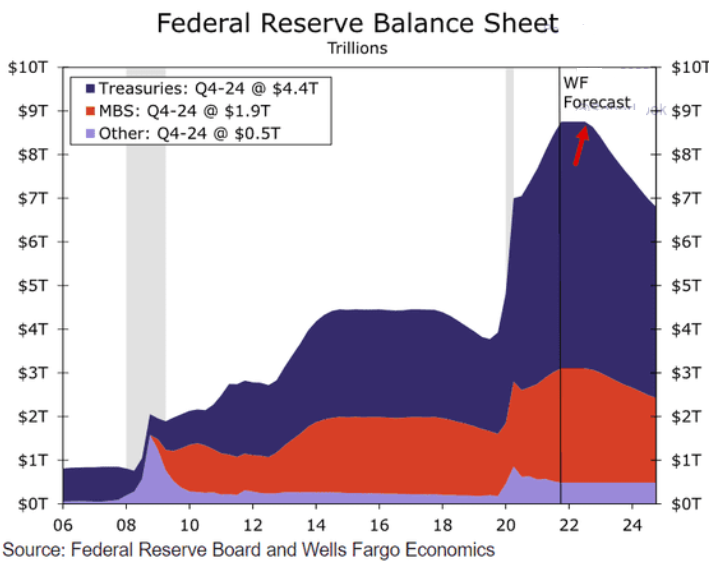
To explain, the dark blue (U.S. Treasuries), red (MBS) and light blue (other) lines above track and break down the composition of the Fed’s balance sheet. If you analyze the right side of the chart, you can see that Wells Fargo expects the Fed to begin selling assets in the fourth quarter of 2022. Moreover, the Fed’s balance sheet is projected to decline from nearly $9 trillion today to less than $7 trillion by the end of 2024.
To that point, if the projection proves prescient, U.S. interest rates will likely record epic rallies. With the PMs highly allergic to higher interest rates, fundamental development would severely impact their performance. Again, though, QT is not our baseline expectation. However, it’s possible toward the end of 2022, and Wells Fargo’s analysis is worthy of attention.
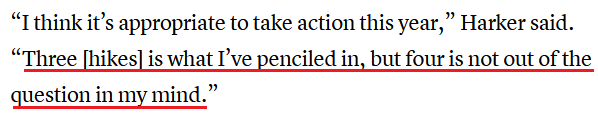
In the interim, though, Fed hawks continue to prepare investors for upcoming rate hikes. For example, Philadelphia Fed President Patrick Harker told CNBC on Jan. 13: “we do need to take action on inflation. It is more persistent than we thought a while ago. I’ve been off the ‘transitory’ team for a while now.”
As a result:
 Source: CNBC
To that point, Harker also commented on the prospect of QT. Aligning with our expectations, he noted that it's inappropriate to put the carriage before the horse. For context, it's not that we don't think QT is possible. It's that other developments have priority. If the Fed can control inflation by raising interest rates (which is likely if the curve steepens and long-term interest rates rise), then QT should prove unnecessary.
We should approach policy normalization "carefully and methodically," said Harker. "This is why I'm not in the camp of raising rates and doing balance sheet normalization at the same time (…). I don't want to do that all at once. I think that's just the wrong way to go. Let's do them in stages," he added.
Aligning with the former, Chicago Fed President Charles Evans was also hawked up on Jan. 13. Commenting that the Fed is "not well-positioned" to deal with rampant inflation, he said that up to "four" rate hikes could materialize in 2022.
Please see below:
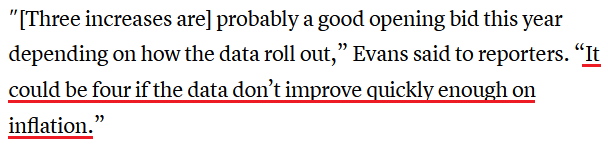 Source: CNBC
Making three of a kind, New York Fed President John Williams (one of the last doves standing) said the following on Jan. 14. For context, Williams is extremely dovish, so his comments are less direct.
“The next step in reducing monetary accommodation to the economy will be to gradually bring the target range for the federal funds rate from its current very-low level back to more normal levels,” said Williams. “Given the clear signs of a very strong labor market, we are approaching a decision to get that process underway,” he added.
Thus, let’s do a quick rundown: in a week, we had Powell, Bostic, Mester, George, Bullard, Harker, Evans, and Williams specifically mention rate hikes or hint at policy tightening. Likewise, Kashkari (another major dove) wrote on Jan. 4 that he flipped from “zero expected rate increases in 2022 in [his] September submission to two increases in December.”
Piecing it all together, remember what Powell said on Dec. 15?
I wrote on Dec. 16:
As one of the most important quotes from the press conference, he admitted:
“My colleagues were out talking about a faster taper and that doesn’t happen by accident. They were out talking about a faster taper before the president made his decision. So it’s a decision that effectively was more than entrained.”
And while Powell sounded a little rattled during the exchange, his slip highlights the importance of Fed officials’ hawkish rhetoric. Essentially, when Clarida, Waller, Bostic, Bullard, etc., are making the hawkish rounds, “that doesn’t happen by accident.” As such, it’s an admission that his understudies serve as messengers for pre-determined policy decisions.
To that point, with nine Fed officials sounding the hawkish alarm since the New Year, does it seem like they’re bluffing? Of course not. The Fed is poised to tighten the screws in the coming months, and QT or no QT, the impact of higher interest rates is fundamentally bearish for the PMs.
Finally, the University of Michigan released its Consumer Sentiment Index on Jan. 14. With Americans’ optimism hitting its “second-lowest level in a decade,” the report revealed:
“While the Delta and Omicron variants certainly contributed to this downward shift, the decline was also due to an escalating inflation rate. Three-quarters of consumers in early January ranked inflation, compared with unemployment, as the more serious problem facing the nation (…).”
“When asked to assess their finances, 33% reported being worse off financially than a year earlier, just above the April 2020 shutdown low of 32%, the worst reading since 2014. Twice as many households with incomes in the bottom third as in the top third reported worsening finances (40% vs. 20%). Inflationary erosion of living standards was the main explanation offered by these consumers.”
Moreover, while I’ve noted on numerous occasions that inflation has become political, the inverse relationship between inflation and U.S. President Joe Biden’s approval rating is extremely detrimental to his re-election hopes.
Please see below:
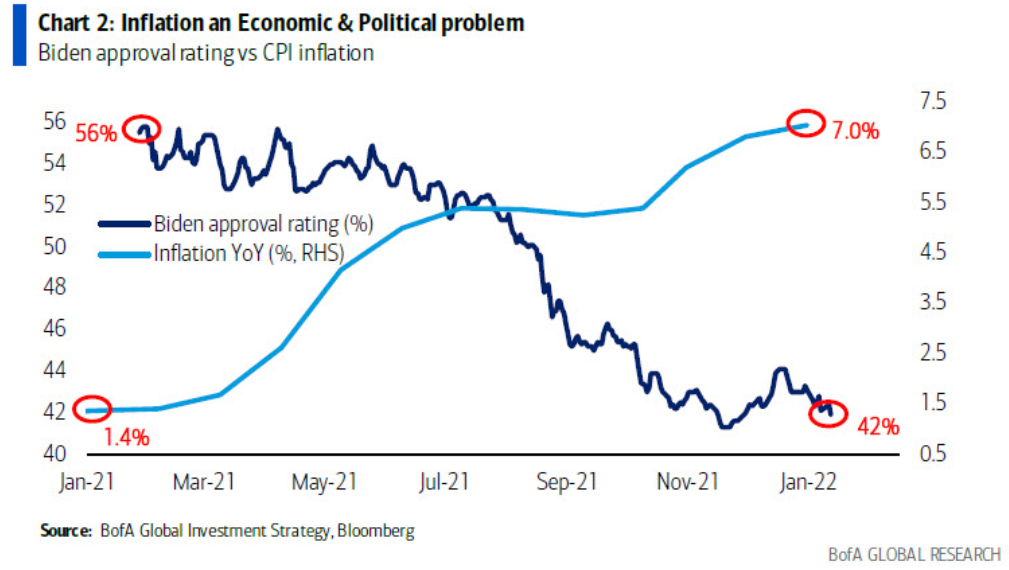
To explain, the dark blue line above tracks Biden’s approval rating, while the light blue line above tracks the year-over-year (YoY) percentage change in the headline Consumer Price Index (CPI). As you can see, surging inflation isn’t doing the president any favors. With his political survival on the line, doing nothing is the easiest way to lose the next election. As a result, the Fed isn’t bluffing, and Biden is likely Powell’s strongest supporter.
The bottom line? While QT would likely supercharge the PMs’ fundamental plight, it’s more of a prospect than an expectation. In contrast, higher interest rates and a stronger USD Index are more realistic at this point. With surging inflation, a hawkish Fed, and a nervous Biden, profoundly bullish on these two variables, the PMs’ fundamental outlooks remain quite ominous. As a result, we expect more downside to materialize in the coming months.
In conclusion, the PMs declined on Jan. 14, and the U.S. 10-Year Treasury yield continues to cause problems. As the benchmark attempts to hold above 1.80%, the milestone will likely materialize sooner rather than later. As a result, the fundamental walls are closing in on the PMs, and the bearish medium-term implications remain intact.
Overview of the Upcoming Part of the Decline
- It seems to me that the corrective upswing is over, and that gold, silver, and mining stocks are now likely to continue their medium-term decline.
- It seems that the first (bigger) stop for gold will be close to its previous 2021 lows, slightly below $1,700. Then it will likely correct a bit, but it’s unclear if I want to exit or reverse the current short position based on that – it depends on the number and the nature of the bullish indications that we get at that time.
- After the above-mentioned correction, we’re likely to see a powerful slide, perhaps close to the 2020 low ($1,450 - $1,500).
- If we see a situation where miners slide in a meaningful and volatile way while silver doesn’t (it just declines moderately), I plan to – once again – switch from short positions in miners to short positions in silver. At this time, it’s too early to say at what price levels this could take place, and if we get this kind of opportunity at all – perhaps with gold close to $1,600.
- I plan to exit all remaining short positions once gold shows substantial strength relative to the USD Index while the latter is still rallying. This may be the case with gold close to $1,350 - $1,400. I expect silver to fall the hardest in the final part of the move. This moment (when gold performs very strongly against the rallying USD and miners are strong relative to gold after its substantial decline) is likely to be the best entry point for long-term investments, in my view. This can also happen with gold close to $1,375, but at the moment it’s too early to say with certainty.
- As a confirmation for the above, I will use the (upcoming or perhaps we have already seen it?) top in the general stock market as the starting point for the three-month countdown. The reason is that after the 1929 top, gold miners declined for about three months after the general stock market started to slide. We also saw some confirmations of this theory based on the analogy to 2008. All in all, the precious metals sector is likely to bottom about three months after the general stock market tops.
- The above is based on the information available today, and it might change in the following days/weeks.
You will find my general overview of the outlook for gold on the chart below:
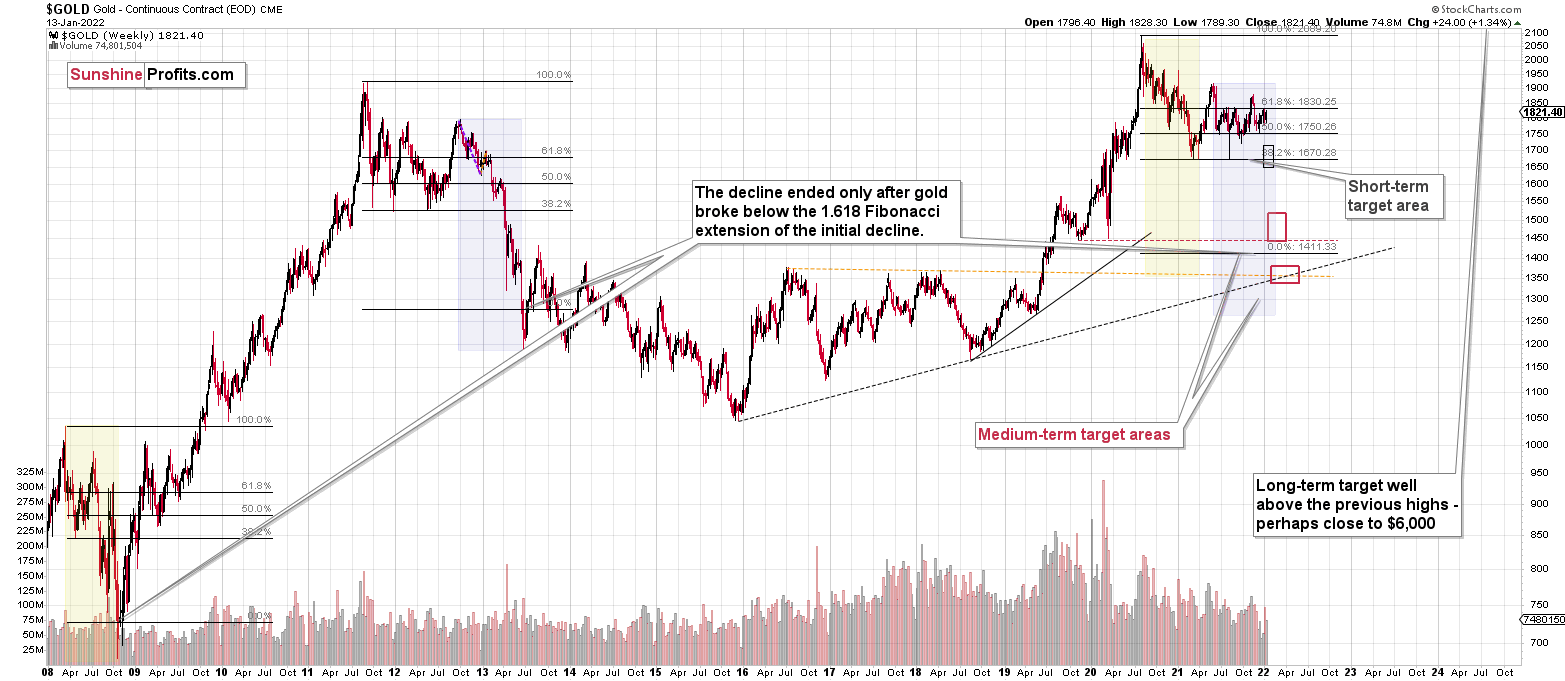
Please note that the above timing details are relatively broad and “for general overview only” – so that you know more or less what I think and how volatile I think the moves are likely to be – on an approximate basis. These time targets are not binding or clear enough for me to think that they should be used for purchasing options, warrants or similar instruments.
Summary
Summing up, it seems to me that the corrective upswing is over, and that gold, silver, and mining stocks are now likely to continue their medium-term decline. I continue to think that junior mining stocks are currently likely to decline the most out of all parts of the precious metals sector.
From the medium-term point of view, the key two long-term factors remain the analogy to 2013 in gold and the broad head and shoulders pattern in the HUI Index. They both suggest much lower prices ahead.
It seems that our profits from the short positions are going to become truly epic in the following months.
After the sell-off (that takes gold to about $1,350 - $1,500), I expect the precious metals to rally significantly. The final part of the decline might take as little as 1-5 weeks, so it's important to stay alert to any changes.
Most importantly, please stay healthy and safe. We made a lot of money last March and this March, and it seems that we’re about to make much more on the upcoming decline, but you have to be healthy to enjoy the results.
As always, we'll keep you - our subscribers - informed.
To summarize:
Trading capital (supplementary part of the portfolio; our opinion): Full speculative short positions (300% of the full position) in junior mining stocks are justified from the risk to reward point of view with the following binding exit profit-take price levels:
Mining stocks (price levels for the GDXJ ETF): binding profit-take exit price: $35.73; stop-loss: none (the volatility is too big to justify a stop-loss order in case of this particular trade)
Alternatively, if one seeks leverage, we’re providing the binding profit-take levels for the JDST (2x leveraged) and GDXD (3x leveraged – which is not suggested for most traders/investors due to the significant leverage). The binding profit-take level for the JDST: $16.18; stop-loss for the JDST: none (the volatility is too big to justify a SL order in case of this particular trade); binding profit-take level for the GDXD: $32.08; stop-loss for the GDXD: none (the volatility is too big to justify a SL order in case of this particular trade).
For-your-information targets (our opinion; we continue to think that mining stocks are the preferred way of taking advantage of the upcoming price move, but if for whatever reason one wants / has to use silver or gold for this trade, we are providing the details anyway.):
Silver futures downside profit-take exit price: $19.12
SLV profit-take exit price: $17.72
ZSL profit-take exit price: $41.38
Gold futures downside profit-take exit price: $1,683
HGD.TO – alternative (Canadian) inverse 2x leveraged gold stocks ETF – the upside profit-take exit price: $12.48
HZD.TO – alternative (Canadian) inverse 2x leveraged silver ETF – the upside profit-take exit price: $30.48
Long-term capital (core part of the portfolio; our opinion): No positions (in other words: cash
Insurance capital (core part of the portfolio; our opinion): Full position
Whether you already subscribed or not, we encourage you to find out how to make the most of our alerts and read our replies to the most common alert-and-gold-trading-related-questions.
Please note that we describe the situation for the day that the alert is posted in the trading section. In other words, if we are writing about a speculative position, it means that it is up-to-date on the day it was posted. We are also featuring the initial target prices to decide whether keeping a position on a given day is in tune with your approach (some moves are too small for medium-term traders, and some might appear too big for day-traders).
Additionally, you might want to read why our stop-loss orders are usually relatively far from the current price.
Please note that a full position doesn't mean using all of the capital for a given trade. You will find details on our thoughts on gold portfolio structuring in the Key Insights section on our website.
As a reminder - "initial target price" means exactly that - an "initial" one. It's not a price level at which we suggest closing positions. If this becomes the case (like it did in the previous trade), we will refer to these levels as levels of exit orders (exactly as we've done previously). Stop-loss levels, however, are naturally not "initial", but something that, in our opinion, might be entered as an order.
Since it is impossible to synchronize target prices and stop-loss levels for all the ETFs and ETNs with the main markets that we provide these levels for (gold, silver and mining stocks - the GDX ETF), the stop-loss levels and target prices for other ETNs and ETF (among other: UGL, GLL, AGQ, ZSL, NUGT, DUST, JNUG, JDST) are provided as supplementary, and not as "final". This means that if a stop-loss or a target level is reached for any of the "additional instruments" (GLL for instance), but not for the "main instrument" (gold in this case), we will view positions in both gold and GLL as still open and the stop-loss for GLL would have to be moved lower. On the other hand, if gold moves to a stop-loss level but GLL doesn't, then we will view both positions (in gold and GLL) as closed. In other words, since it's not possible to be 100% certain that each related instrument moves to a given level when the underlying instrument does, we can't provide levels that would be binding. The levels that we do provide are our best estimate of the levels that will correspond to the levels in the underlying assets, but it will be the underlying assets that one will need to focus on regarding the signs pointing to closing a given position or keeping it open. We might adjust the levels in the "additional instruments" without adjusting the levels in the "main instruments", which will simply mean that we have improved our estimation of these levels, not that we changed our outlook on the markets. We are already working on a tool that would update these levels daily for the most popular ETFs, ETNs and individual mining stocks.
Our preferred ways to invest in and to trade gold along with the reasoning can be found in the how to buy gold section. Furthermore, our preferred ETFs and ETNs can be found in our Gold & Silver ETF Ranking.
As a reminder, Gold & Silver Trading Alerts are posted before or on each trading day (we usually post them before the opening bell, but we don't promise doing that each day). If there's anything urgent, we will send you an additional small alert before posting the main one.
Thank you.
Przemyslaw Radomski, CFA
Founder, Editor-in-chief

