

Briefly: in our opinion, full (300% of the regular position size) speculative short positions in junior mining stocks are justified from the risk/reward point of view at the moment of publishing this Alert.
Yesterday’s session was informative. Very. I already indicated some of the specific developments during yesterday’s (pre-market) trading (and I talked about silver and bitcoin in another video as well), but having the closing prices, and knowing what happened on a day-to-day basis adds a new dimension to the signals that we saw.
Let’s jump into charts.
What Was So Important About Yesterday?
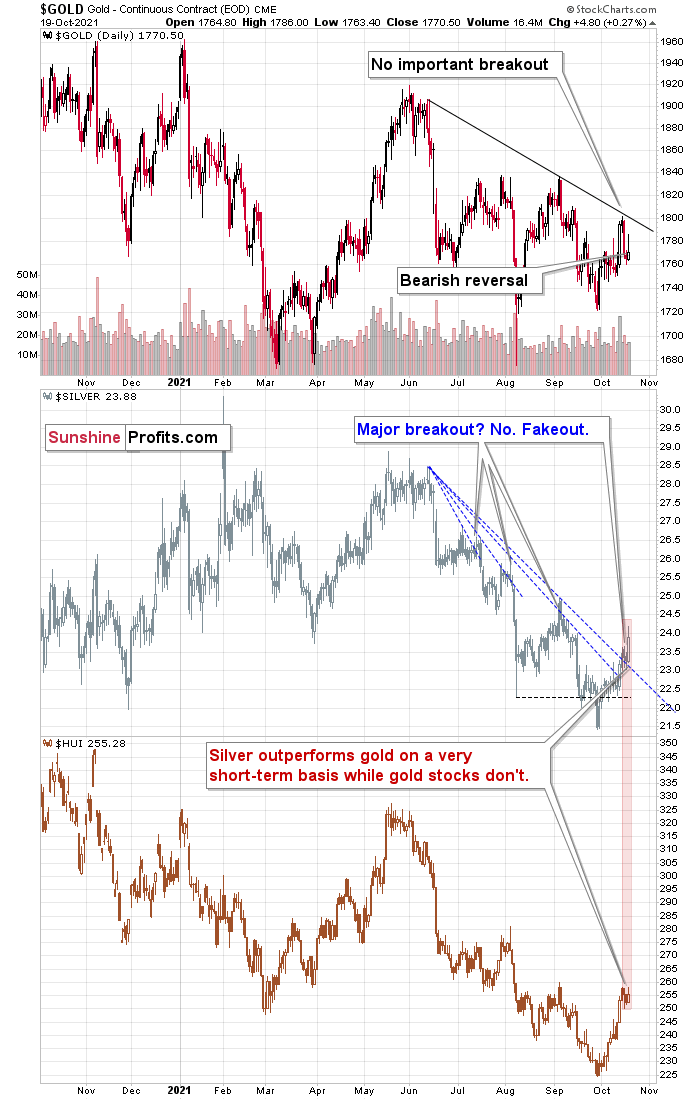
The key thing that happened yesterday was that silver rallied profoundly while gold stocks didn’t. The latter moved just a little higher, just like gold. This tells us that the rally has most likely either run its course completely or that its end is just around the corner. I’ve been emphasizing this many times before, but it’s so important (and so ignored) that I’m going to repeat it once again – silver tends to outperform in the final part of a rally in the precious metals market. This – by itself – is one of key indications that a top is just around the corner or that we have already seen one.
Yesterday’s daily reversal in gold only adds to the bearish implications of the session. Despite the attempt to move much higher, gold ended the day a mere $4.80 higher.
The key development, though, happened not in the precious metals market, but in the USD Index. Namely, the USD Index managed not to close back below the previous 2021 highs in terms of the closing prices.
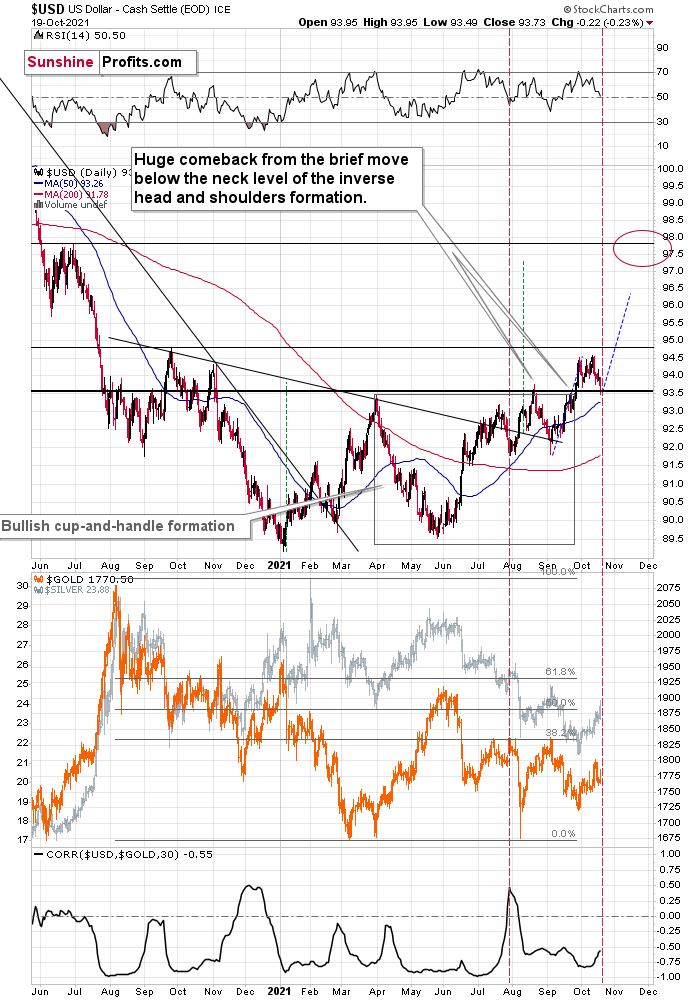
The U.S. currency did end the day lower, but it was after a recovery from a much bigger intraday decline. The August top in terms of the daily closing prices is 93.59, and while yesterday’s intraday lows was 93.49, the USDX closed the day at 93.73. The key support held and – obviously – that’s a bullish development for the USDX. Since the latter tends to move in the opposite way to the gold price and silver price, we can say that the above is bearish for the precious metals sector.
The lower part of the above charts shows the correlation between the USDX and gold (based on the previous 30 trading days) and as you can see, the correlation is almost always negative, and usually strongly negative – below -0.5.
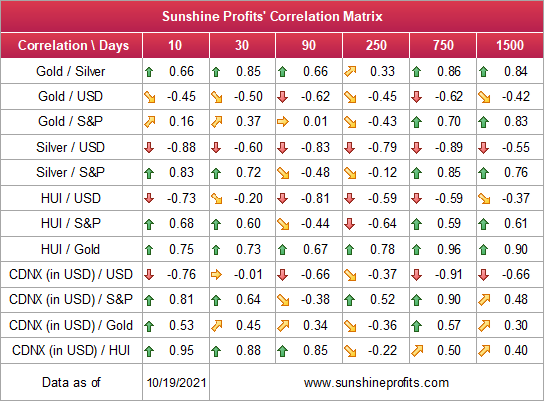
As you can see in the above Correlation Matrix (second row from the top), gold is negatively correlated with the USD Index also in the medium term and in the long term, so this link is quite stable, even though there are exceptions (for example, at times gold shows strength despite the USD’s rallies and it indicates great buying opportunities for gold).
The correlation now moved higher, but please note that we saw something similar (to an even bigger extent) in late July, and that was when gold and the USDX itself were performing similarly to what we saw recently. Even the RSI indicator (upper part of the chart) was close to 50 in both cases.
Gold and silver are slightly up in today’s pre-market trading, but it doesn’t change any of the above. The USD Index is still above the highest daily close that we saw in August.
Consequently, while yesterday’s session might have appeared to be something major, it turned out to be just a combination of factors that we saw at the final days of short-term rallies many times before. It seems that the medium-term downtrend will resume any day now.
Having said that, let’s move to a more fundamental take on the markets.
The New Narrative
While market sentiment implies that the USD Index’s best days are in the rearview, the ‘new narrative’ couldn’t be further from the truth. To explain, Bloomberg published the following article on Oct. 19:
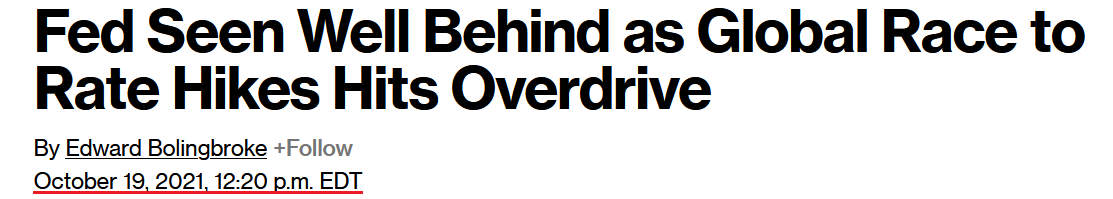
The piece proclaimed:
“U.S. traders are now pricing a full rate hike into the Fed’s September policy meeting next year. But by that time, New Zealand’s central bank would have hiked five times, Canada’s three times and England’s four times, according to the interest-rate swaps market.”
For starters, with the BoE turning hawkish and signaling potential rate hikes, we’ll concede that the GBP has a strong fundamental foundation. However, the CAD is a different story. For example, BoC Governor Tiff Macklem (Canada’s Jerome Powell) reiterated on Oct. 7 that he views inflation as “temporary” and that “part of that is base year effects. Prices were very low a year ago. They've normalized. Part of that is related to these very unique circumstances of the pandemic.”
Thus, while the head of the BoC preaches patience, the latest Commitments of Traders (COT) report revealed that non-commercial (speculative) futures traders increased their net-short CAD positions last week and that net-shorts are now at their highest level since August 2020.
Please see below:
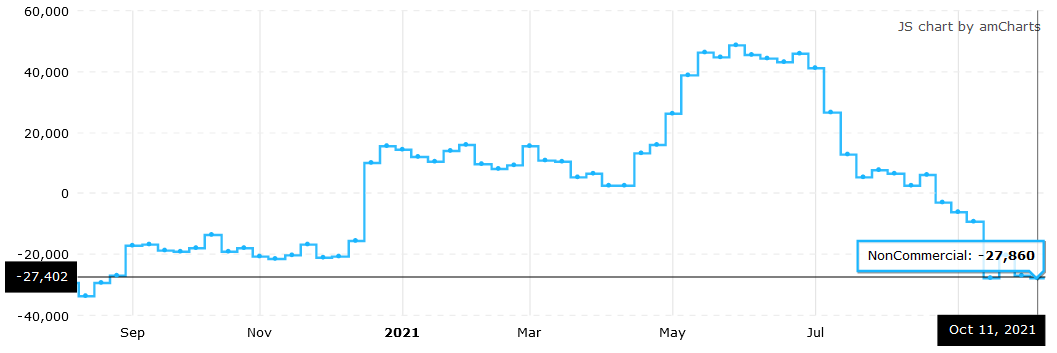
Source: COT
Second, while New Zealand may attempt to outpace the Fed, it’s important to remember that the euro, the JPY and the CAD combine to account for 80.3% of the USD Index’s movement. And with the BoJ and the ECB reaffirming their dovish dispositions, the euro is living on borrowed confidence. To explain, non-commercial (speculative) futures traders recently turned net-short the euro for the first time since March 2020.
Please see below:
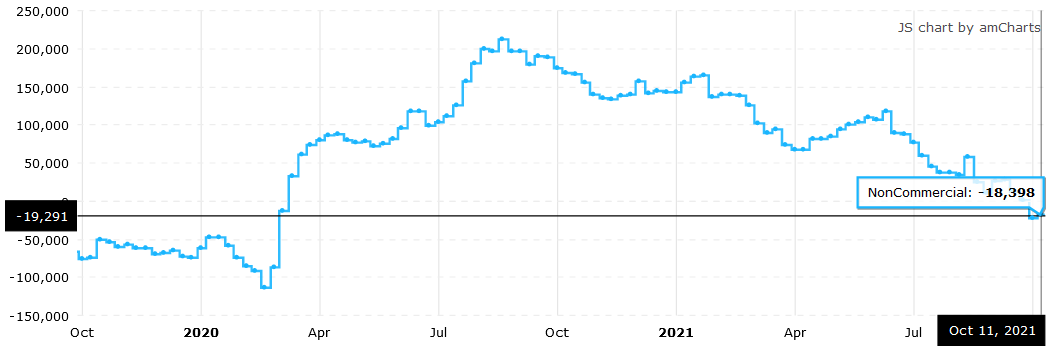 Source: COT
Moreover, ECB President Christine Lagarde said on Oct. 16 that “monetary policy will continue supporting the economy in order to durably stabilize inflation at our 2% inflation target over the medium term.” And “once the pandemic emergency comes to an end – which is drawing closer – our forward guidance on rates as well as asset purchases will ensure that monetary policy remains supportive of the timely attainment of our target.”
Furthermore, with the ECB already discussing a new QE program to replace its PEPP program – which is scheduled to expire at the end of March 2022 – the EUR/USD’s recent rally is much more semblance than substance. Supporting that point, ECB Chief Economist Philip Lane said on Oct. 19 that investors’ forecast of ECB policy contrasts the central bank’s actual forward guidance:
“Markets may not have fully absorbed the ECB’s forward guidance,” said Lane. “When you look at market prices of the forward interest rate curve, I think it’s challenging to reconcile some of the market views with our pretty clear, straightforward forward guidance.”
And understanding this reality, Rabobank told its clients on Oct. 19 that “while the recent sell-off in the EUR suggests it may be more sensitive to hawkish remarks from ECB members in the build-up to forthcoming ECB meetings, the cautious stance of the policy guidance from the central bank suggests that room for a concerted recovery in the EUR is still limited.
“We are viewing the current pullbacks in the USD as corrective and continue to expect the USD to push higher over the medium-term. We retain our three-month forecast of EUR/USD 1.15.”
Also contrasting the U.S. dollar’s ‘new narrative,’ non-commercial (speculative) futures traders, asset managers and leveraged funds’ allocations to the U.S. dollar are at or near their 2021 highs.
Please see below:
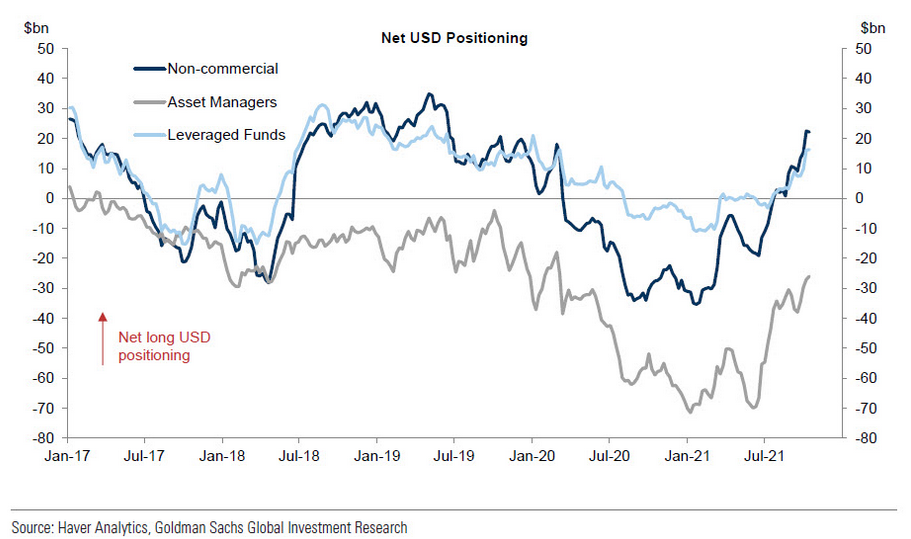
To explain, the dark blue, gray, and light blue lines above represent net-long positions of non-commercial (speculative) futures traders, asset managers and leveraged funds. When the lines are falling, it means that the trio have reduced their net-long positions and are expecting a weaker U.S. dollar. Conversely, when the lines are rising, it means that the trio have increased their net-long positions and are expecting a stronger U.S. dollar.
And while non-commercial (speculative) futures traders’ allocation to the U.S. dollar remains slightly below its 2021 highs (the dark blue line), asset managers and leveraged funds’ allocations to the U.S. dollar have hit new 2021 highs (the gray and light blue lines). As a result, the media is running with a narrative that lacks a fundamental foundation.
As further evidence, as Lane reiterated the ECB’s “pretty clear, straightforward forward guidance,” Fed Governor Christopher Waller was hawked up on Oct. 19. He said that he’s “greatly concerned” about inflation and that “a more aggressive policy response” may be necessary to calm the pricing pressures:
“Firms are reporting that they have more pricing power now than they have had in many years, as consumers seem to be accepting higher prices,” said Waller. “One needs to be careful when selectively ignoring data series – be it used car prices, food and energy prices, or household surveys of inflation expectations.”
As a result:
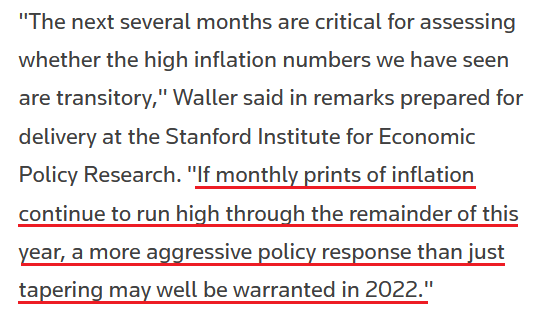 Source: Reuters
For context, Waller is a voting FOMC member, and if I’ve written it once, I’ve written it a thousand times: the Fed and the ECB are worlds apart.
Speaking of voting FOMC members, Fed Governor Michelle Bowman’s admission on Oct. 19 highlights the Fed’s inflationary anxiety. In essence, she said what I’ve been warning about for nearly eight months:
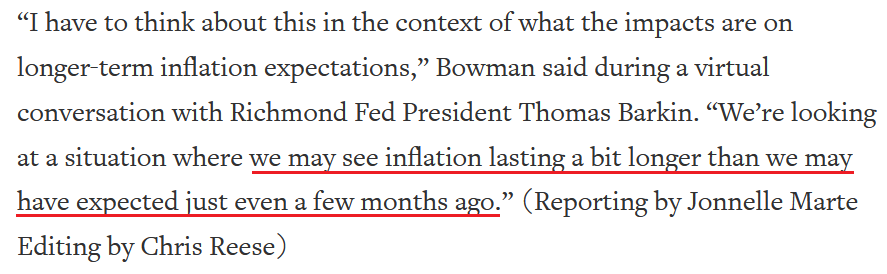 Source: Reuters
Finally, while the PMs ride the stock market’s wave of ‘risk-on’ sentiment, the U.S. 10-Year Treasury yield quietly closed at its highest level (1.65%) since May 17. And with the Treasury benchmark poised to hit new highs over the medium term, one of the PMs’ main fundamental adversaries has caught its second wind.
To explain, I wrote on Aug. 17:
While the data will ultimately determine the outcome in the coming months, the U.S. 10-Year Treasury yield may have already bottomed at roughly 1.1276%.
With the U.S. 10-Year Treasury yield weighed down by rational skepticism – the Fed’s liquidity drain, taper timeline and the Delta variant have depressed economic sentiment. As a result, the U.S. economy will have to prove its durability and bond investors will not give it the benefit of the doubt. However, while the impact of the Delta variant remains real, it’s likely another bump in the road. As a result, the mosaic of fundamentals implies a medium-term target for the U.S. 10-Year Treasury yield of 1.75%.
Please see below:
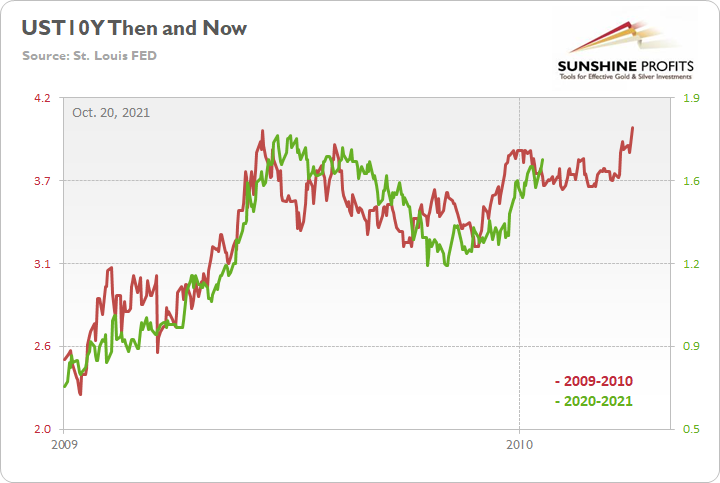
To explain, the red line above tracks the U.S. 10-Year Treasury yield’s rally off of the bottom in 2009-2010, while the green line above tracks the U.S. 10-Year Treasury yield’s current move. If you analyze the fits and starts, you can see that excessive optimism often gives way to excessive pessimism. However, after the dust settled in 2009, the U.S. 10-Year Treasury yield continued its uptrend and ultimately made a new high.
For context, the yield fell off a cliff in April 2010 before another sharp rally ensued in October 2010 (which recouped most of the losses). However, the important point is that the second cliff arrived roughly four months after the U.S. 10-Year Treasury yield recorded its second bottom. As a result, with the pace of the current economic recovery tracking well ahead of 2009, it will likely take a Black Swan event to keep the U.S. 10-Year Treasury yield from following a similar script.
The bottom line? While headlines have turned on the U.S. dollar, the greenback’s fundamentals remain robust. The ECB and the BoJ are more dovish than the Fed (the EUR/USD and the USD/JPY are the most important currency pairs within the USD Index) and the BoC still hasn’t made any major moves. Likewise, with rising U.S. Treasury yields also supportive of a stronger U.S. dollar, the greenback should continue its uptrend once reality re-emerges once again.
In conclusion, the PMs rallied on Oct. 19, though the moves were largely immaterial. Moreover, while the USD Index struggled mightily overnight on Oct. 19, the dollar basket rallied hard during the U.S. session and recouped a large chunk of its losses. Furthermore, it’s no coincidence that hawkish Fed speak and dovish ECB speak helped bring the EUR/USD back down to earth. As a result, with the USD Index likely to resume its uptrend over the next few months, the PMs should confront more selling pressure as we move closer to the end of 2021.
Overview of the Upcoming Part of the Decline
- It seems to me that the current corrective upswing in gold is over, and the next short-term move lower is about to begin. Since it seems to be another short-term move more than it seems to be a continuation of the bigger decline, I think that junior miners would be likely to (at least initially) decline more than silver.
- It seems that the first stop for gold will be close to its previous 2021 lows, slightly below $1,700. Then it will likely correct a bit, but it’s unclear if I want to exit or reverse the current short position based on that – it depends on the number and the nature of the bullish indications that we get at that time.
- After the above-mentioned correction, we’re likely to see a powerful slide, perhaps close to the 2020 low ($1,450 - $1,500).
- If we see a situation where miners slide in a meaningful and volatile way while silver doesn’t (it just declines moderately), I plan to – once again – switch from short positions in miners to short positions in silver. At this time, it’s too early to say at what price levels this could take place, and if we get this kind of opportunity at all – perhaps with gold close to $1,600.
- I plan to exit all remaining short positions when gold shows substantial strength relative to the USD Index while the latter is still rallying. This might take place with gold close to $1,350 - $1,400. I expect silver to fall the hardest in the final part of the move. This moment (when gold performs very strongly against the rallying USD and miners are strong relative to gold after its substantial decline) is likely to be the best entry point for long-term investments, in my view. This might also happen with gold close to $1,375, but it’s too early to say with certainty at this time. I expect the final bottom to take place near the end of the year, perhaps in mid-December.
- As a confirmation for the above, I will use the (upcoming or perhaps we have already seen it?) top in the general stock market as the starting point for the three-month countdown. The reason is that after the 1929 top, gold miners declined for about three months after the general stock market started to slide. We also saw some confirmations of this theory based on the analogy to 2008. All in all, the precious metals sector is likely to bottom about three months after the general stock market tops.
- The above is based on the information available today, and it might change in the following days/weeks.
You will find my general overview of the outlook for gold on the chart below:
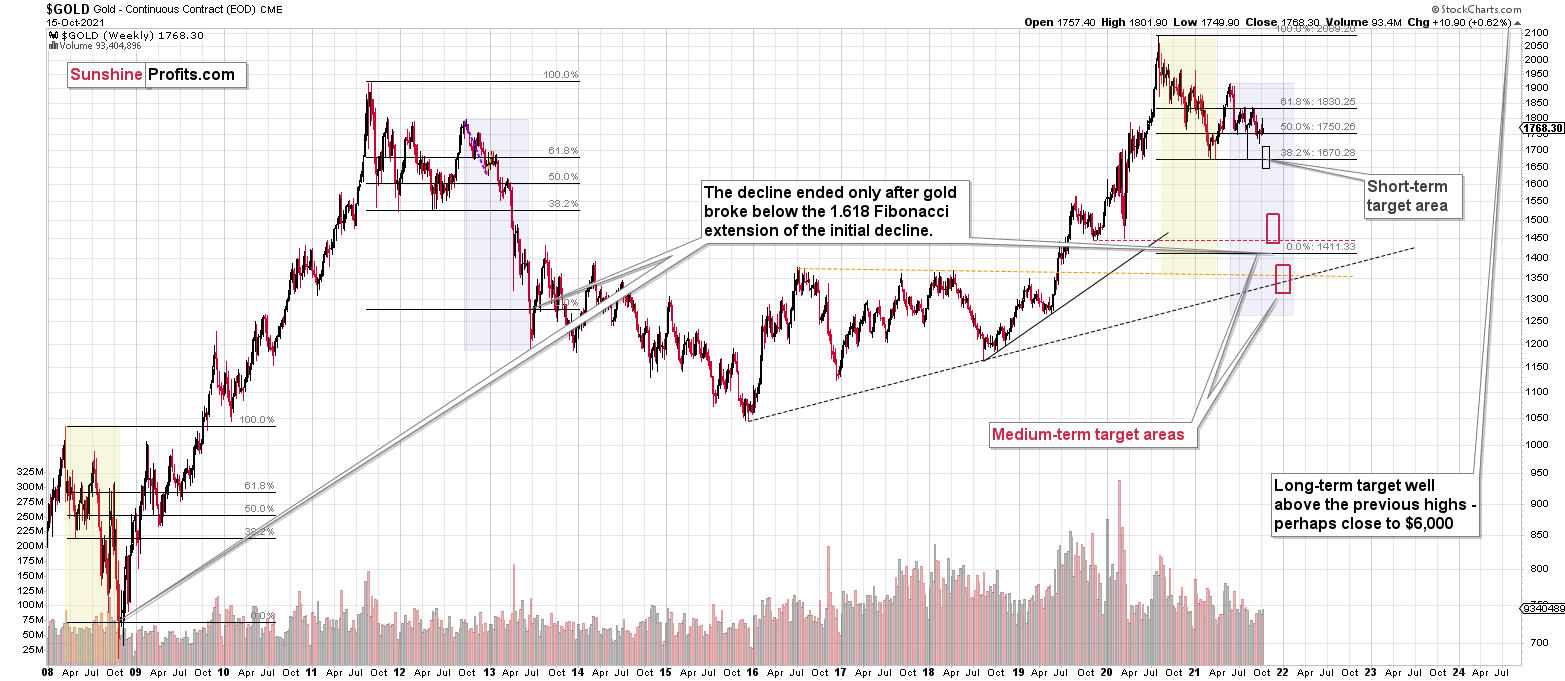
Please note that the above timing details are relatively broad and “for general overview only” – so that you know more or less what I think and how volatile I think the moves are likely to be – on an approximate basis. These time targets are not binding or clear enough for me to think that they should be used for purchasing options, warrants or similar instruments.
Letters to the Editor
Q: Mr. Radomski advised weeks ago to short silver but moved the short to GDXJ because the percentage decline would be bigger. Did he mean to say silver is not going down from this point forward, or is it just better to short GDXJ for a bigger percentage drop?
A: It’s important to note that I’m not providing investment advice, just my personal and general opinion about the markets, based on diligent research. However, to make a long story short, it’s the latter. I do think that silver will decline significantly, however, I also think that at this point in the medium-term decline, I think it’s better to be shorting junior miners (e.g., through the GDXJ) than silver.
Summary
To summarize, the outlook for the precious metals sector remains extremely bearish for the next few months. Since it seems that the PMs are starting another short-term move lower more than it seems that they are continuing their bigger decline, I think that junior miners would be likely to (at least initially) decline more than silver.
From the medium-term point of view, the key two long-term factors remain the analogy to 2013 in gold and the broad head and shoulders pattern in the HUI Index. They both suggest much lower prices ahead.
It seems that our profits from the short positions are going to become truly epic in the following months.
After the sell-off (that takes gold to about $1,350 - $1,500), I expect the precious metals to rally significantly. The final part of the decline might take as little as 1-5 weeks, so it's important to stay alert to any changes.
Most importantly, please stay healthy and safe. We made a lot of money last March and this March, and it seems that we’re about to make much more on the upcoming decline, but you have to be healthy to enjoy the results.
As always, we'll keep you - our subscribers - informed.
By the way, we’re currently providing you with the possibility to extend your subscription by a year, two years, or even three years with a special 20% discount. This discount can be applied right away, without the need to wait for your next renewal – if you choose to secure your premium access and complete the payment upfront. The boring time in the PMs is definitely over, and the time to pay close attention to the market is here. Naturally, it’s your capital, and the choice is up to you, but it seems that it might be a good idea to secure more premium access now while saving 20% at the same time. Our support team will be happy to assist you in the above-described upgrade at preferential terms – if you’d like to proceed, please contact us.
To summarize:
Trading capital (supplementary part of the portfolio; our opinion): Full speculative short positions (300% of the full position) in junior mining stocks are justified from the risk to reward point of view with the following binding exit profit-take price levels:
Mining stocks (price levels for the GDXJ ETF): binding profit-take exit price: $35.73; stop-loss: none (the volatility is too big to justify a stop-loss order in case of this particular trade)
Alternatively, if one seeks leverage, we’re providing the binding profit-take levels for the JDST (2x leveraged) and GDXD (3x leveraged – which is not suggested for most traders/investors due to the significant leverage). The binding profit-take level for the JDST: $16.18; stop-loss for the JDST: none (the volatility is too big to justify a SL order in case of this particular trade); binding profit-take level for the GDXD: $32.08; stop-loss for the GDXD: none (the volatility is too big to justify a SL order in case of this particular trade).
For-your-information targets (our opinion; we continue to think that mining stocks are the preferred way of taking advantage of the upcoming price move, but if for whatever reason one wants / has to use silver or gold for this trade, we are providing the details anyway.):
Silver futures downside profit-take exit price: $19.12
SLV profit-take exit price: $17.72
ZSL profit-take exit price: $41.38
Gold futures downside profit-take exit price: $1,683
HGD.TO – alternative (Canadian) inverse 2x leveraged gold stocks ETF – the upside profit-take exit price: $12.48
Long-term capital (core part of the portfolio; our opinion): No positions (in other words: cash
Insurance capital (core part of the portfolio; our opinion): Full position
Whether you already subscribed or not, we encourage you to find out how to make the most of our alerts and read our replies to the most common alert-and-gold-trading-related-questions.
Please note that we describe the situation for the day that the alert is posted in the trading section. In other words, if we are writing about a speculative position, it means that it is up-to-date on the day it was posted. We are also featuring the initial target prices to decide whether keeping a position on a given day is in tune with your approach (some moves are too small for medium-term traders, and some might appear too big for day-traders).
Additionally, you might want to read why our stop-loss orders are usually relatively far from the current price.
Please note that a full position doesn't mean using all of the capital for a given trade. You will find details on our thoughts on gold portfolio structuring in the Key Insights section on our website.
As a reminder - "initial target price" means exactly that - an "initial" one. It's not a price level at which we suggest closing positions. If this becomes the case (like it did in the previous trade), we will refer to these levels as levels of exit orders (exactly as we've done previously). Stop-loss levels, however, are naturally not "initial", but something that, in our opinion, might be entered as an order.
Since it is impossible to synchronize target prices and stop-loss levels for all the ETFs and ETNs with the main markets that we provide these levels for (gold, silver and mining stocks - the GDX ETF), the stop-loss levels and target prices for other ETNs and ETF (among other: UGL, GLL, AGQ, ZSL, NUGT, DUST, JNUG, JDST) are provided as supplementary, and not as "final". This means that if a stop-loss or a target level is reached for any of the "additional instruments" (GLL for instance), but not for the "main instrument" (gold in this case), we will view positions in both gold and GLL as still open and the stop-loss for GLL would have to be moved lower. On the other hand, if gold moves to a stop-loss level but GLL doesn't, then we will view both positions (in gold and GLL) as closed. In other words, since it's not possible to be 100% certain that each related instrument moves to a given level when the underlying instrument does, we can't provide levels that would be binding. The levels that we do provide are our best estimate of the levels that will correspond to the levels in the underlying assets, but it will be the underlying assets that one will need to focus on regarding the signs pointing to closing a given position or keeping it open. We might adjust the levels in the "additional instruments" without adjusting the levels in the "main instruments", which will simply mean that we have improved our estimation of these levels, not that we changed our outlook on the markets. We are already working on a tool that would update these levels daily for the most popular ETFs, ETNs and individual mining stocks.
Our preferred ways to invest in and to trade gold along with the reasoning can be found in the how to buy gold section. Furthermore, our preferred ETFs and ETNs can be found in our Gold & Silver ETF Ranking.
As a reminder, Gold & Silver Trading Alerts are posted before or on each trading day (we usually post them before the opening bell, but we don't promise doing that each day). If there's anything urgent, we will send you an additional small alert before posting the main one.
Thank you.
Przemyslaw Radomski, CFA
Founder, Editor-in-chief

