

Briefly: in our opinion, full (300% of the regular position size) speculative short positions in mining stocks are justified from the risk/reward point of view at the moment of publishing this Alert.
I previously warned that silver had been likely to invalidate its recent comeback above its previous lows and it did exactly that. The decline is now likely to resume.
It is a particularly interesting phenomenon present on the silver market that its price tends to soar relatively to gold, and at times breaks above certain technical resistance levels just before turning south and starting a major decline. We saw this kind of behavior multiple times in the past and also very recently.
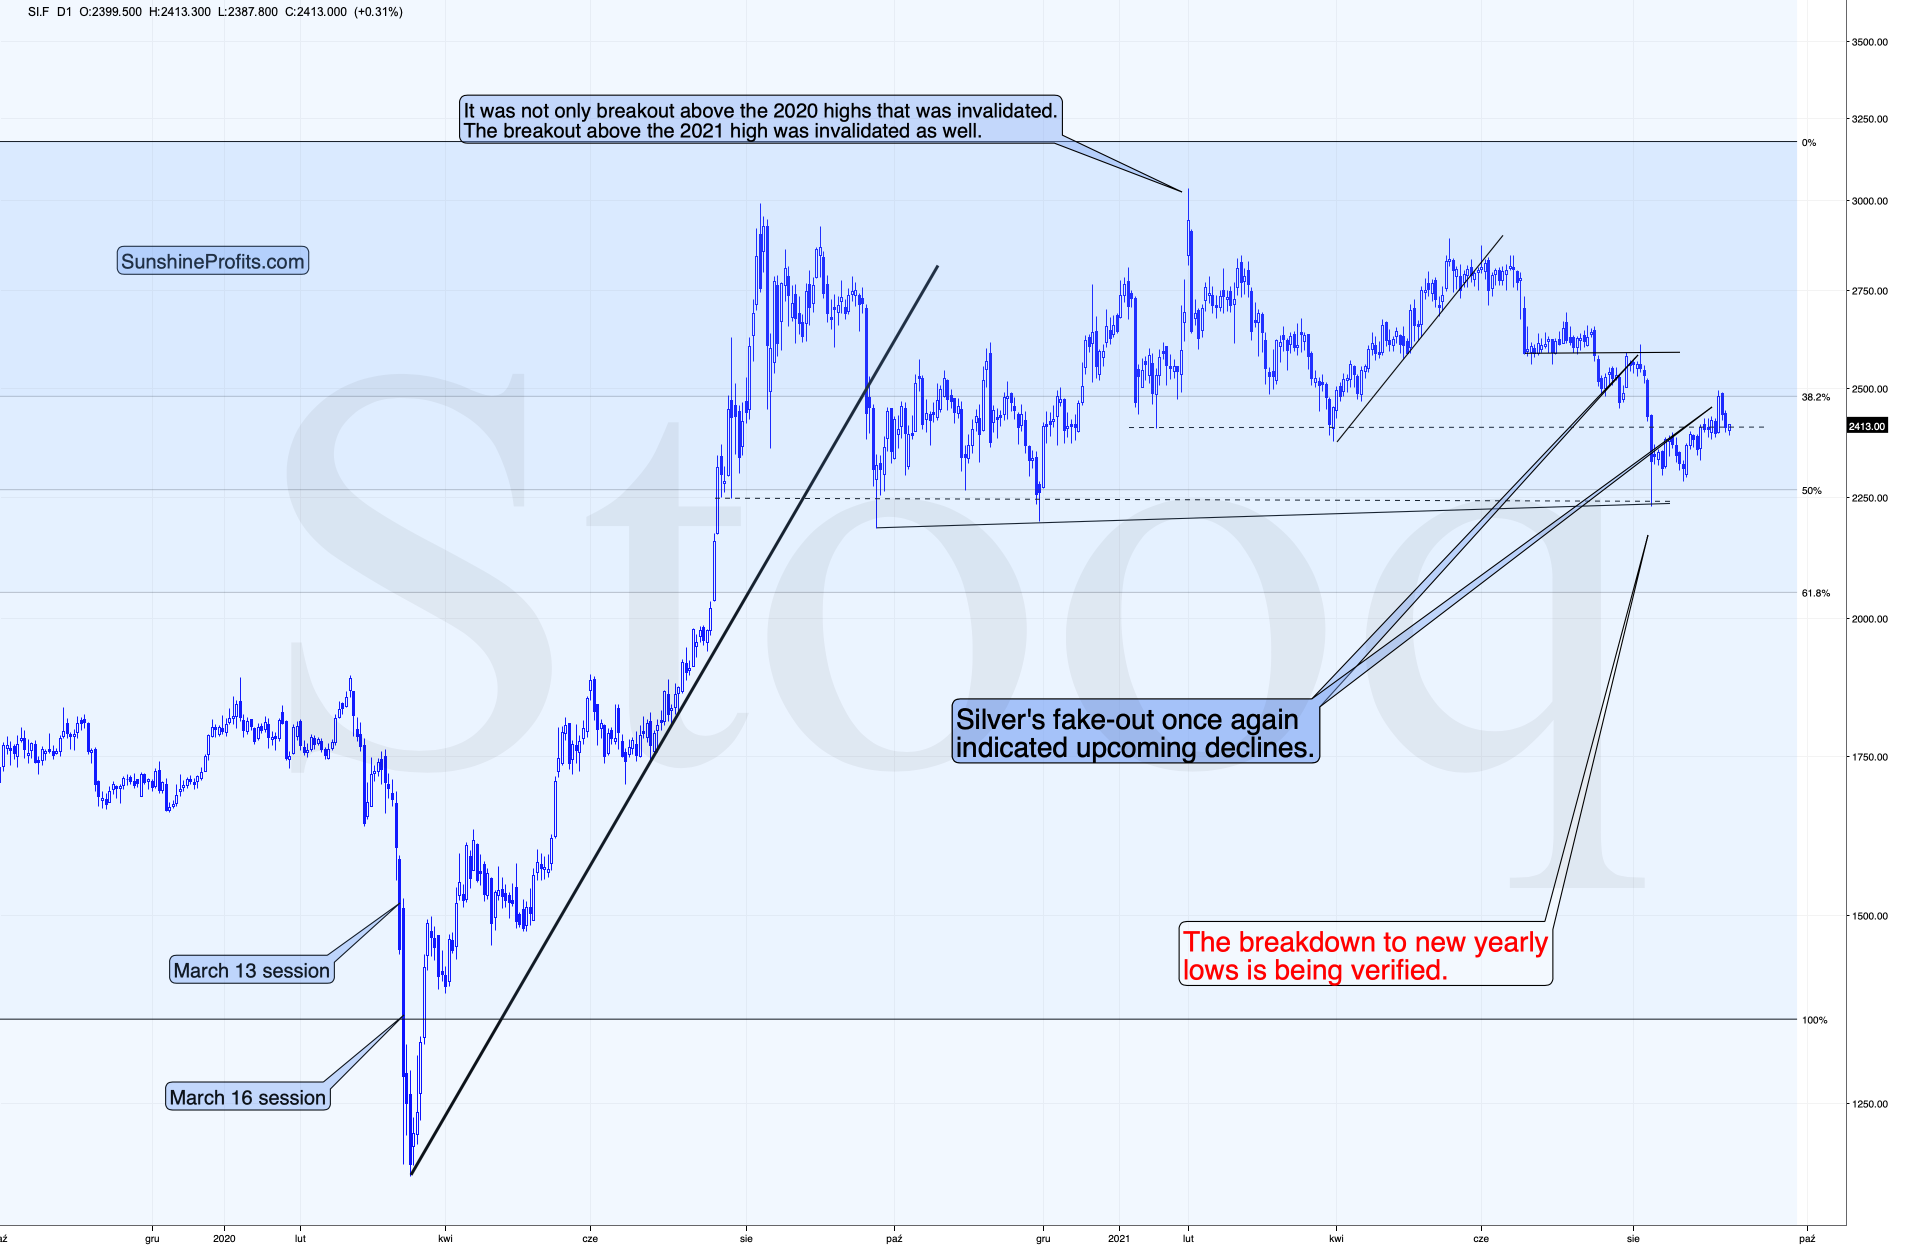
Remember when silver formed this year’s high at the beginning of February? It did so while outperforming gold and while breaking above the previous highs. Did this trigger a massive rally that so many people claimed was inevitable? No. That was the yearly top.
And a more recent example – remember the August 4 rally in silver that took it much higher and above its June lows? That happened right before the biggest short-term decline of the recent months. And yes, that day when silver supposedly broke the previous highs was the top. Higher silver prices have not been seen since that time.
Fast-forward to the most recent developments. We have silver that rallied particularly visibly relative to gold, and it broke above its previous 2021 lows. It also just invalidated this move this week. What’s likely to happen next? The history is likely to rhyme, and silver is likely to decline significantly, most likely taking the rest of the precious metals market with it.
The fact that the USD Index is about to soar based on its broad inverse head and shoulders formation only adds credibility to the above scenario.
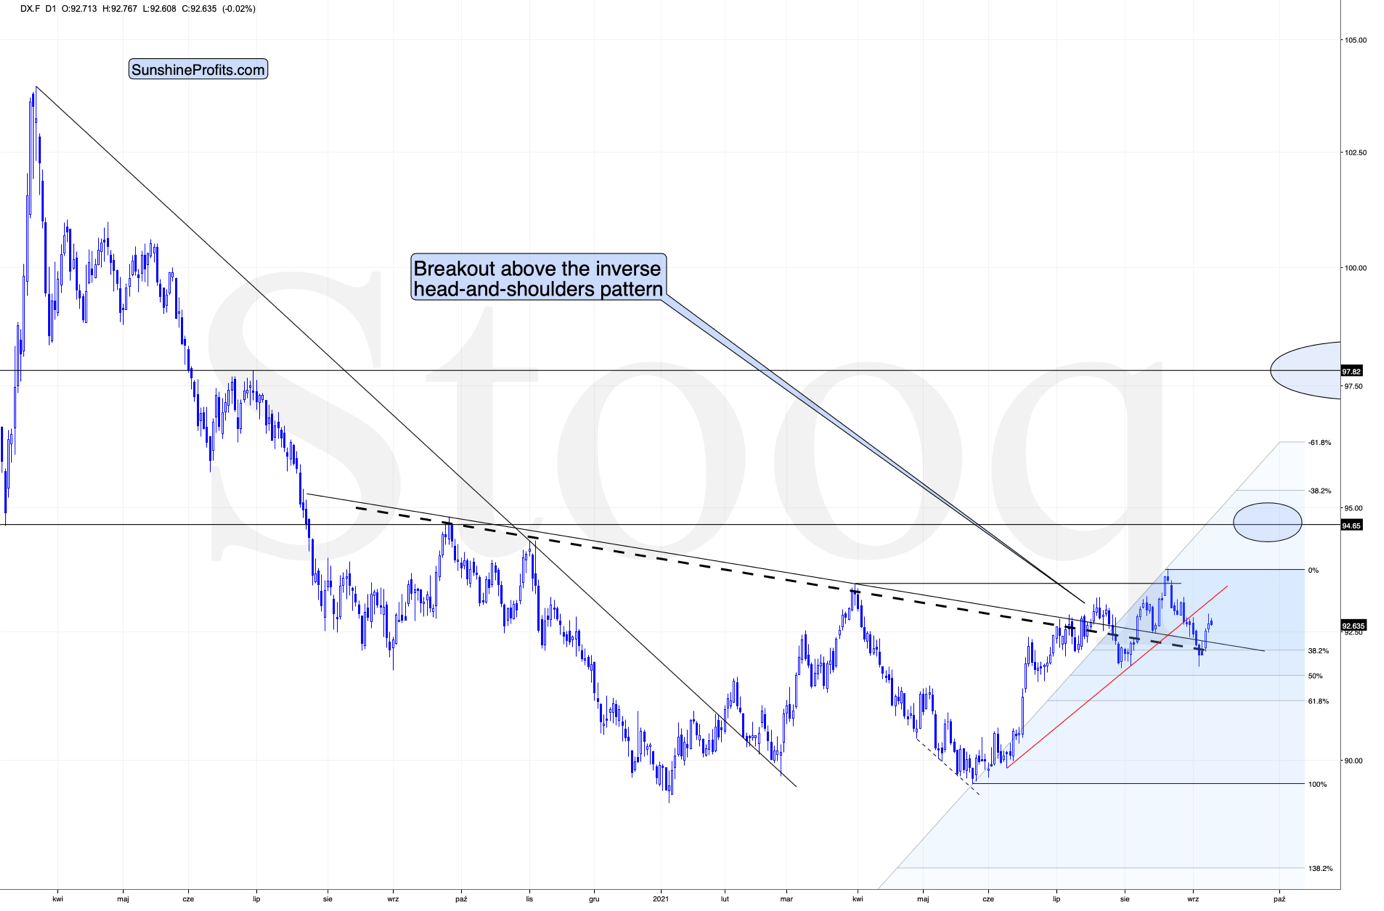
Despite the late-August decline, the USDX recovered and is clearly back above the neck level of the previously completed pattern. The implications are bullish for the USDX and bearish for the precious metals sector, which are usually moving in the opposite direction to the USD Index.
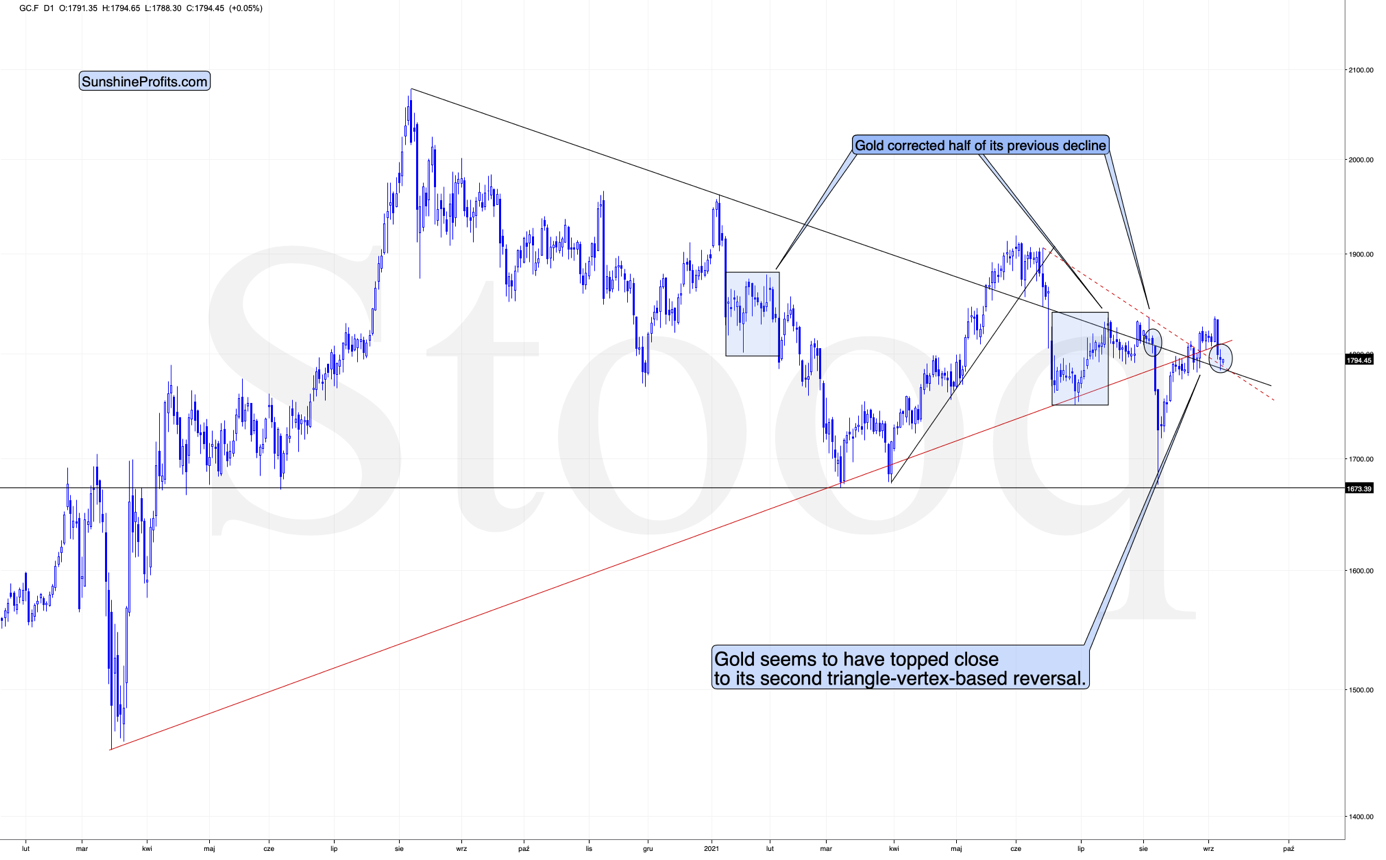
Gold hesitated after declining earlier this week, but there’s a good technical reason for it – it paused after reaching two declining support lines: the black line that also stopped the rally for a brief time in early August, and the red dashed line. Just as we saw in early August, this support is unlikely to prevent the declines for long.
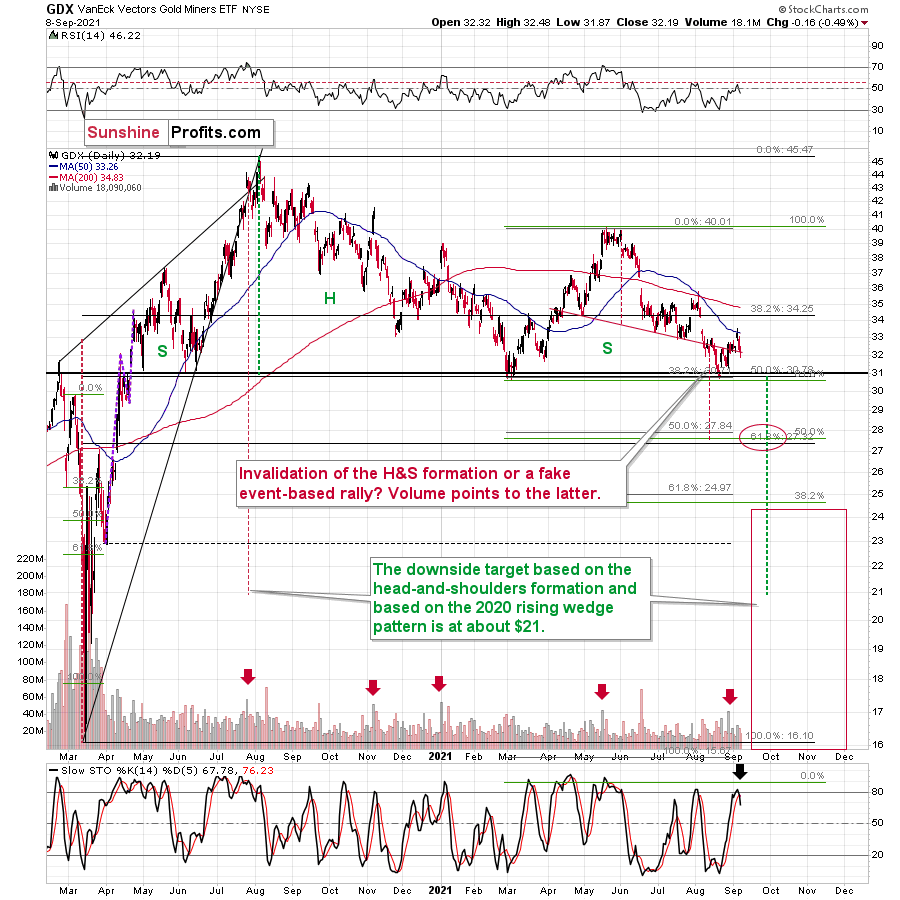
Meanwhile, mining stocks didn’t do much yesterday – they declined only slightly. However, the thing that I would like to draw your attention to today is the sell signal from the Stochastic indicator. It’s yet another indication that on a short-term basis we’re seeing a repeat of what we saw in early August.
All this is very bearish, especially given the major post-U.S.-Labor-Day cyclicality in gold that I discussed yesterday and last week.
Having said that, let’s take a look at the market from a more fundamental angle.
Walk Through the Fire
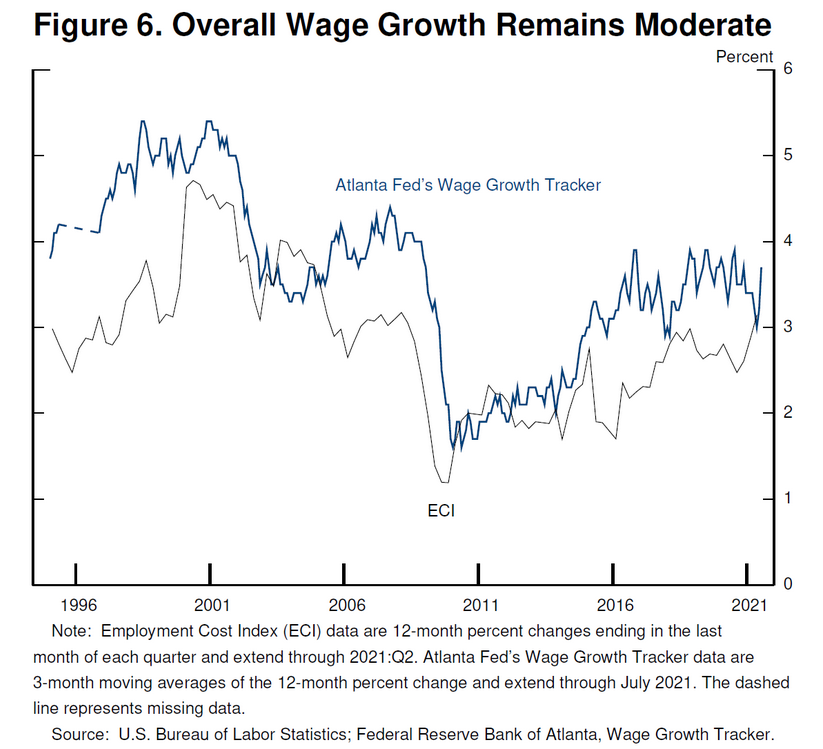
With inflation burning throughout the U.S. economy and the Fed confident that it can contain the flames, Chairman Jerome Powell remains married to his “transitory” narrative. And after he cited wage inflation as “moderate” – even though consolidated average hourly earnings increased by 4.3% year-over-year (YoY) and leisure & hospitality wage growth soared by 10.3% YoY on Sep. 3 – Powell often peddles semblance over substance.
To explain, I wrote on Sep. 2:
While Fed Chairman Jerome Powell said at the Jackson Hole Economic Symposium on Aug. 27 that “we see little evidence of wage increases that might threaten excessive inflation,” the year-over-year (YoY) percentage increase in the Employment Cost Index (ECI) in the second quarter (3.55%) was the highest since 2002. For context, Powell actually cited the Atlanta Fed’s wage tracker and the ECI to support his conclusion.
Please see below:
Moreover, while fiction remains his novel of choice, wage inflation has accelerated even more since his speech. For example, Walmart – the largest employer in the U.S. – announced on Sep. 2 that in-store employees will receive a raise of at least $1 per hour, which increases the retailer’s average hourly wage to $16.40.
Likewise, with an abounding labor shortage, Southwest Airlines Co-CEO Gary Kelly said on Sep. 2 that “ground ops is where we’re finding the greatest competition for workers. The fact that we can hire one or two is encouraging, but you still can’t grow any faster than the slowest group.” Similarly, Thomas Rajan, VP of global talent at American Airlines, added that “you need this aggressive ground game to go where candidates are, and it is absolutely -- I hate to characterize it as a battle, but it is.”
Thus, with the airline industry aiming to hire thousands of pilots and flight attendants – not to mention baggage handlers, ticket/gate agents, cabin cleaners, aircraft fuelers and individuals that restock galleys – does it seem likely that wage inflation will abate anytime soon?
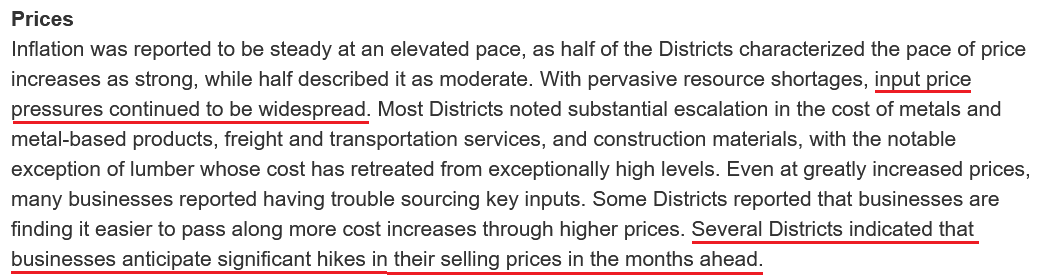
To that point, the Fed released its Beige Book on Sep. 8. And with “persistent and extensive labor shortages” causing “an acceleration in wages,” the inflationary wildfire continues to spread:
“With persistent and extensive labor shortages, a number of Districts reported an acceleration in wages, and most characterized wage growth as strong—including all of the midwestern and western regions. Several Districts noted particularly brisk wage gains among lower-wage workers. Employers were reported to be using more frequent raises, bonuses, training, and flexible work arrangements to attract and retain workers.”
What’s more, with wage inflation only playing second fiddle to input inflation, supply chain disruptions and material shortages have the inflationary merry-go-round still running extremely hot.
Please see below:
 Source: U.S. Fed
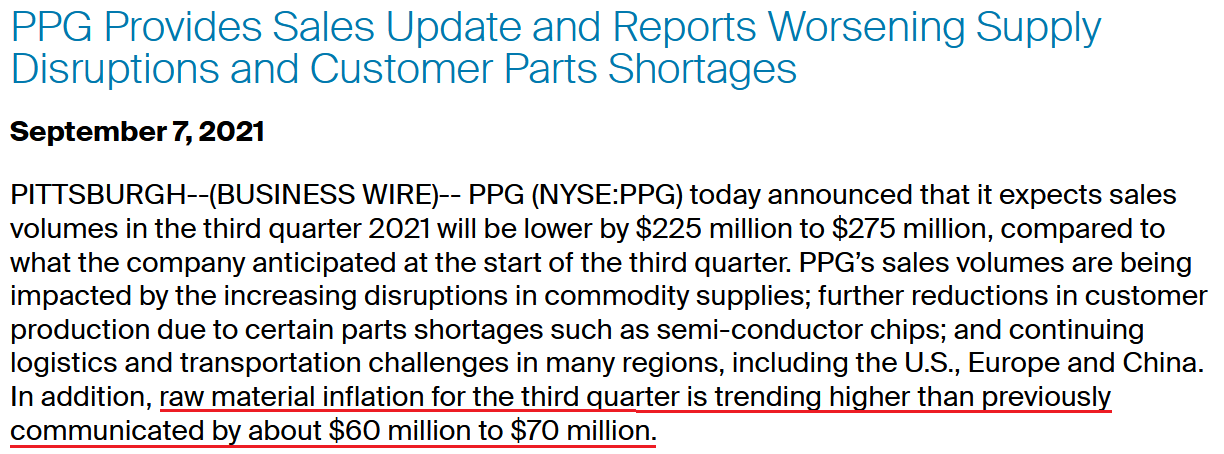
As further evidence, PPG Industries – a global supplier of paints, coatings, and specialty materials (and a member of the S&P 500) – announced on Sep. 7 that it’s withdrawing its “previously communicated financial guidance for the third quarter and full-year 2021.”
And why is that?
“The coatings commodity supply disruptions have further deteriorated since the company’s earnings announcement on July 19, due to several additional force majeure declarations and lower material allocations from certain suppliers. The company also continues to assess the full impact of Hurricane Ida, which could include additional supply chain effects.”
Please see below:
 Source: PPG
In addition, while I’ve been warning for months that inflation would come in much hotter than investors expected, upside surprises remain abundant even as economists increase their expectations. For context, an upside inflation surprise occurs when the realized data exceeds economists’ consensus estimate.
Please see below:
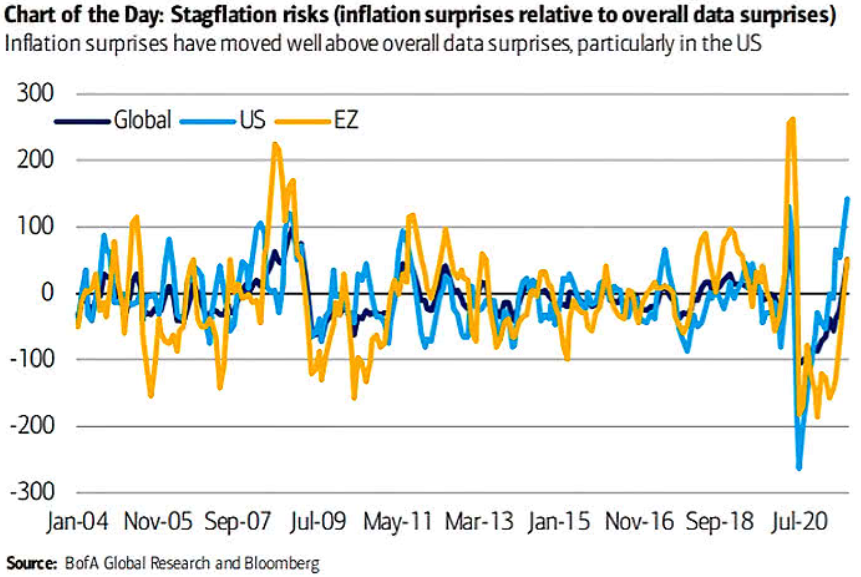
To explain, the light blue line (U.S.) above tracks inflation surprises relative to overall data surprises (like retail sales, GDP, nonfarm payrolls etc.). If you analyze the right side of the chart, you can see that inflation surprises are still rising. Moreover, as the Delta variant cools the denominator – with economic mobility stifled due to the outbreak – coronavirus disruptions only accelerate the inflationary momentum. As a result, the pricing pressures are unlikely to subside until the Fed tapers its asset purchases and reduces speculation in the commodities market.
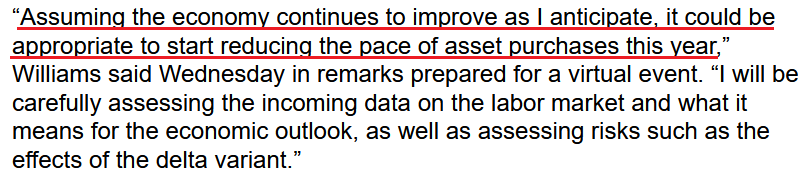
To that point, New York Fed President John Williams (a major dove) admitted on Sep. 8 that “I think it’s clear that we have made substantial further progress on achieving our inflation goal, [though], there has also been very good progress toward maximum employment, but I will want to see more improvement before I am ready to declare the test of substantial further progress being met.”
However, with U.S. job openings coming in at 10.934 million vs. 10 million expected on Sep. 8 (another all-time high), there are now 2.232 million more job openings in the U.S. than citizens unemployed.
Please see below:
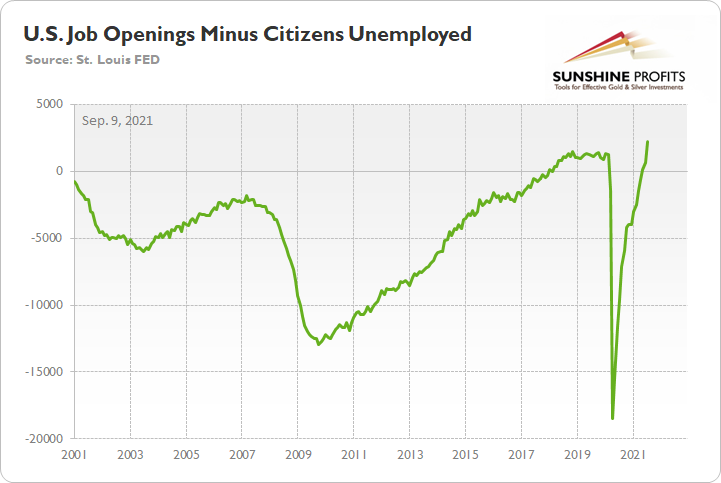
To explain, the green line above subtracts the number of unemployed U.S. citizens from the number of U.S. job openings. If you analyze the right side of the chart, you can see that the epic collapse has completely reversed, and the green line is now at an all-time high. Thus, with more jobs available than people looking for work, it’s only a matter of time before “substantial further progress” materializes.
And what does all of this mean for Williams’ taper timeline?
 Source: Bloomberg
For context, “to start reducing the pace of asset purchases this year,” an announcement will have to commence in September or November to provide investors with “advance notice.”
On the other side of the coin, the European Central Bank (ECB) will release its monetary policy statement today. And with ECB hawks reemerging in recent weeks, bullish bets on the EUR/USD have become fashionable once again. Moreover, because the currency pair accounts for nearly 58% of the movement of the USD Index, monitoring the situation is quite prudent.
Please see below:
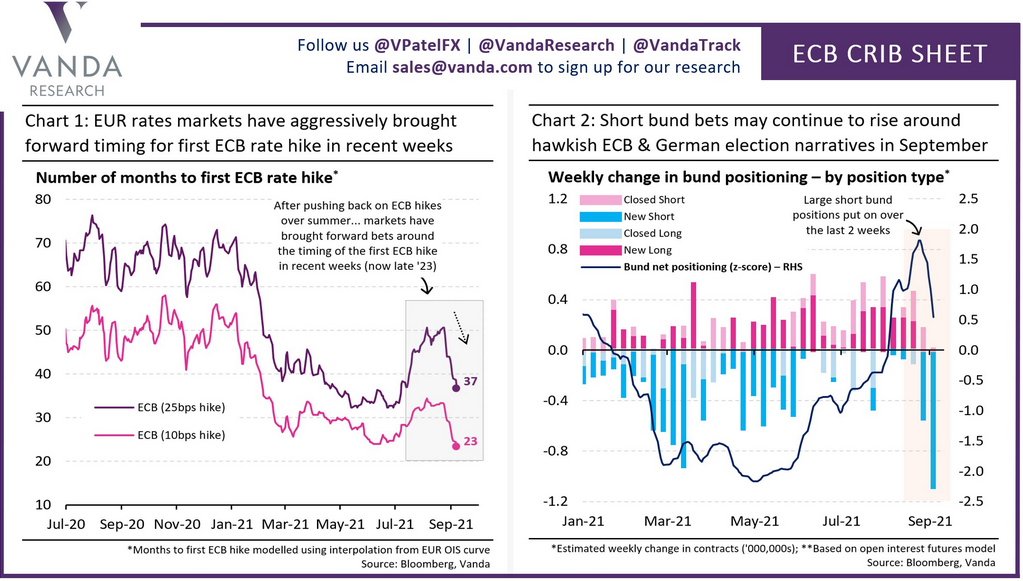
To explain, if you focus your attention on the chart on the left, the purple and pink lines track investors’ expectations for when the ECB will announce its first rate hike. If you follow the sharp drop in recent weeks, investors now expect that the ECB will hike interest rates by 25 basis points (the purple line) in 37 months instead of 50. Similarly, if you turn to the chart on the right, the long blue bar furthest to the right depicts how speculators’ short positions of German Bunds have surged over the last two weeks (expecting a hawkish uprising in interest rates).
However, if the ECB remains dovish and disappoints, the bullish bets could unwind, and the EUR/USD could suffer. And with German economic confidence declining for four-straight months, a hawkish shift by the ECB would be playing with fire.
To explain, I wrote on Jun. 9 and updated monthly:
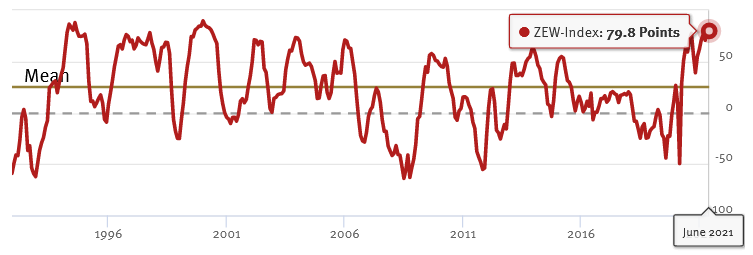
While investors continue to buy hope and sell reality, rather than rising to 86.0 (the consensus estimate), the German ZEW Economic Sentiment Index (released on Jun. 8) fell from 84.4 in May to 79.8 in June. For context, Germany is Europe’s largest economy.
Please see below:
 Source: ZEW
To explain, the red line above tracks the German ZEW Economic Sentiment Index. If you analyze the behavior, you can see that 79.8 is still well above its historical average. More importantly, tough, notice how abnormally high readings are often followed by swift reversions? And with the prior high (84.4) only superseded by 2000, there is an awful lot of optimism already priced into the EUR/USD.
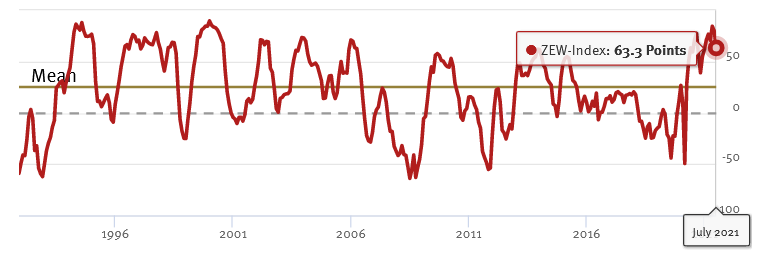
To that point, if we fast forward to Jul. 6, the German ZEW Economic Sentiment Index sunk to 63.3. And following right along, the EUR/USD ended the Jul. 6 session at its lowest level since Mar. 24.
Please see below:
 Source: ZEW
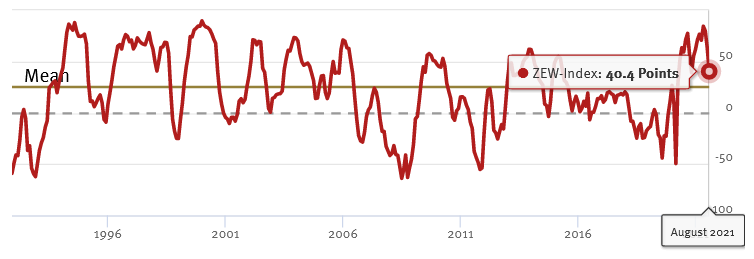
Now, with August’s reading falling off a cliff, the German ZEW Economic Sentiment Index (released on Aug. 10) fell to 40.4 – its lowest level since November 2020.
 Source: ZEW
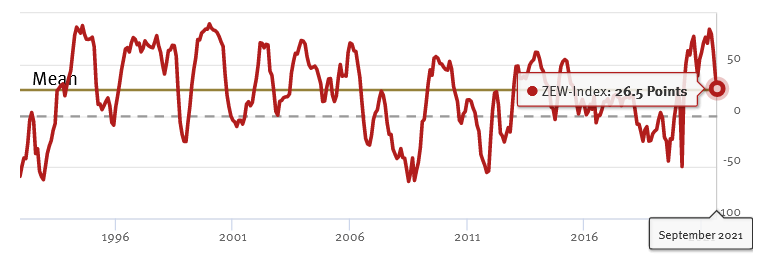
And with another month on the books and another new low, the German ZEW Economic Sentiment Index (released on Sep. 7) fell to 26.5 – its lowest level since coronavirus-induced lockdowns plagued the region in March 2020.
Please see below:
 Source: ZEW
ZEW President Professor Achim Wambach provided the following context:
“Expectations fell markedly once more in September 2021. Although financial market experts expect further improvements of the economic situation over the next six months, the expected magnitude and the dynamics of the improvements have decreased considerably.”
The bottom line? If the ECB decides it’s time to scale back its stimulus, the central bank would be tightening at a time when economic confidence in Europe’s largest economy is at its worst. As a result, the medium-term shock to realized GDP will likely outweigh any short-term benefits that the EUR/USD may accumulate.
In conclusion, gold continued its downtrend on Sep. 8 and the GDXJ ETF (our short position) maintained its relative underperformance. And with the S&P 500 showing signs of slippage and the Fed’s dual mandate poised for completion over the medium term, upside catalysts for the PMs remain few and far between. As a result, the bearish implications remain intact, though a buying opportunity could emerge in December.
Overview of the Upcoming Part of the Decline
- It seems to me that the corrective upswing in gold is over or close to being over, and the big decline seems to be already underway.
- It seems that the first stop for gold will be close to its previous 2021 lows, slightly below $1,700. Then it will likely correct a bit, but it’s unclear if I want to exit or reverse the current short position based on that – it depends on the number and the nature of the bullish indications that we get at that time.
- After the above-mentioned correction, we’re likely to see a powerful slide, perhaps close to the 2020 low ($1,450 - $1,500).
- If we see a situation where miners slide in a meaningful and volatile way while silver doesn’t (it just declines moderately), I plan to switch from short positions in miners to short positions in silver. At this time, it’s too early to say at what price levels this could take place, and if we get this kind of opportunity at all – perhaps with gold close to $1,600.
- I plan to exit all remaining short positions when gold shows substantial strength relative to the USD Index while the latter is still rallying. This might take place with gold close to $1,350 - $1,400. I expect silver to fall the hardest in the final part of the move. This moment (when gold performs very strongly against the rallying USD and miners are strong relative to gold after its substantial decline) is likely to be the best entry point for long-term investments, in my view. This might also happen with gold close to $1,375, but it’s too early to say with certainty at this time. I expect the final bottom to take place near the end of the year, perhaps in mid-December.
- As a confirmation for the above, I will use the (upcoming or perhaps we have already seen it?) top in the general stock market as the starting point for the three-month countdown. The reason is that after the 1929 top, gold miners declined for about three months after the general stock market started to slide. We also saw some confirmations of this theory based on the analogy to 2008. All in all, the precious metals sector is likely to bottom about three months after the general stock market tops.
- The above is based on the information available today, and it might change in the following days/weeks.
You will find my general overview of the outlook for gold on the chart below:
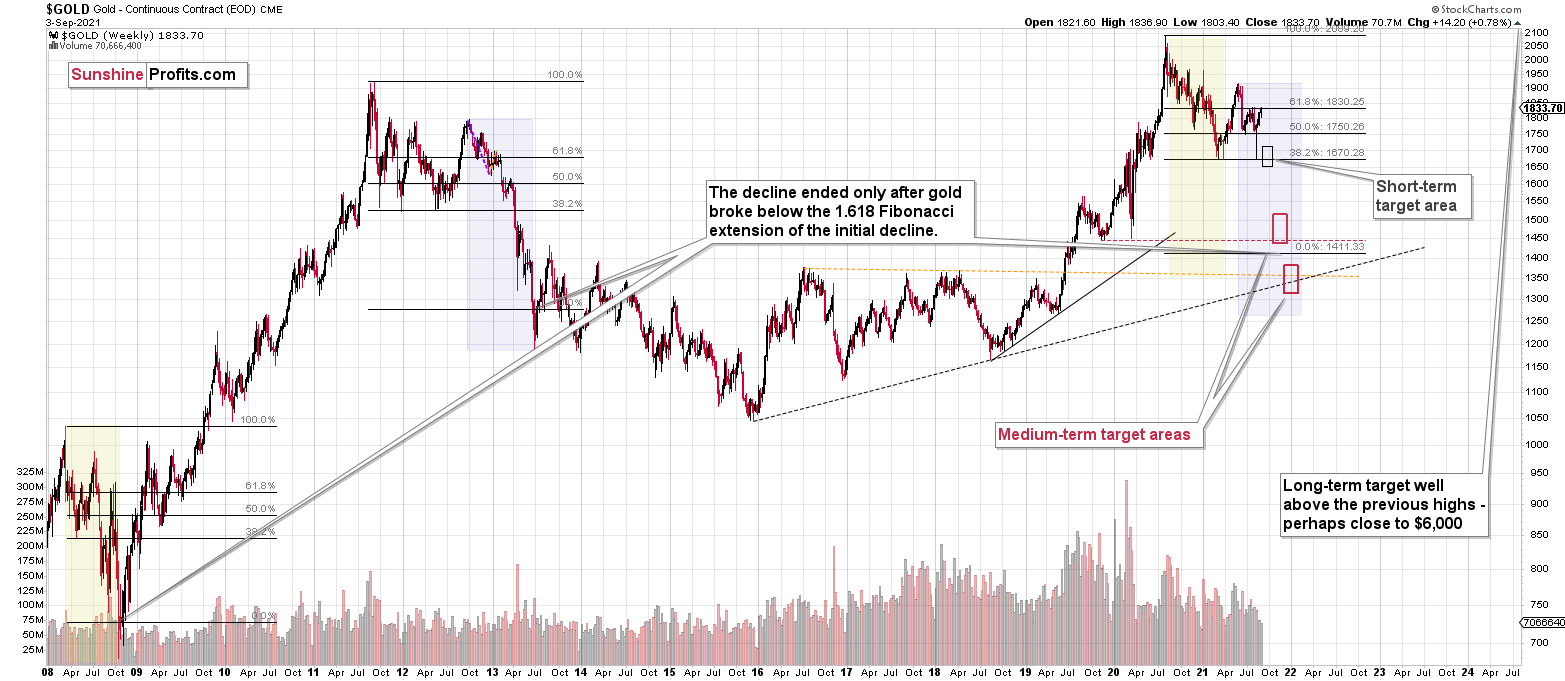
Please note that the above timing details are relatively broad and “for general overview only” – so that you know more or less what I think and how volatile I think the moves are likely to be – on an approximate basis. These time targets are not binding or clear enough for me to think that they should be used for purchasing options, warrants or similar instruments.
Summary
To summarize, even though we saw a sizable upswing on Friday, it doesn’t seem that it changes anything with regard to the bearish medium-term trend on the precious metals market. The key breakdowns / breakdowns were either not invalidated (USD Index) or were invalidated in a way that’s suspicious (silver, GDXJ, GDX) or in tune with what happened during the powerful 2013 slide (GDX, HUI Index).
Even the volume readings from the palladium market confirm the bearish narrative for gold, silver, and mining stocks.
It seems that our profits from the short positions are going to become truly epic in the following weeks.
After the sell-off (that takes gold to about $1,350 - $1,500), I expect the precious metals to rally significantly. The final part of the decline might take as little as 1-5 weeks, so it's important to stay alert to any changes.
Most importantly, please stay healthy and safe. We made a lot of money last March and this March, and it seems that we’re about to make much more on the upcoming decline, but you have to be healthy to enjoy the results.
As always, we'll keep you - our subscribers - informed.
By the way, we’re currently providing you with the possibility to extend your subscription by a year, two years or even three years with a special 20% discount. This discount can be applied right away, without the need to wait for your next renewal – if you choose to secure your premium access and complete the payment upfront. The boring time in the PMs is definitely over, and the time to pay close attention to the market is here. Naturally, it’s your capital, and the choice is up to you, but it seems that it might be a good idea to secure more premium access now while saving 20% at the same time. Our support team will be happy to assist you in the above-described upgrade at preferential terms – if you’d like to proceed, please contact us.
To summarize:
Trading capital (supplementary part of the portfolio; our opinion): Full speculative short positions (300% of the full position) in mining stocks are justified from the risk to reward point of view with the following binding exit profit-take price levels:
Mining stocks (price levels for the GDXJ ETF): binding profit-take exit price: $35.73; stop-loss: none (the volatility is too big to justify a stop-loss order in case of this particular trade)
Alternatively, if one seeks leverage, we’re providing the binding profit-take levels for the JDST (2x leveraged) and GDXD (3x leveraged – which is not suggested for most traders/investors due to the significant leverage). The binding profit-take level for the JDST: $16.96; stop-loss for the JDST: none (the volatility is too big to justify a SL order in case of this particular trade); binding profit-take level for the GDXD: $35.46; stop-loss for the GDXD: none (the volatility is too big to justify a SL order in case of this particular trade).
For-your-information targets (our opinion; we continue to think that mining stocks are the preferred way of taking advantage of the upcoming price move, but if for whatever reason one wants / has to use silver or gold for this trade, we are providing the details anyway.):
Silver futures upside profit-take exit price: unclear at this time - initially, it might be a good idea to exit, when gold moves to $1,683
Gold futures upside profit-take exit price: $1,683
HGD.TO – alternative (Canadian) inverse 2x leveraged gold stocks ETF – the upside profit-take exit price: $11.38
Long-term capital (core part of the portfolio; our opinion): No positions (in other words: cash
Insurance capital (core part of the portfolio; our opinion): Full position
Whether you already subscribed or not, we encourage you to find out how to make the most of our alerts and read our replies to the most common alert-and-gold-trading-related-questions.
Please note that we describe the situation for the day that the alert is posted in the trading section. In other words, if we are writing about a speculative position, it means that it is up-to-date on the day it was posted. We are also featuring the initial target prices to decide whether keeping a position on a given day is in tune with your approach (some moves are too small for medium-term traders, and some might appear too big for day-traders).
Additionally, you might want to read why our stop-loss orders are usually relatively far from the current price.
Please note that a full position doesn't mean using all of the capital for a given trade. You will find details on our thoughts on gold portfolio structuring in the Key Insights section on our website.
As a reminder - "initial target price" means exactly that - an "initial" one. It's not a price level at which we suggest closing positions. If this becomes the case (like it did in the previous trade), we will refer to these levels as levels of exit orders (exactly as we've done previously). Stop-loss levels, however, are naturally not "initial", but something that, in our opinion, might be entered as an order.
Since it is impossible to synchronize target prices and stop-loss levels for all the ETFs and ETNs with the main markets that we provide these levels for (gold, silver and mining stocks - the GDX ETF), the stop-loss levels and target prices for other ETNs and ETF (among other: UGL, GLL, AGQ, ZSL, NUGT, DUST, JNUG, JDST) are provided as supplementary, and not as "final". This means that if a stop-loss or a target level is reached for any of the "additional instruments" (GLL for instance), but not for the "main instrument" (gold in this case), we will view positions in both gold and GLL as still open and the stop-loss for GLL would have to be moved lower. On the other hand, if gold moves to a stop-loss level but GLL doesn't, then we will view both positions (in gold and GLL) as closed. In other words, since it's not possible to be 100% certain that each related instrument moves to a given level when the underlying instrument does, we can't provide levels that would be binding. The levels that we do provide are our best estimate of the levels that will correspond to the levels in the underlying assets, but it will be the underlying assets that one will need to focus on regarding the signs pointing to closing a given position or keeping it open. We might adjust the levels in the "additional instruments" without adjusting the levels in the "main instruments", which will simply mean that we have improved our estimation of these levels, not that we changed our outlook on the markets. We are already working on a tool that would update these levels daily for the most popular ETFs, ETNs and individual mining stocks.
Our preferred ways to invest in and to trade gold along with the reasoning can be found in the how to buy gold section. Furthermore, our preferred ETFs and ETNs can be found in our Gold & Silver ETF Ranking.
As a reminder, Gold & Silver Trading Alerts are posted before or on each trading day (we usually post them before the opening bell, but we don't promise doing that each day). If there's anything urgent, we will send you an additional small alert before posting the main one.
Thank you.
Przemyslaw Radomski, CFA
Founder, Editor-in-chief

