

Briefly: in our opinion, full (300% of the regular position size) speculative short positions in mining stocks are justified from the risk/reward point of view at the moment of publishing this Alert.
I decided to take the video experiment one step further today, and I recorded today’s entire technical analysis as a video.
This is (at least for now) just a single-time experiment, not a permanent change in the way I’m delivering my analyses. I just wanted to see what you would think about this way of “consuming content”.
To extend the experiment even further, I’m adding more of a “personal touch” to the video at its end. I particularly enjoy sharing solutions and knowledge (a.k.a. tips and tricks) that I’ve found somewhere so that people can improve their lives in one way or another. I’m doing this through my analyses, of course, but since I enjoy doing that also in other areas of life, I thought that maybe some of you would find that useful and/or interesting if I share some of those bits of information with you as well. Consequently, I’m adding a non-market commentary about a useful trick that I’m using to increase my focus and limit distractions (precisely, one of them). It’s very simple, very quick, and surprisingly effective, and it’s based on what I read in “Distracted Mind: Ancient Brains in a High-tech World” by Adam Gazzaley and Larry D Rosen, which I highly recommend.
You will find today’s technical analysis here:
Having said that, let’s take a look at the markets from a more fundamental point of view:
Two Sides of the Same Coin
With the Delta variant decelerating U.S. economic momentum, the chorus proclaiming ‘peak growth’ is growing louder by the day. And as the colder months approach and outdoor activities fail to stimulate consumer spending, economists have sounded the alarm on the U.S. economic Renaissance.
Case in point: Goldman Sachs has reduced its third-quarter GDP growth estimate three times, and the investment bank expects Q4 and full-year 2022 to come in weaker than expected.
Please see below:
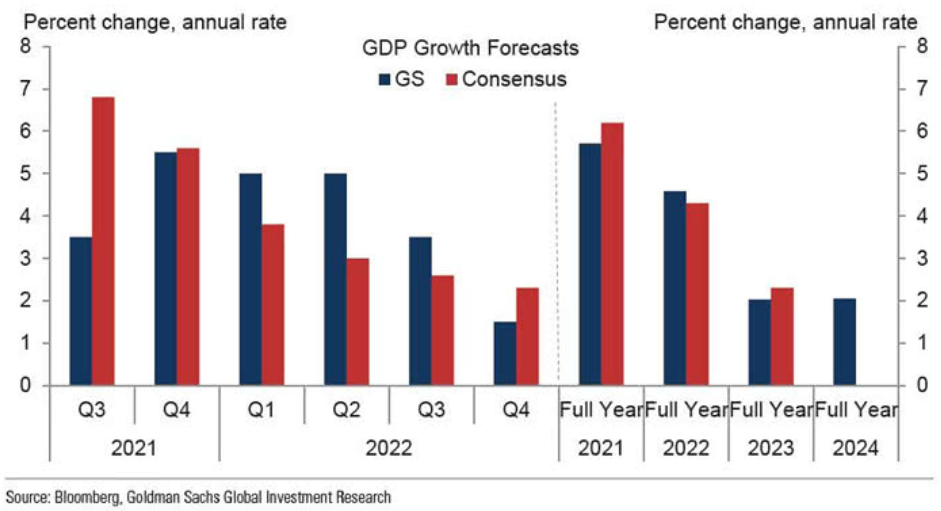
To explain, the blue bars above track Goldman Sachs’ GDP growth estimates, while the red bars above track economists’ consensus estimates. If you analyze the columns labeled “Q4” and “Full Year 2022,” you can see that Goldman Sachs expects a sharper-than-expected slowdown in the autumn months, and the weakness should persist into 2022.
Alongside, economists’ consensus estimates for the third and fourth quarters have also come down.
Please see below:
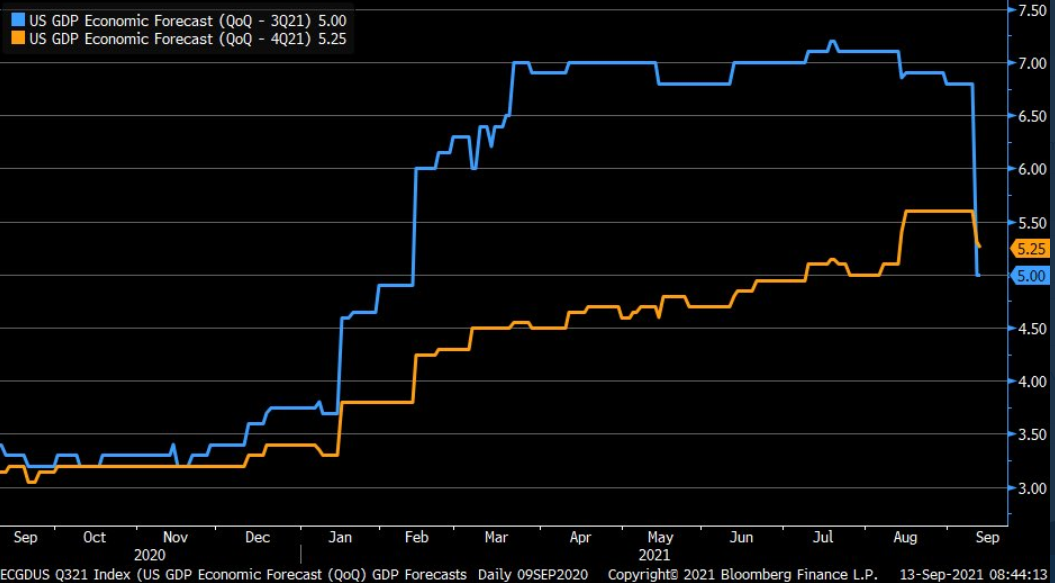 Source: Bloomberg/Liz Ann Sonders
To explain, the blue and orange lines above track economists’ consensus GDP growth estimates for the third and fourth quarters. If you analyze the right side of the chart, you can see that the blue line has fallen sharply and that the orange line is slowly following suit.
And upping the bearish ante, the Atlanta Fed’s GDPNow estimate for the third quarter has sunk well below Goldman Sachs and Bloomberg’s consensus estimates, with the metric nearly halving in the last month alone.
Please see below:
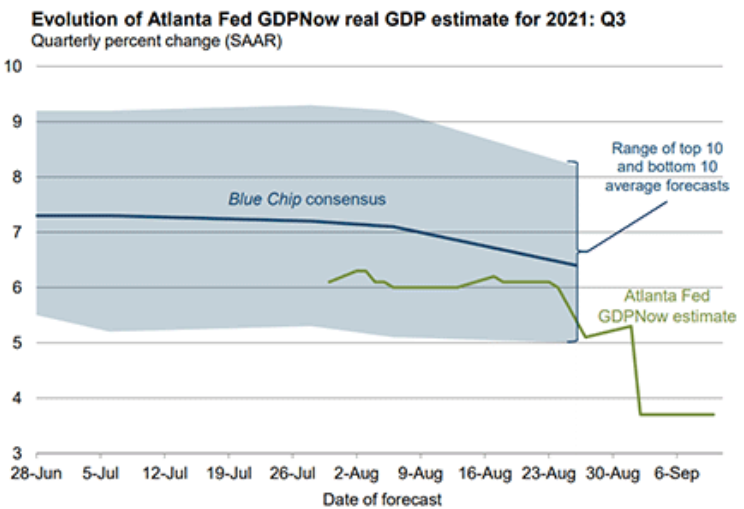
To explain, the blue line above tracks the Blue Chip consensus GDP growth estimate for the third quarter, and the shaded blue area represents the range of economists’ estimates. If you analyze the depth, you can see that economists expect a print in the ~5% to ~8% range. In stark contrast, the green line above tracks the Atlanta Fed’s GDPNow estimate – which implies 3.7% GDP growth in the third quarter.
More importantly, though, if growth falls off a cliff and the U.S. recovery is derailed, the doom and gloom could actually uplift the gold prices.
Well, while a major slowdown in U.S. growth could reduce U.S. Treasury yields and increase gold’s attractiveness as a bond proxy, the U.S. dollar’s uprising will likely outweigh any bullish potential. For example, when GDP growth decelerates and investors flock to safe-haven assets, the U.S. dollar is a primary beneficiary. And with gold, silver and mining stocks exhibiting strong negative correlations with the U.S. dollar, the PMs often suffer in the process.
Please see below:
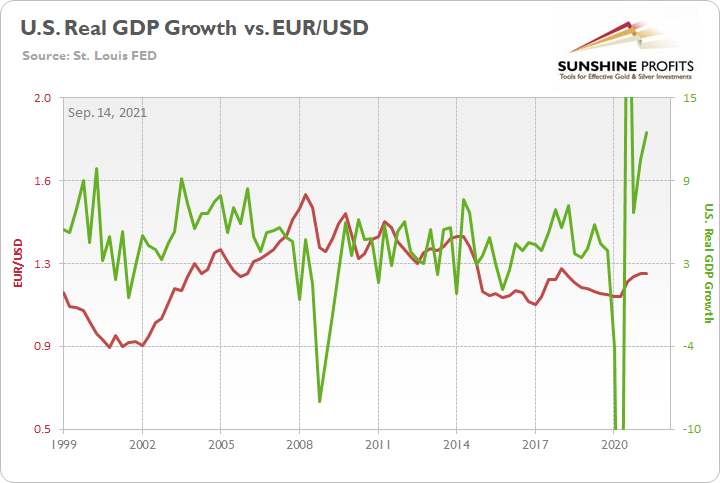
To explain, the green line above tracks the annualized percentage change in U.S. real GDP, while the red line above tracks the EUR/USD. For context, the EUR/USD accounts for nearly 58% of the movement of the USD Index. If you analyze the relationship, you can see that troughs in U.S. GDP growth often coincide with troughs in the EUR/USD. For example, when the U.S. entered recession in 2001, 2008 and 2020, the EUR/USD declined precipitously and helped fuel the USD Index’s uprising. Thus, with the PMs often moving inversely of the U.S. dollar, they’re unlikely to celebrate a decline in U.S. GDP growth.
Delta Variant Fades, Inflation… Not So Much
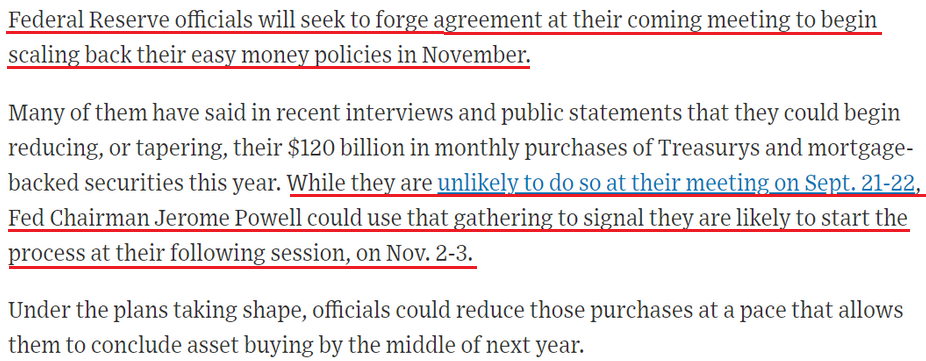
Furthermore, while the U.S. economy will likely regain its momentum once the Delta variant dissipates, the weakness in U.S. GDP growth could prove transient. In stark contrast, however, inflationary pressures remain robust, and the surge could elicit hawkish rhetoric from the Fed during its September 21/22 monetary policy meeting. To explain, the Wall Street Journal (WSJ) published a rather cryptic article on Sep. 10 titled: “Fed Officials Prepare for November Reduction in Bond Buying.” And with Chairman Jerome Powell promising “advance notice” before a formal announcement commences, the September meeting could be used to brace investors for what’s to come.
Please see below:
 Source: WSJ
Furthermore, since the WSJ is considered the unofficial mouthpiece of the Fed, Goldman Sachs chief economist Jan Hatzius told clients on Sep. 11 that the article has moved the taper needle. He wrote:
“Earlier today, the Wall Street Journal published an article titled “Fed Officials Prepare for November Reduction in Bond Buying.” The article went on to state that officials “will seek to forge agreement” on November as the beginning of “scaling back” accommodation, and it subsequently cited several public remarks about tapering from Chairman Powell and other members of the leadership. Reflecting this, we are increasing our subjective odds of a November taper announcement. We now see 70% odds of a November announcement (vs. 45% previously) and 10% odds of a December announcement (vs. 35% previously); we continue to see a 20% chance that growth risks related to the Delta variant delay the tapering announcement into 2022.”
Thus, if a formal announcement is scheduled for November, hawkish hints will likely emerge at the Fed’s upcoming meeting.
In the meantime, though, surging inflation should be keeping Powell up at night. For example, Apollo Global Management CEO Marc Rowan – whose firm has $472 billion in assets under management as of June 30 – said on Sep. 13 that inflation is “everywhere.”
“There’s not a place [where we are not seeing it]. Everything that we once did now costs more,” he told CNBC’s Leslie Picker as part of “Delivering Alpha.” “Lead times, pressure on inventory, pressure on supplies, pressure on employment. Our experience in our portfolio is really no different than the broader economy.”
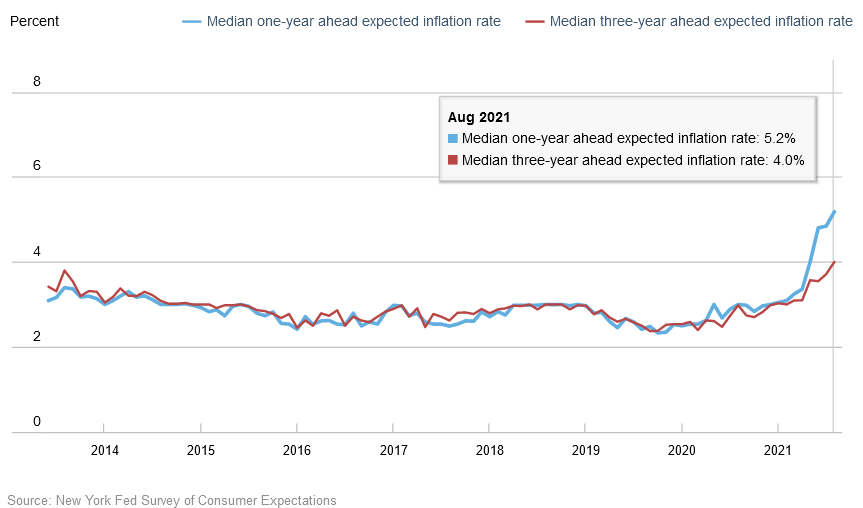
What’s more, the New York Fed also released its August Survey of Consumer Expectations on Sep. 13. And surprise, surprise, the report revealed:
“Median one-year-ahead inflation expectations increased by 0.3 percentage point to 5.2% in August, the tenth consecutive monthly increase and a new series high. Median inflation expectations at the three-year horizon also increased by 0.3 percentage point to a new series high of 4.0%.”
Please see below:
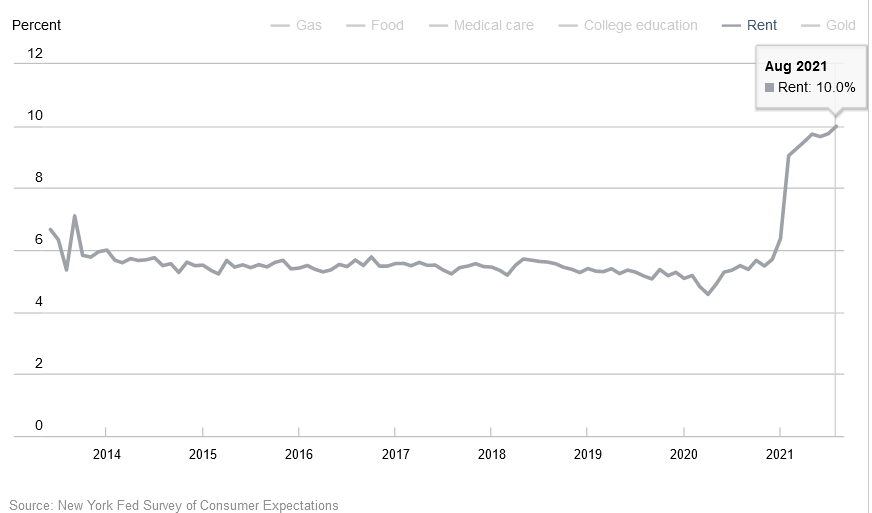
In addition, while I’ve warned on several occasions that the Shelter Consumer Price Index (CPI) could accelerate the inflationary momentum during the autumn months, U.S. consumers are already bracing for a surge in rent inflation.
Please see below:
Base Effects Are Long Gone
Finally, with the U.S. headline CPI likely to sizzle today and weak comparable periods no longer relevant, notice how deflationists no longer cite “base effects” anymore?
To explain, I wrote on Jun. 15 and updated on Aug. 17:
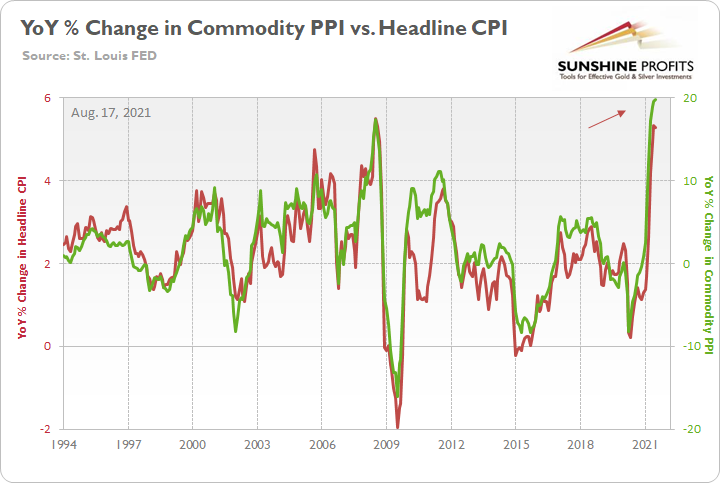
The commodity Producer Price Index (PPI) often leads the headline CPI and that’s why tracking its movement is so important. If we analyze the performance of the pair during the inflationary surges of the 1970s and the early 1980s, it’s clear that the relationship has stood the test of time.
Please see below:
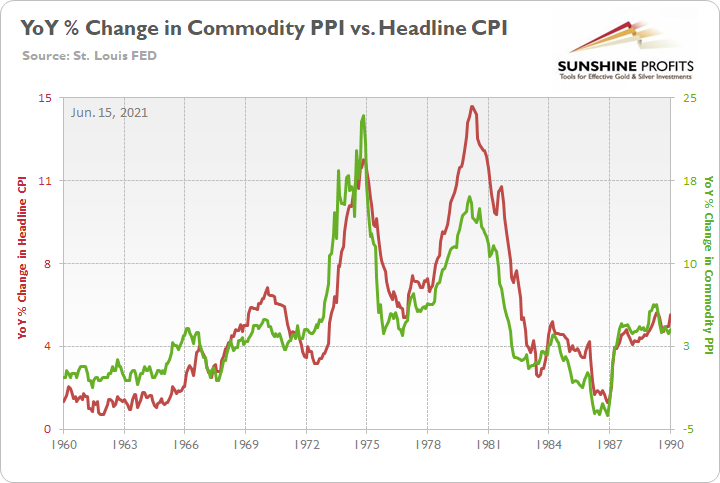
To explain, the green line above tracks the year-over-year (YoY) percentage change in the commodity PPI, while the red line above tracks the YoY percentage change in the headline CPI. If you analyze the relationship, you can see that the pair have a close connection.
More importantly, though, during the historical inflationary downpour, the month-over-month (MoM) percentage change in the commodity PPI never declined by more than 1.68%.
Please see below:
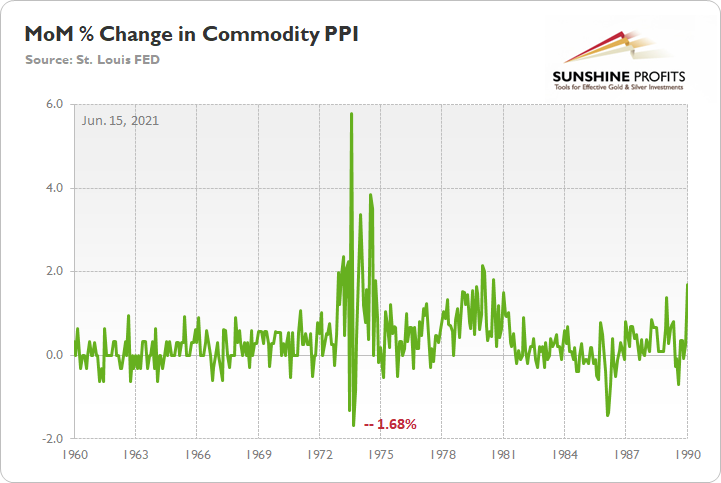
To explain, the green line above tracks the MoM percentage change in the commodity PPI. And if you compare the two MoM spikes in the commodity PPI to the two YoY spikes in the first chart above (focus your attention on the highs between 1972-1975 and 1978-1981), you can see that MoM resiliency helped sustain the YoY surges. In addition, during the roughly nine-year bout of inflation, the commodity PPI dipped in-and-out of negative territory but never fell off a cliff.
Back to the present, with the commodity PPI rising by 1.2% MoM and 19.8% YoY (highest since 1974) on Aug. 12, the inflationary pressures remain abundant. Moreover, with the commodity PPI rising MoM in March, April, May, June and July 2021, the YoY percentage increase in July was actually higher than it was during the lockdown periods (“base effects”) of March, April and May 2020. Thus, input inflation is still accelerating even though “base effects” are no longer relevant. And with the merry-go-round still turning, the commodity PPI implies a headline CPI print of roughly 5.25% to 5.75% when the data is released on Sep. 14.
Please see below:
The bottom line? With another 5%+ headline CPI print likely to hit the wire today, inflation is more than 2.5x the Fed’s annual target. And with “base effects” long gone and several Fed officials lobbying for an immediate taper, pressure on Powell should accelerate in the coming weeks.
In conclusion, while gold and the gold miners rallied on Sep. 13, their medium-term outlooks remain extremely treacherous. And with the Fed’s taper timeline shortening by the day, a hawkish surprise on Sep. 21/22 could lead to another sell-off. Moreover, with the USD Index holding firm and decelerating economic growth poised to add to the greenback’s momentum during the autumn months, the PMs’ performance will likely cool alongside the fall temperature.
Overview of the Upcoming Part of the Decline
- It seems to me that the corrective upswing in gold is over or close to being over, and the big decline seems to be already underway.
- It seems that the first stop for gold will be close to its previous 2021 lows, slightly below $1,700. Then it will likely correct a bit, but it’s unclear if I want to exit or reverse the current short position based on that – it depends on the number and the nature of the bullish indications that we get at that time.
- After the above-mentioned correction, we’re likely to see a powerful slide, perhaps close to the 2020 low ($1,450 - $1,500).
- If we see a situation where miners slide in a meaningful and volatile way while silver doesn’t (it just declines moderately), I plan to switch from short positions in miners to short positions in silver. At this time, it’s too early to say at what price levels this could take place, and if we get this kind of opportunity at all – perhaps with gold close to $1,600.
- I plan to exit all remaining short positions when gold shows substantial strength relative to the USD Index while the latter is still rallying. This might take place with gold close to $1,350 - $1,400. I expect silver to fall the hardest in the final part of the move. This moment (when gold performs very strongly against the rallying USD and miners are strong relative to gold after its substantial decline) is likely to be the best entry point for long-term investments, in my view. This might also happen with gold close to $1,375, but it’s too early to say with certainty at this time. I expect the final bottom to take place near the end of the year, perhaps in mid-December.
- As a confirmation for the above, I will use the (upcoming or perhaps we have already seen it?) top in the general stock market as the starting point for the three-month countdown. The reason is that after the 1929 top, gold miners declined for about three months after the general stock market started to slide. We also saw some confirmations of this theory based on the analogy to 2008. All in all, the precious metals sector is likely to bottom about three months after the general stock market tops.
- The above is based on the information available today, and it might change in the following days/weeks.
You will find my general overview of the outlook for gold on the chart below:
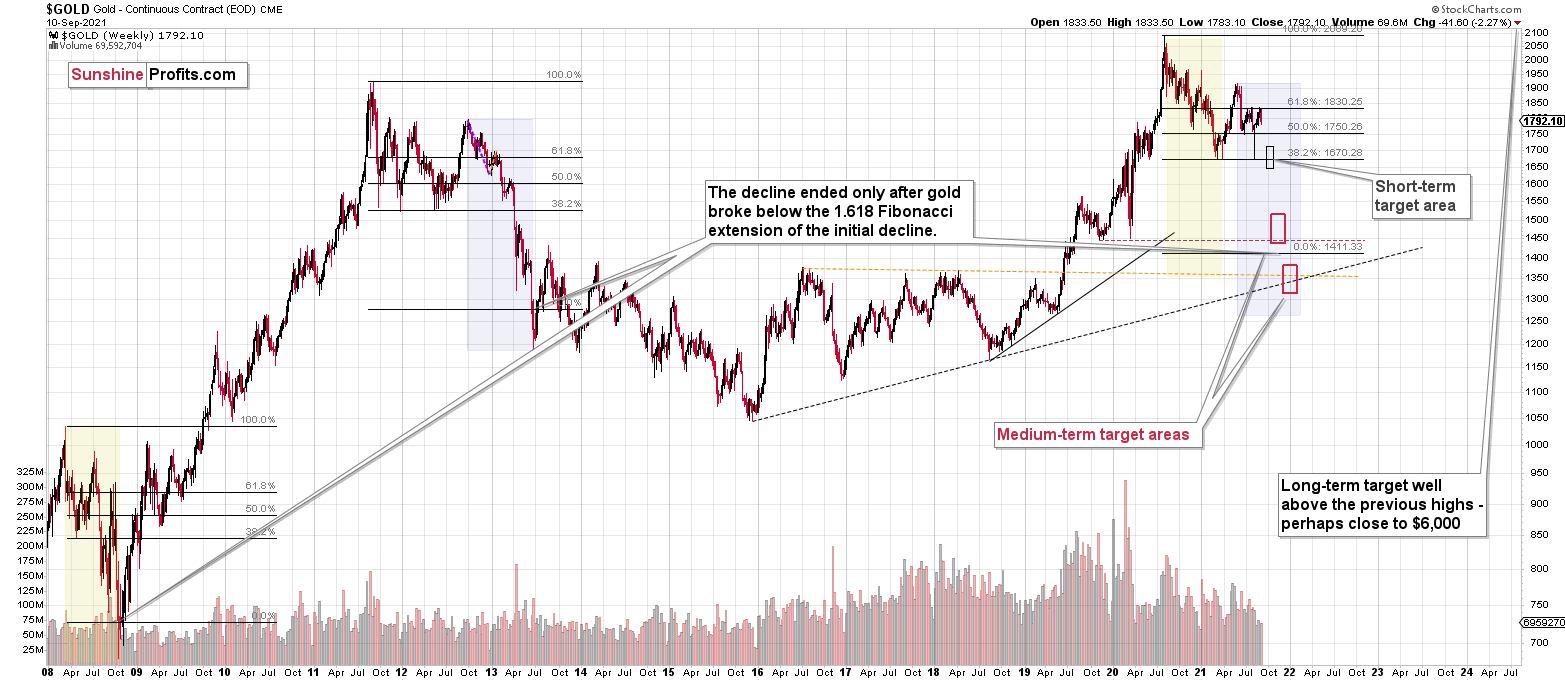
Please note that the above timing details are relatively broad and “for general overview only” – so that you know more or less what I think and how volatile I think the moves are likely to be – on an approximate basis. These time targets are not binding or clear enough for me to think that they should be used for purchasing options, warrants or similar instruments.
Summary
To summarize, the previous strength in the precious metals sector was reversed, just like it was likely to, and the most bearish thing about it is that it happened practically without a good fundamental trigger. This means that the precious metals sector simply can’t wait to decline to much lower levels.
It seems that our profits from the short positions are going to become truly epic in the following weeks.
After the sell-off (that takes gold to about $1,350 - $1,500), I expect the precious metals to rally significantly. The final part of the decline might take as little as 1-5 weeks, so it's important to stay alert to any changes.
Most importantly, please stay healthy and safe. We made a lot of money last March and this March, and it seems that we’re about to make much more on the upcoming decline, but you have to be healthy to enjoy the results.
As always, we'll keep you - our subscribers - informed.
By the way, we’re currently providing you with the possibility to extend your subscription by a year, two years or even three years with a special 20% discount. This discount can be applied right away, without the need to wait for your next renewal – if you choose to secure your premium access and complete the payment upfront. The boring time in the PMs is definitely over, and the time to pay close attention to the market is here. Naturally, it’s your capital, and the choice is up to you, but it seems that it might be a good idea to secure more premium access now while saving 20% at the same time. Our support team will be happy to assist you in the above-described upgrade at preferential terms – if you’d like to proceed, please contact us.
To summarize:
Trading capital (supplementary part of the portfolio; our opinion): Full speculative short positions (300% of the full position) in mining stocks are justified from the risk to reward point of view with the following binding exit profit-take price levels:
Mining stocks (price levels for the GDXJ ETF): binding profit-take exit price: $35.73; stop-loss: none (the volatility is too big to justify a stop-loss order in case of this particular trade)
Alternatively, if one seeks leverage, we’re providing the binding profit-take levels for the JDST (2x leveraged) and GDXD (3x leveraged – which is not suggested for most traders/investors due to the significant leverage). The binding profit-take level for the JDST: $16.96; stop-loss for the JDST: none (the volatility is too big to justify a SL order in case of this particular trade); binding profit-take level for the GDXD: $35.46; stop-loss for the GDXD: none (the volatility is too big to justify a SL order in case of this particular trade).
For-your-information targets (our opinion; we continue to think that mining stocks are the preferred way of taking advantage of the upcoming price move, but if for whatever reason one wants / has to use silver or gold for this trade, we are providing the details anyway.):
Silver futures upside profit-take exit price: unclear at this time - initially, it might be a good idea to exit, when gold moves to $1,683
Gold futures upside profit-take exit price: $1,683
HGD.TO – alternative (Canadian) inverse 2x leveraged gold stocks ETF – the upside profit-take exit price: $11.38
Long-term capital (core part of the portfolio; our opinion): No positions (in other words: cash
Insurance capital (core part of the portfolio; our opinion): Full position
Whether you already subscribed or not, we encourage you to find out how to make the most of our alerts and read our replies to the most common alert-and-gold-trading-related-questions.
Please note that we describe the situation for the day that the alert is posted in the trading section. In other words, if we are writing about a speculative position, it means that it is up-to-date on the day it was posted. We are also featuring the initial target prices to decide whether keeping a position on a given day is in tune with your approach (some moves are too small for medium-term traders, and some might appear too big for day-traders).
Additionally, you might want to read why our stop-loss orders are usually relatively far from the current price.
Please note that a full position doesn't mean using all of the capital for a given trade. You will find details on our thoughts on gold portfolio structuring in the Key Insights section on our website.
As a reminder - "initial target price" means exactly that - an "initial" one. It's not a price level at which we suggest closing positions. If this becomes the case (like it did in the previous trade), we will refer to these levels as levels of exit orders (exactly as we've done previously). Stop-loss levels, however, are naturally not "initial", but something that, in our opinion, might be entered as an order.
Since it is impossible to synchronize target prices and stop-loss levels for all the ETFs and ETNs with the main markets that we provide these levels for (gold, silver and mining stocks - the GDX ETF), the stop-loss levels and target prices for other ETNs and ETF (among other: UGL, GLL, AGQ, ZSL, NUGT, DUST, JNUG, JDST) are provided as supplementary, and not as "final". This means that if a stop-loss or a target level is reached for any of the "additional instruments" (GLL for instance), but not for the "main instrument" (gold in this case), we will view positions in both gold and GLL as still open and the stop-loss for GLL would have to be moved lower. On the other hand, if gold moves to a stop-loss level but GLL doesn't, then we will view both positions (in gold and GLL) as closed. In other words, since it's not possible to be 100% certain that each related instrument moves to a given level when the underlying instrument does, we can't provide levels that would be binding. The levels that we do provide are our best estimate of the levels that will correspond to the levels in the underlying assets, but it will be the underlying assets that one will need to focus on regarding the signs pointing to closing a given position or keeping it open. We might adjust the levels in the "additional instruments" without adjusting the levels in the "main instruments", which will simply mean that we have improved our estimation of these levels, not that we changed our outlook on the markets. We are already working on a tool that would update these levels daily for the most popular ETFs, ETNs and individual mining stocks.
Our preferred ways to invest in and to trade gold along with the reasoning can be found in the how to buy gold section. Furthermore, our preferred ETFs and ETNs can be found in our Gold & Silver ETF Ranking.
As a reminder, Gold & Silver Trading Alerts are posted before or on each trading day (we usually post them before the opening bell, but we don't promise doing that each day). If there's anything urgent, we will send you an additional small alert before posting the main one.
Thank you.
Przemyslaw Radomski, CFA
Founder, Editor-in-chief

