

Briefly: In our opinion, full (200% of the regular size of the position) speculative short positions in gold, silver and mining stocks are justified from the risk/reward perspective at the moment of publishing this alert.
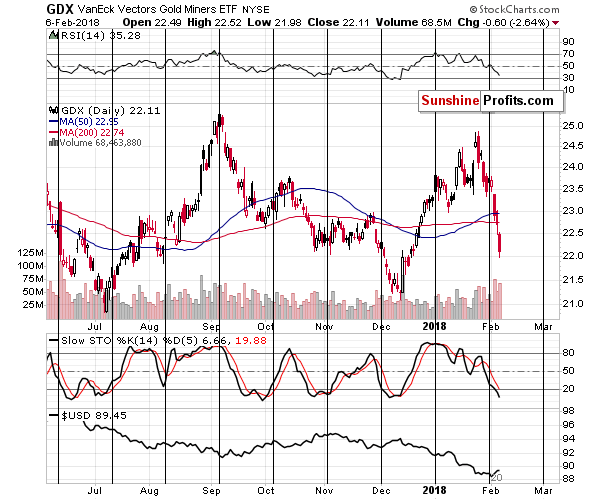
The price of no asset can move up or down in a straight line, so why should mining stocks be any different? They have been declining relentlessly for almost 2 weeks, erasing more than 10% of their value. Sharp? Definitely. Unsustainable? Perhaps. When will the turnaround take place? It depends.
It depends on the bullish signs and confirmations that we get. The correct question to be asking now is: “Why do we need any confirmations at all?” The reply is that because the situation is tense as there are good reasons for both a turnaround in a day or two and a continuation of the decline without a meaningful correction.
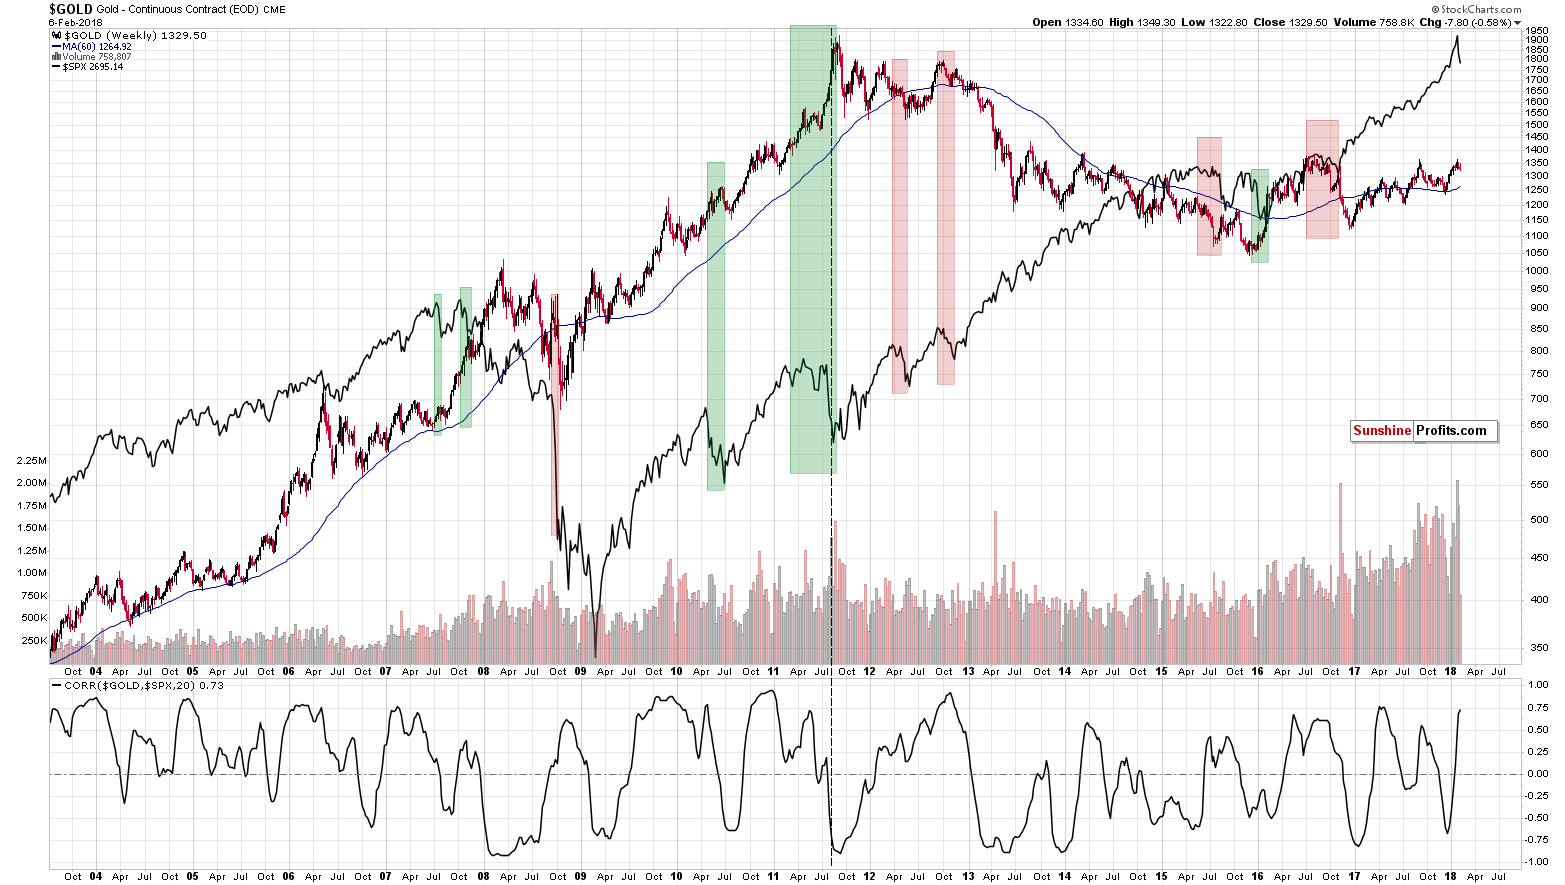
Before moving to the above details, we would like to give you an update on the gold-stock link. Let’s start with gold’s price compared to the S&P 500 Index (chart courtesy of http://stockcharts.com).
In yesterday’s alert, we wrote the following:
As we explained previously, there’s one thing that – right from the start – differentiates between the two kinds of reaction: stocks declining along with gold and stocks triggering a rally in gold. Autocorrelation. Autocorrelation is a fancy way of saying that what happens first makes the same reaction likely, which makes the follow-up to the follow-up likely to be the same as well – and so on. In other words, the way gold initially reacted to the decline in the S&P 500 was the way in which it kept on reacting in the following weeks and – sometimes – months.
What kind of price action did we see in the previous several days (not only yesterday)? On average, the S&P declined along with gold. So, what’s the likely impact that a declining stock market is going to have on the precious metals market? It’s likely going to be negative in the following weeks and – perhaps – months.
At this point you may correctly ask: “If that’s the case, then why didn’t gold decline yesterday?” There are several reasons as to why this was not the case.
The simplest one is that the relationship described in the previous paragraph is supposed to work on average, but it doesn’t mean that gold and the S&P will move in the same direction on every single day. The metals didn’t react by soaring higher – they moved up rather insignificantly. Plus, miners were lower anyway.
The second thing is that yesterday’s session was particularly volatile – something that investors were not prepared for emotionally. Some of them had probably bought gold and silver in hope of hedging themselves. After the session it turned out that it was not that helpful (the S&P was down 4%, while gold was almost flat, moving higher by less than 0.5%), so the following days of the general stock market’s decline may be characterized be much smaller willingness of the investors to purchase precious metals in hope of hedging their stock portfolios.
Yesterday’s session served as a confirmation of the “on average” type of link. On Monday stocks declined severely, while gold moved a bit higher. During yesterday’s session stocks moved a bit higher, but gold declined almost $20. On average, both assets declined. The link as well as the bearish implications remain intact.
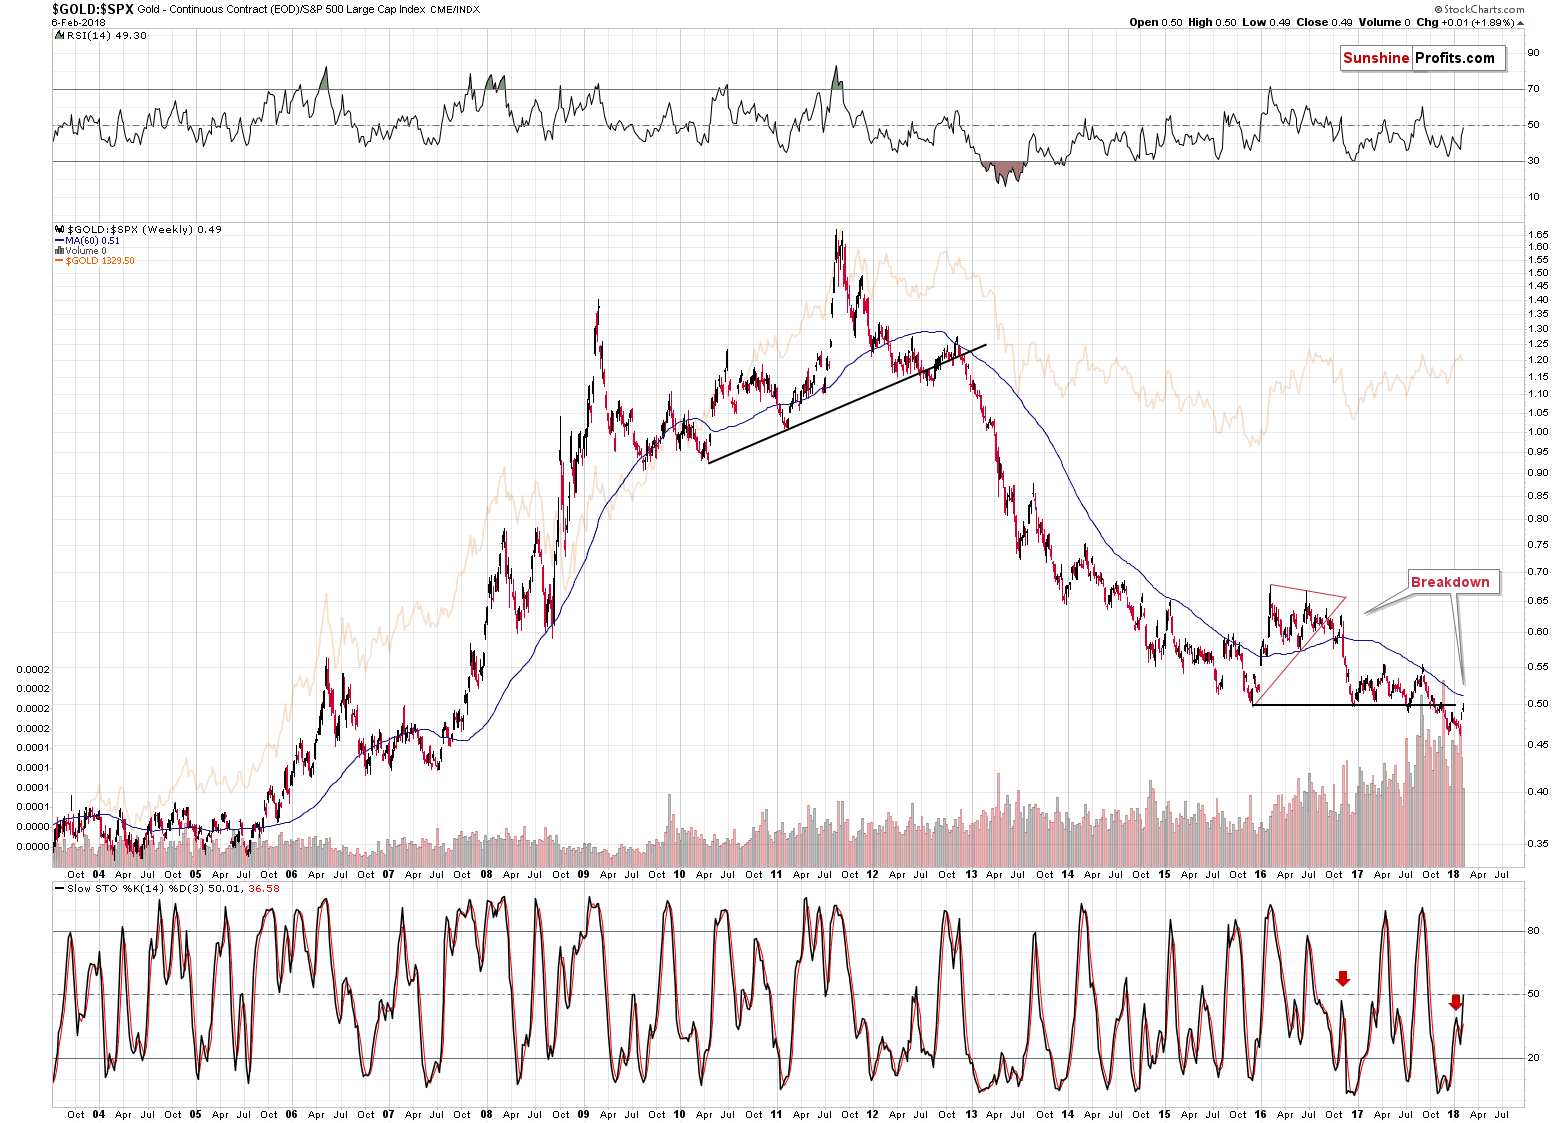
In yesterday’s alert, we also wrote the following on the gold to S&P 500 ratio:
Their ratio moved higher and closed slightly above (almost at) the previous lows. Does the invalidation of the breakout have bullish implications? Most likely not for gold, but as far as the ratio itself is concerned, then it’s not clear as the invalidation itself is not clear. The ratio is based on the closing prices and we’re not 100% certain if Stockcharts’ data for gold can be trusted. It’s almost certainly close to being correct, but if a small difference in the price of gold can imply either a move to the previously broken line or an invalidation of a breakdown, thus making the outlook either bearish or bullish, then it seems that we should wait at least another day to make the distinction.
We wrote that it’s not necessarily bullish for gold as another move higher in the ratio, perhaps to the previous 2017 highs, in the current market environment could mean another big slide in stocks and no significant movement in gold.
Yesterday’s session clarified that there was no invalidation of the previous breakdown after all, only a move back to the previously broken support / resistance line. The 2016 and 2017 lows seem to provide strong resistance, just as they provided strong support in the previous years. The implications are bearish for the ratio and for the precious metals sector.
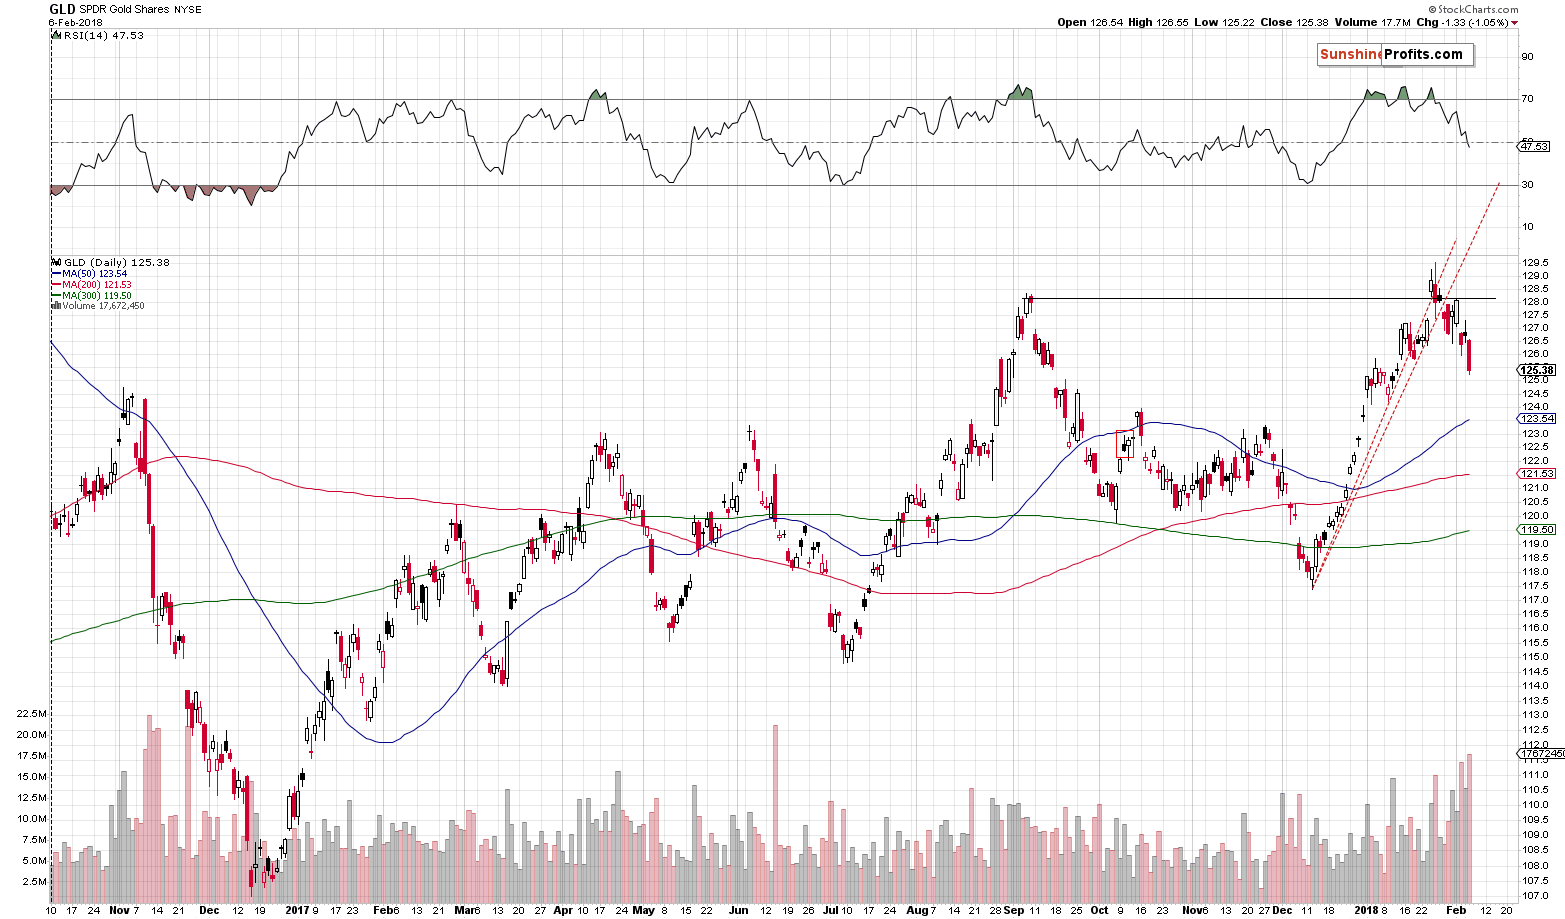
As far as gold itself is concerned, we saw that the decline continued and that it did so on very strong volume. The above is visible particularly clearly in the case of the GLD ETF, which is why we’re using it as gold’s proxy today.
There are only two comparable cases in the recent past. The more recent one is the June decline, which was accompanied by a single, but huge spike in the level of volume. The less recent one, but more similar to what we’re seeing today, is the early part of the November 2016 decline. Back then, the GLD’s decline on big volume was not a single-day phenomenon, saw a few days of very high-volume levels and we’ve been seeing something very similar in the past few days.
No matter which of the previous situations one thinks is more like the current one, the implications are bearish anyway.
Let’s move to gold’s sister metal.
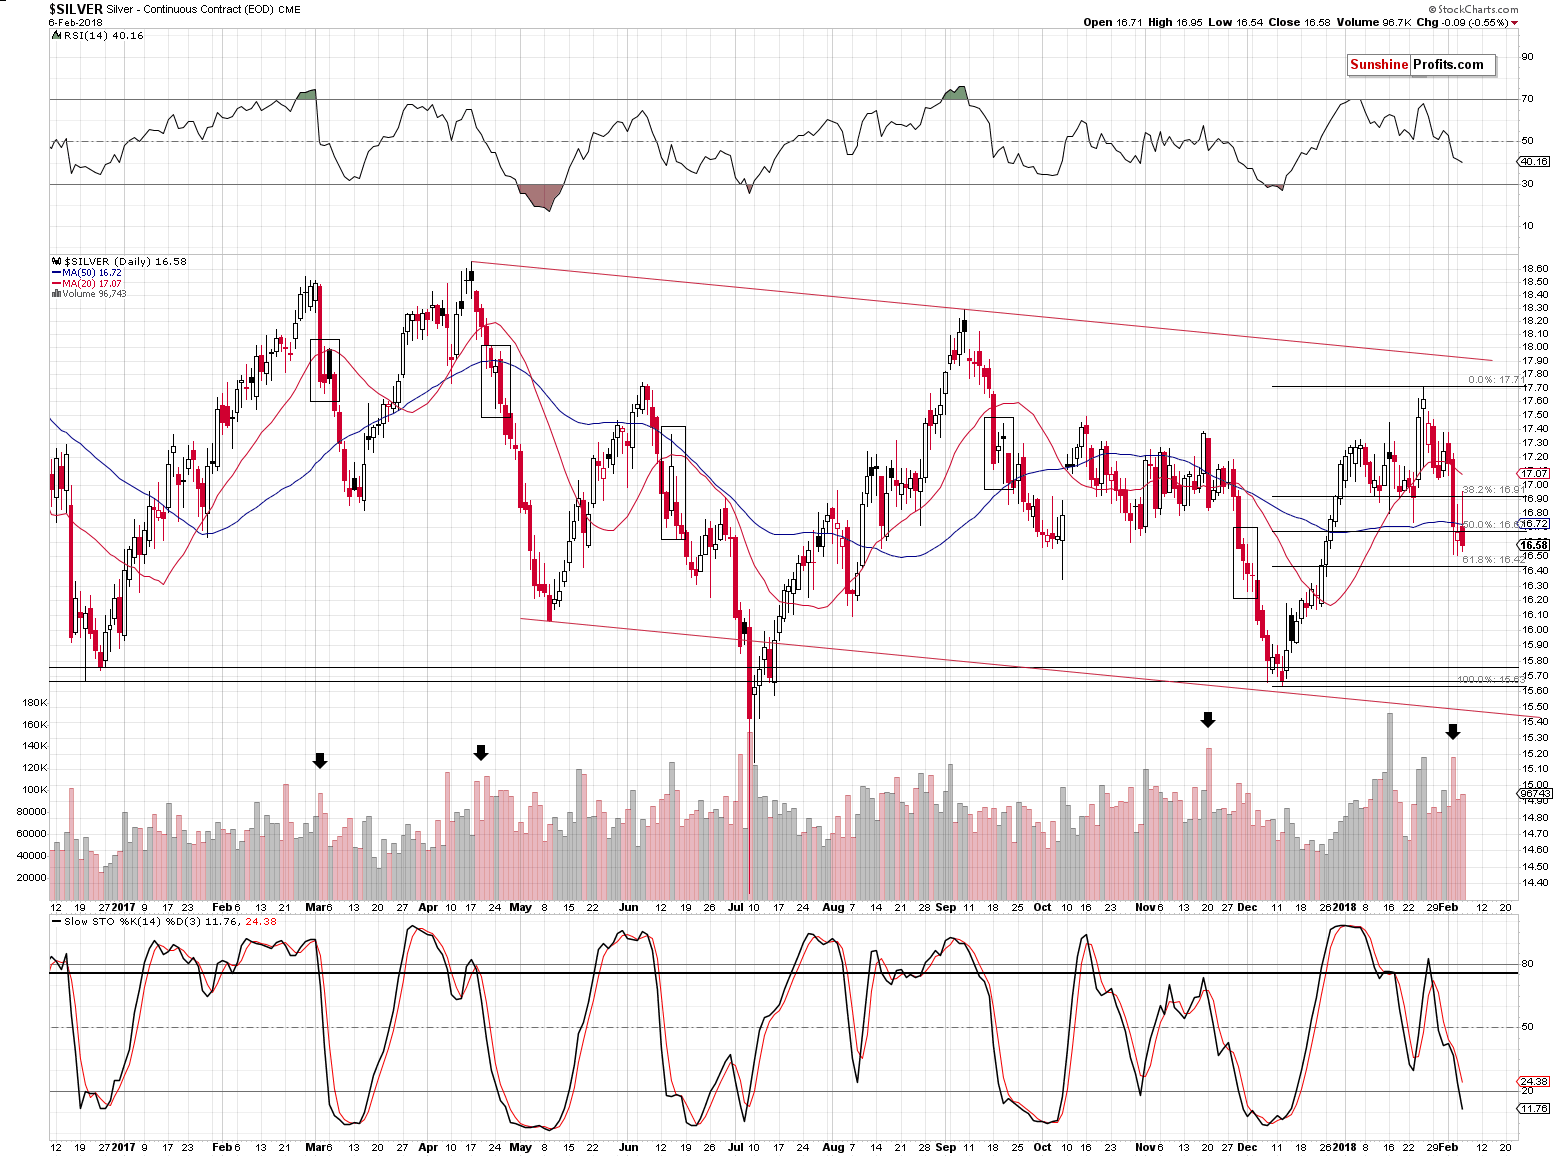
In yesterday’s alert, we wrote the following on the above silver chart:
(…) we see a corrective upswing that follows a sharp slide and a breakdown below the previous lows. A corrective upswing is something very natural at this stage of the decline and should not be viewed as a reversal.
We marked similar situations with black rectangles. Virtually all big declines had this kind of pause before the slide continued, so seeing one now is definitely nothing odd or bullish. Interestingly, in two cases (April 2017 and June 2017) silver corrected from below the 50-day moving average to slightly above it only to plunge in the following days. So far, the price action is similar.
Please note that the pauses didn’t take more than a couple of days, so it seems that this pause is over or about to be over.
Over the course of yesterday’s session, we saw the above confirmed. Silver ended the session well below the recent intraday highs and very close to the recent intraday lows. At the moment of writing these words, the white metal is trading at $16.63, which makes the above comments up-to-date.
Silver is likely taking a breather and preparing itself for another move lower.
Having said the above, let’s move to the questions that we raised in the opening paragraph of today’s analysis. We wrote that the situation is tense as there are good reasons for miners to reverse sooner rather than later and that there are reasons for the decline to continue. Let’s see them in detail.
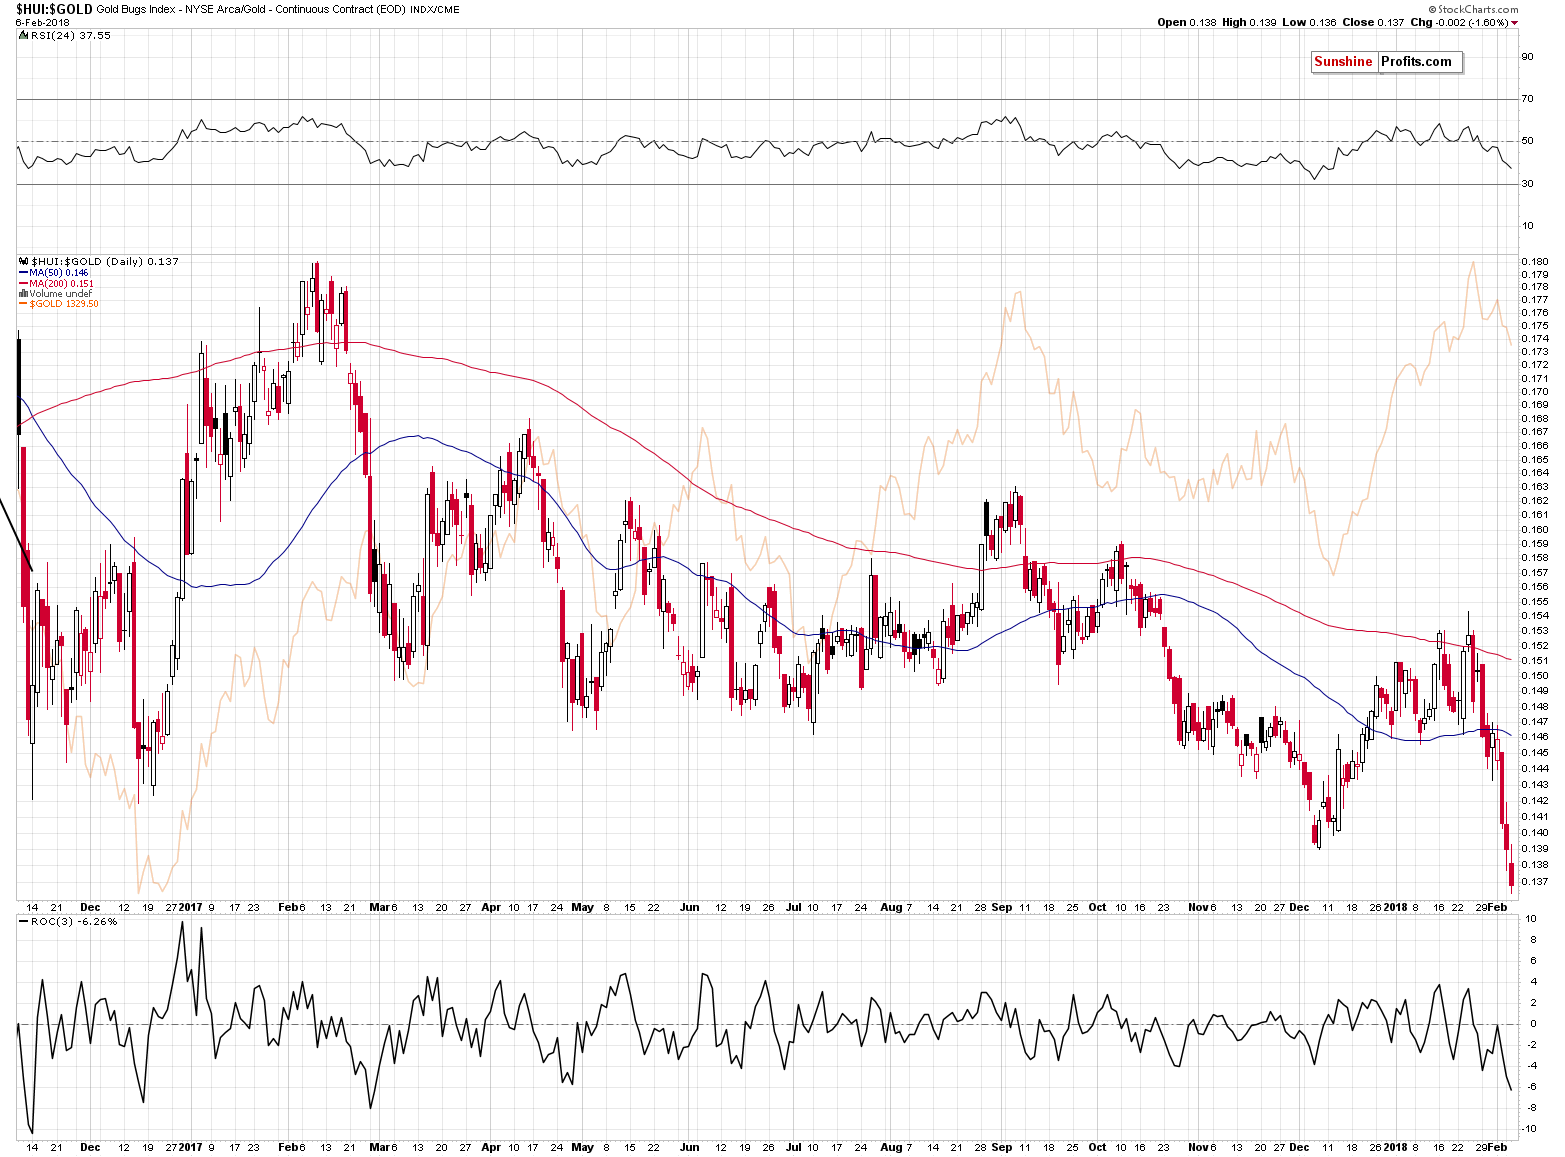
In the case of the gold stocks to gold ratio, we definitely have bearish implications. It was already after Monday’s closing price that we saw a small breakdown below the 2017 and 2016 lows, however, based on yesterday’s decline, the breakdowns are now clearly visible.
This opens the road to much lower valuations. Still, let’s not forget that verifications of breakdowns happen from time to time. For instance, in late October 2017, the ratio broke below the previous lows and consolidated before diving deeper. This corresponded to a relatively small – but still – corrective upswing in gold.
Then again, the above might have simply been a result of the cyclical turning point in gold (and in mining stocks). Consequently, it’s not clear if the preceding breakdown resulted in a verification, which in turn resulted in a small rally in gold. It seems more likely that it was the other way around. Gold and miners reversed their courses temporarily because of the turning point, but the corrective upswing was relatively small as – among other factors – the HUI to gold ratio was after a major breakdown and thus, there was a limit to how high the ratio and gold were eager to rally.
So, the question becomes, if we have a turning point nearby.
Not really, we already had one at the beginning of the month and it seems that the turnaround that preceded the turning point was the development that was likely to happen based on it.
In case you missed yesterday’s alert, and are perplexed by the turning points on the above chart, here’s a quick reminder:
One thing that we added on the above chart to help us determine the turning points for the mining stocks is their cyclical tendency. In short, the turnings point for mining stocks are the turning points for gold, with additional sub-cycles in between.
We’ve been recently asked if it’s true that mining stocks have turning points between the 4th and the 10th day of the month. The reply is that this was the case in the previous year – but it’s moving toward the scenario in which the turning points are seen at or very close the end of the month. Consequently, the next turning point is not this week, but it’s already behind us and the next one is at the end of February and the beginning of March.
In other words, there’s not much more to the 4th to 10th day of the month rule – it’s a cycle that will likely be continued, but the above rule will likely not. You knew about this cycle all along (precisely, about every other cycle as that’s what appeared most useful for the gold market).
The decline in miners has been quite sharp, so some kind of pause is likely, but if it is seen, it will not be based on the turning point.
The additional thing that we can see on the above chart is that the volume that accompanied yesterday’s decline was quite sizable, so the bearish implications of the price-volume link remain in place.
So, based on the gold stocks to gold ratio and the turning points for mining stocks (GDX, HUI and XAU), it doesn’t seem that the turnaround has to be seen shortly or that it’s likely.
Still, let’s keep in mind that if the current bearish momentum persists, mining stocks will reach their 2017 lows very soon. The RSI indicator is already close to the 30 level and since reaching it is a classic buy signal for the short term, we may see at least a corrective upswing soon.
Overall, based on the previous two charts, it seems that we may indeed see a corrective upswing once miners move to (or very close to) their 2017 lows, but it’s not likely that the upcoming rally will be anything significant.
The long-term HUI Index chart shows that one should indeed think at least twice before trying to time the upcoming correction.
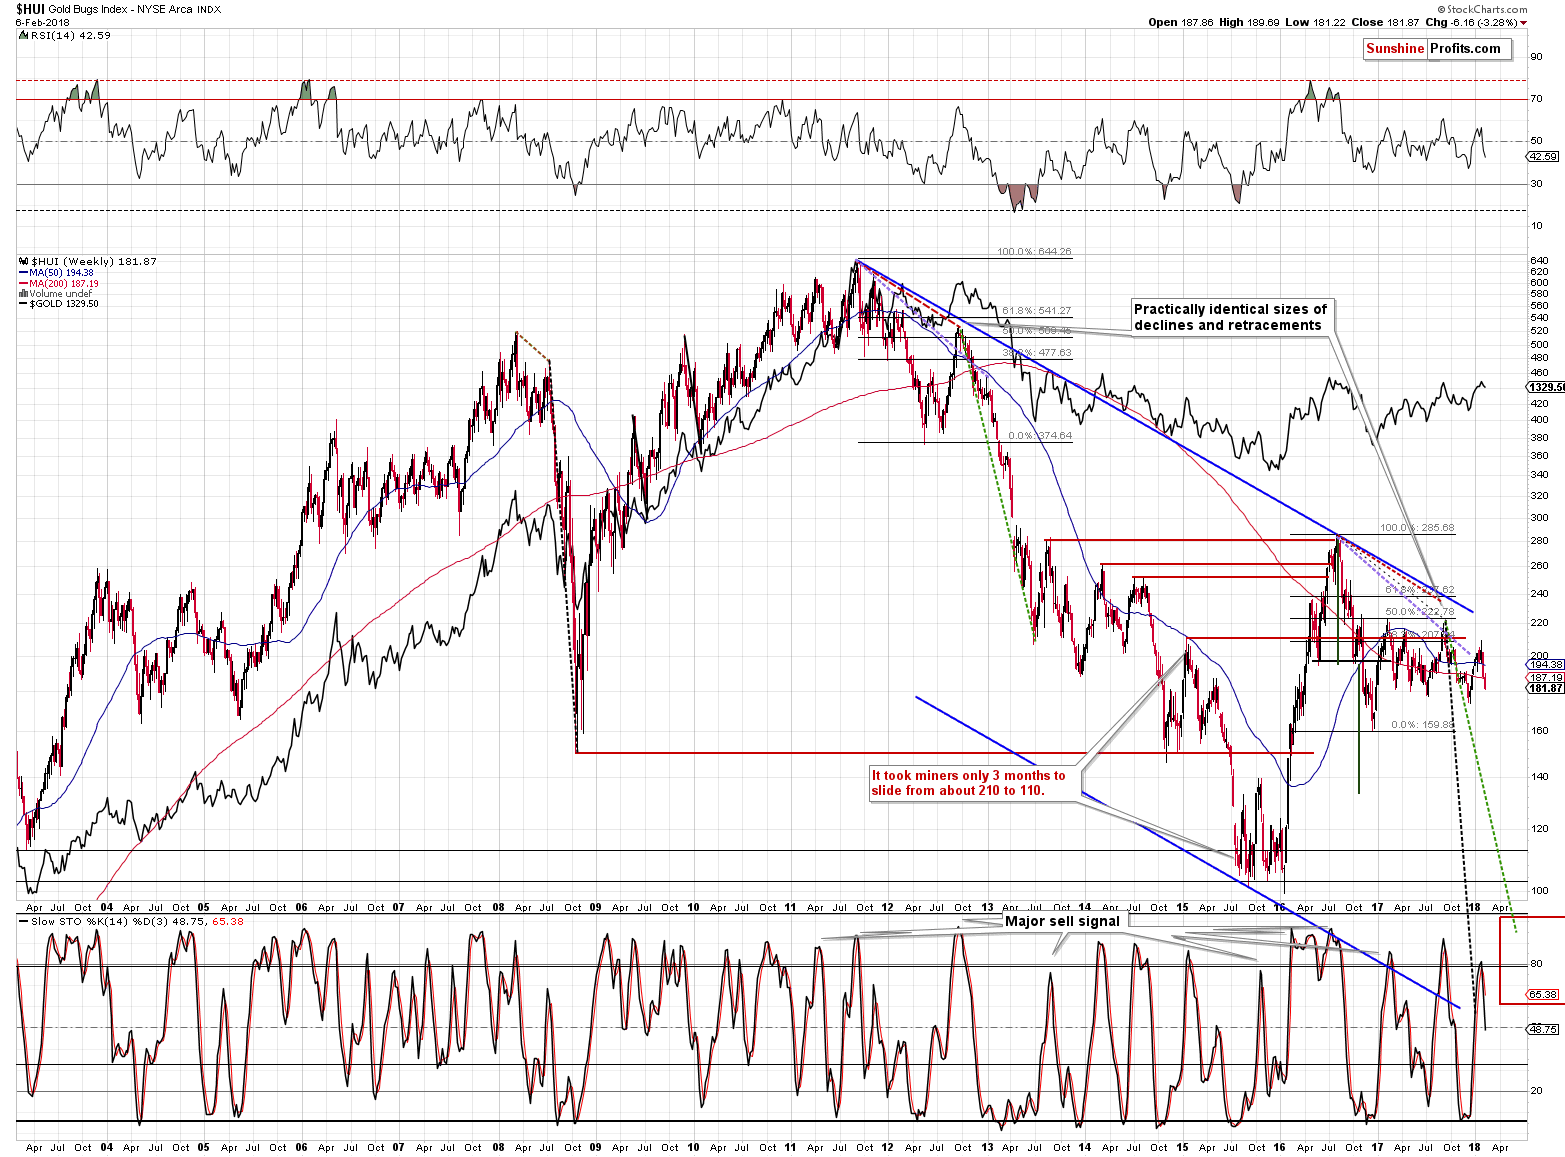
Let’s start with the thing that’s easiest to interpret. We just saw a long-term sell signal from the Stochastic indicator. Last year we saw it only twice and, in both cases, a big decline followed. This was the case also multiple times in the preceding years. Consequently, the implications here are bearish.
The thing that’s more complex, but also more rewarding from the analytical point of view, is the continuation of the analogy to the 2011 – 2013 period.
The 2011 and 2016 tops were preceded by substantial rallies, but they were shortly followed by big and sharp declines, and then by corrective upswings. This, by itself, is not enough to view these situations as similar, but the additional details are. These additional details are the sizes of the corrective upswings (about 50% in both cases as marked using Fibonacci retracements) and the – approximate – time that it took for the corrections to materialize. We marked the latter using red dashed lines. As you can see, the horizons are almost identical.
The declining purple, dashed line is a line connecting the top with the top of the first local move up during the decline. In this case, the price that was reached is correct only approximately and the time seems to be off for more than a month. The latter seems to be a violation of the analogy, but please keep in mind that the last couple of weeks were characterized by a sharp slide in the value of the USD Index that was only reflected in the PM prices to a small extent. In fact, in terms of the euro, gold topped very early in January, and taking this date into account would imply only a small deviation in the analogy present on the above chart. Overall, it seems that we can still view the analogy as present.
The interesting fact about the both initial local tops during the correction (the late-2012 one and the most recent 2018 one) is that they formed close to previous local tops.
What are the overall implications of the above? We should expect a big and volatile decline to follow. Last week’s performance and what we’re seeing this week seems to be just the very first sign of what’s to come. If the 2013 move is repeated, then we are likely to see the HUI Index well below the 100 level before the bottom is really in.
This may sound ridiculous, but the HUI at 200 sounded just as ridiculous when it was trading above 500 in late 2012. Yet, a year later, that’s exactly the value that we saw.
What does the above imply for the near term? Back in 2013, there was no visible corrective upswing until the HUI broke below the previous major low (the 2012 low). The analogous low is the late-2016 bottom, which is relatively far. So, if the analogy is to continue, then gold miners may move significantly lower without a bigger move higher.
Summing up, the USD’s recent epic turnaround along with gold’s extraordinary weakness relative to the USD’s movement along with multiple bearish confirmations paint a very bearish picture for the precious metals market for the following weeks. The situation was very bearish for PMs based on the above, but the record-breaking weekly and monthly volume levels in gold took the bearishness to a new – even more extreme – level. Gold’s inability to move much higher despite the stocks’ 4% decline and a rally in the Japanese yen shows that the market doesn’t really want to move up – it wants to move lower.
The mining stocks’ underperformance and the breakdown in the HUI to gold ratio below the 2016 and 2017 lows suggest that the big decline is already underway.
On a side note, please note that our bearish comments on the precious metals sector doesn’t make us an enemy of gold and silver investors – it makes us a true (!) friend. If you ask your friends how you look before going to an important meeting, everyone will tell you that you look great regardless of the truth as they will prefer not to be the ones that ruin your mood by saying something unpleasant. But a true friend will tell you how things really are, so that you can fix something before your leave. This may be unpleasant, but ultimately, it’s the second approach that benefits you. Most gold promoters will want you to think that gold is going to go higher no matter what happens and all you should do is buy, buy, buy. And then buy some more. They don’t want to risk upsetting you. But not us. We’re that true friend that tells you what they think and why, regardless of the possibility of being unpleasant – so that you can benefit more. In this case, if we’re correct about the bearish outlook for the precious metals, it will be much more profitable to be buying at lower prices than at the current ones.
So, in our view, the outlook for the precious metals market is friendly bearish. The precious metals market is likely to move much higher in the coming years, but if we’re correct about the medium-term decline first, then the best buying opportunity is still ahead of us.
As always, we will keep you – our subscribers – informed.
To summarize:
Trading capital (supplementary part of the portfolio; our opinion): Full short positions (200% of the full position) in gold, silver and mining stocks are justified from the risk/reward perspective with the following stop-loss orders and initial target price levels:
- Gold: initial target price: $1,218; stop-loss: $1,382; initial target price for the DGLD ETN: $53.98; stop-loss for the DGLD ETN $37.68
- Silver: initial target price: $14.63; stop-loss: $17.82; initial target price for the DSLV ETN: $33.88; stop-loss for the DSLV ETN $20.88
- Mining stocks (price levels for the GDX ETF): initial target price: $19.22; stop-loss: $26.14; initial target price for the DUST ETF: $39.88; stop-loss for the DUST ETF $15.78
In case one wants to bet on junior mining stocks' prices (we do not suggest doing so – we think senior mining stocks are more predictable in the case of short-term trades – if one wants to do it anyway, we provide the details), here are the stop-loss details and initial target prices:
- GDXJ ETF: initial target price: $27.82; stop-loss: $38.22
- JDST ETF: initial target price: $94.88 stop-loss: $37.78
Long-term capital (core part of the portfolio; our opinion): No positions (in other words: cash)
Insurance capital (core part of the portfolio; our opinion): Full position
Important Details for New Subscribers
Whether you already subscribed or not, we encourage you to find out how to make the most of our alerts and read our replies to the most common alert-and-gold-trading-related-questions.
Please note that the in the trading section we describe the situation for the day that the alert is posted. In other words, it we are writing about a speculative position, it means that it is up-to-date on the day it was posted. We are also featuring the initial target prices, so that you can decide whether keeping a position on a given day is something that is in tune with your approach (some moves are too small for medium-term traders and some might appear too big for day-traders).
Plus, you might want to read why our stop-loss orders are usually relatively far from the current price.
Please note that a full position doesn’t mean using all of the capital for a given trade. You will find details on our thoughts on gold portfolio structuring in the Key Insights section on our website.
As a reminder – “initial target price” means exactly that – an “initial” one, it’s not a price level at which we suggest closing positions. If this becomes the case (like it did in the previous trade) we will refer to these levels as levels of exit orders (exactly as we’ve done previously). Stop-loss levels, however, are naturally not “initial”, but something that, in our opinion, might be entered as an order.
Since it is impossible to synchronize target prices and stop-loss levels for all the ETFs and ETNs with the main markets that we provide these levels for (gold, silver and mining stocks – the GDX ETF), the stop-loss levels and target prices for other ETNs and ETF (among other: UGLD, DGLD, USLV, DSLV, NUGT, DUST, JNUG, JDST) are provided as supplementary, and not as “final”. This means that if a stop-loss or a target level is reached for any of the “additional instruments” (DGLD for instance), but not for the “main instrument” (gold in this case), we will view positions in both gold and DGLD as still open and the stop-loss for DGLD would have to be moved lower. On the other hand, if gold moves to a stop-loss level but DGLD doesn’t, then we will view both positions (in gold and DGLD) as closed. In other words, since it’s not possible to be 100% certain that each related instrument moves to a given level when the underlying instrument does, we can’t provide levels that would be binding. The levels that we do provide are our best estimate of the levels that will correspond to the levels in the underlying assets, but it will be the underlying assets that one will need to focus on regarding the signs pointing to closing a given position or keeping it open. We might adjust the levels in the “additional instruments” without adjusting the levels in the “main instruments”, which will simply mean that we have improved our estimation of these levels, not that we changed our outlook on the markets. We are already working on a tool that would update these levels on a daily basis for the most popular ETFs, ETNs and individual mining stocks.
Our preferred ways to invest in and to trade gold along with the reasoning can be found in the how to buy gold section. Additionally, our preferred ETFs and ETNs can be found in our Gold & Silver ETF Ranking.
As a reminder, Gold & Silver Trading Alerts are posted before or on each trading day (we usually post them before the opening bell, but we don't promise doing that each day). If there's anything urgent, we will send you an additional small alert before posting the main one.
=====
Hand-picked precious-metals-related links:
PRECIOUS-Gold rises from over 3-week low on bargain hunting
Gold price: 9 straight years of record annual mine production
China’s Love Affair With Gold Heating Up on Property Riches
=====
In other news:
Europe Stocks Gain as U.S. Futures Drop; Oil Slips: Markets Wrap
Fed's Kaplan says market correction healthy, sees no economic impact
House passes stopgap spending bill to avert shutdown
How Two Tiny Vol Products Helped Fuel Sudden Stock Slump
Inside Wall Street's $8 Billion VIX Time Bomb
Is Wall Street's Untested Millennial Majority a Risk?
Three Lessons for Investors in Turbulent Markets
Get Ready for Most Cryptocurrencies to Hit Zero, Goldman Says
=====
Thank you.
Sincerely,
Przemyslaw Radomski, CFA
Founder, Editor-in-chief, Gold & Silver Fund Manager
Gold & Silver Trading Alerts
Forex Trading Alerts
Oil Investment Updates
Oil Trading Alerts

