

Briefly: In our opinion, full (200% of the regular size of the position) speculative short positions in gold, silver and mining stocks are justified from the risk/reward perspective at the moment of publishing this alert.
The bearish case for gold continues as fresh new bearish confirmations have just emerged. You have already read about gold’s huge weekly volume, gold stocks’ underperformance and many other factors. Yesterday’s session provides us with even more bearish details. But, there’s one thing that looks promising for gold bulls – the possibility of a big and sharp decline in the stock market. Some expect money coming out of the stock market to flow into precious metals, thus pushing their prices higher. As much as we love gold (and silver even more) as a very long-term investment, in today’s analysis, we dismiss the above stock-based hope.
However, before we move to the above discussion, let’s check yesterday’s price performance (charts courtesy of http://stockcharts.com). Like it was the case yesterday, we’ll start with the HUI Index.
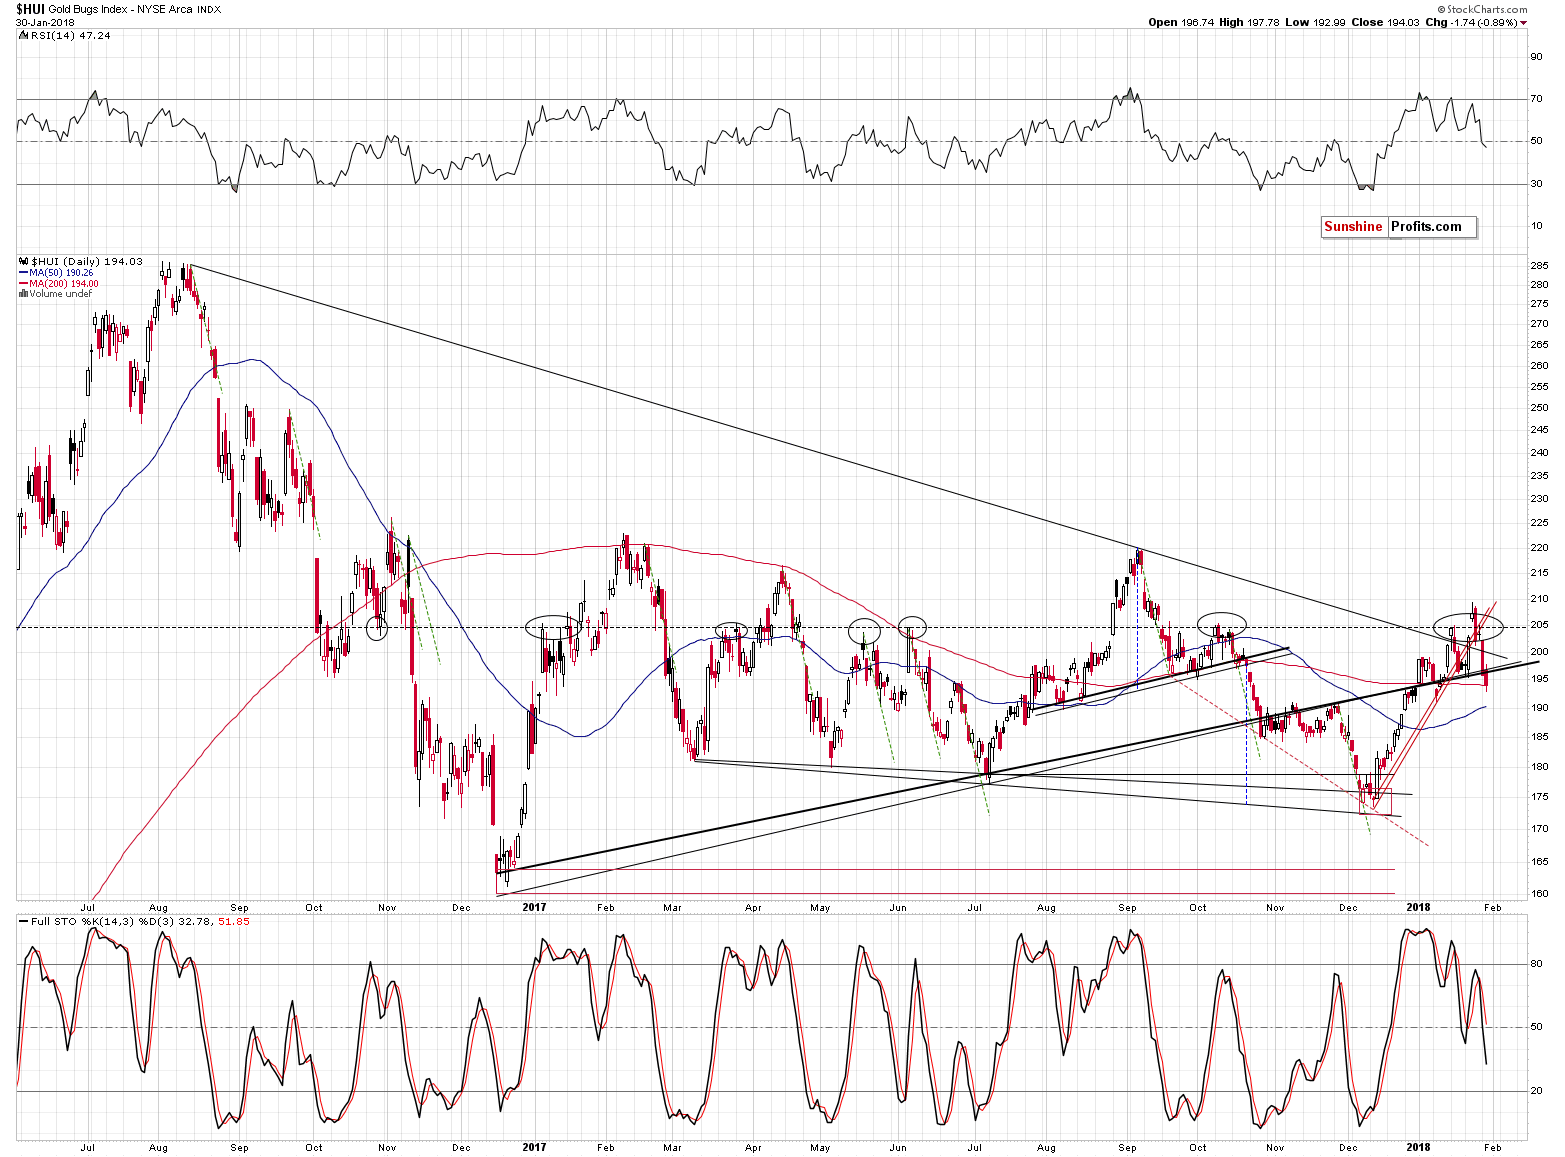
In yesterday’s alert, we wrote the following on the above chart:
Gold miners broke below almost all important nearby levels that could be broken. The level that was not clearly broken is the rising, medium-term support/resistance line based on the December 2016 an July 2017 lows. It was broken by just a little, so it’s not fully bearish, but practically everything else about the above chart is, so the implications are still very bearish.
Based on yesterday’s closing price, the mentioned line was indeed broken in a clear way. The bearish implications of the above chart just got even more bearish.
In yesterday’s alert, we also emphasized that it was not the decline in gold stocks by itself that was so bearish. It’s the gold stocks’ relationship with gold that’s important.
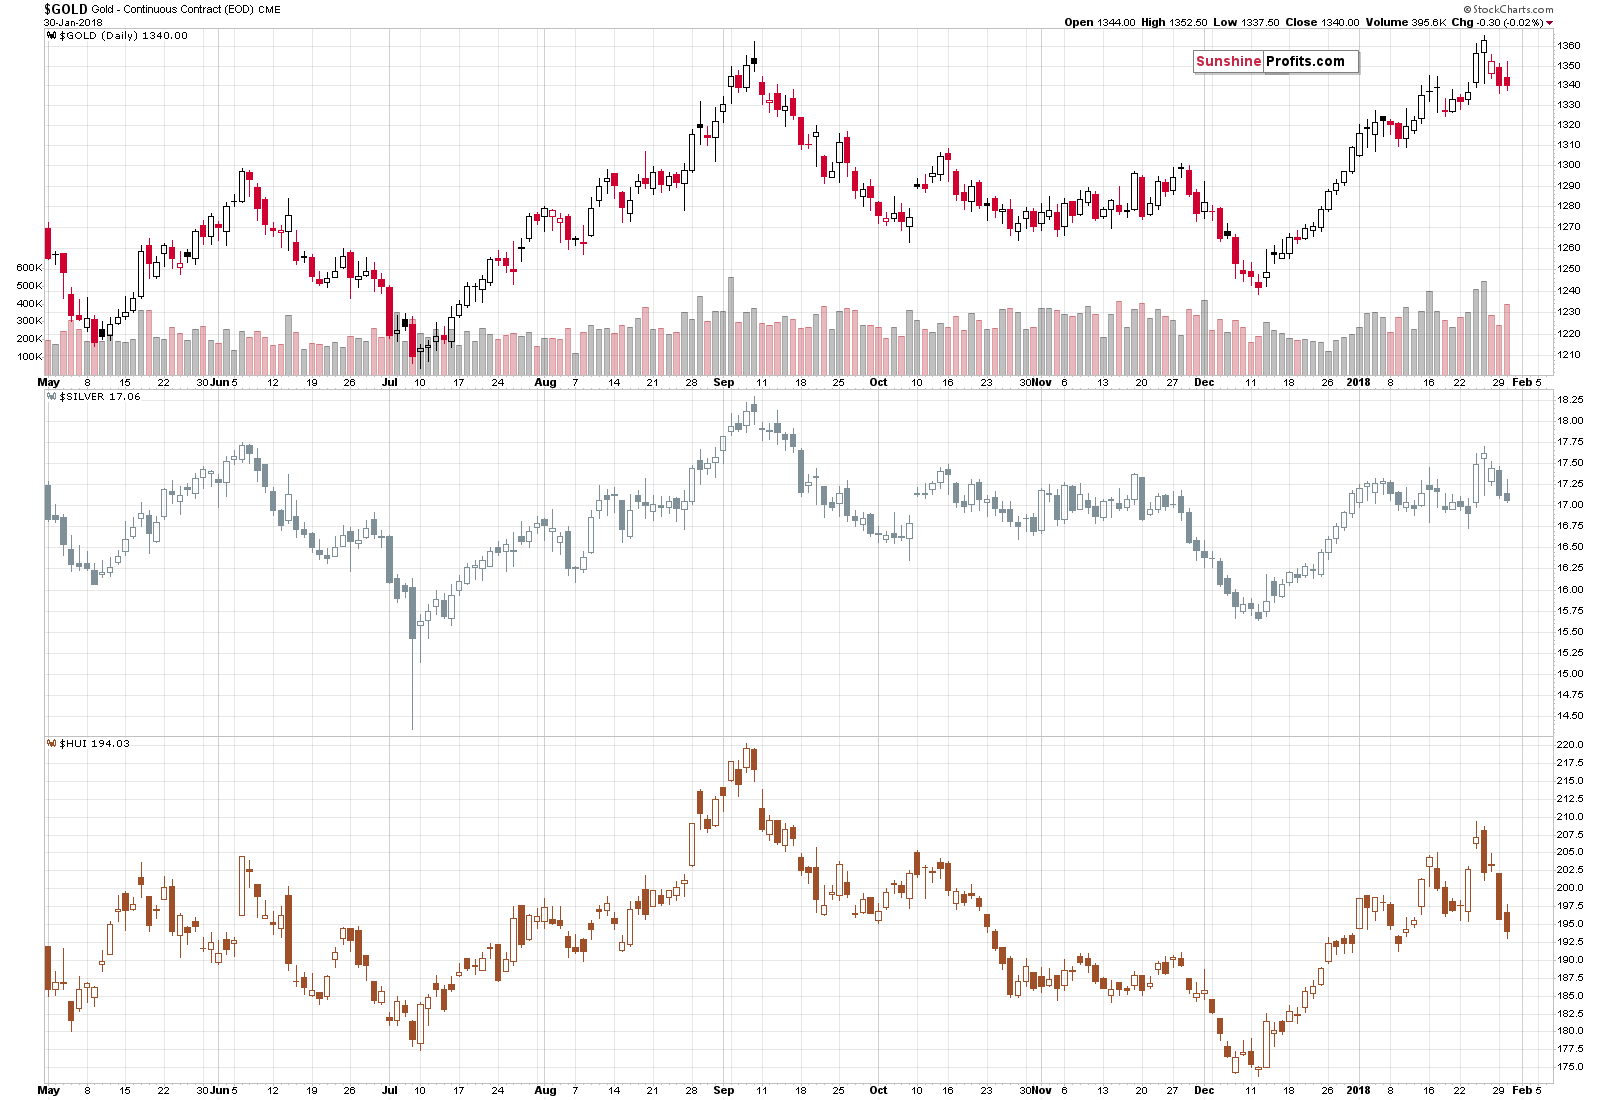
Both of the above charts show that the underperformance of gold stocks is clearly underway. While gold closed yesterday’s session relatively nearby to the previous closing prices, the HUI Index once again closed visibly lower.
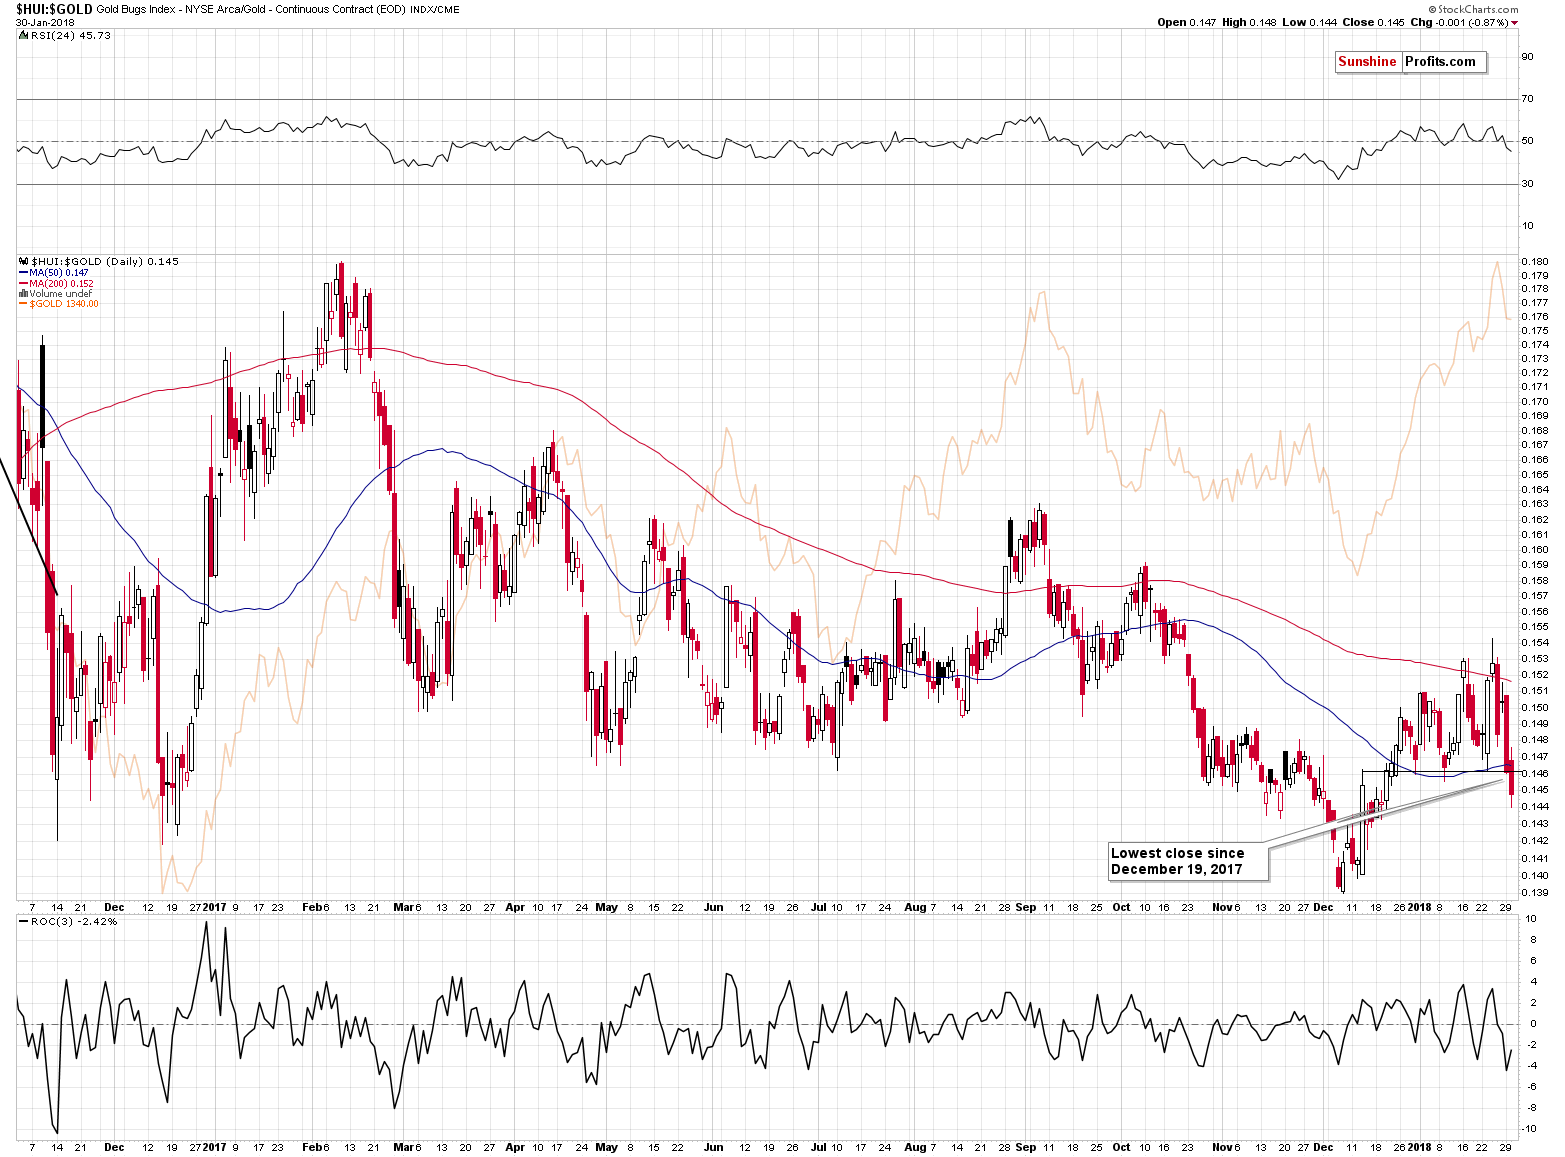
Consequently, we see another sizable move lower in the HUI to gold ratio. The implications are bearish.
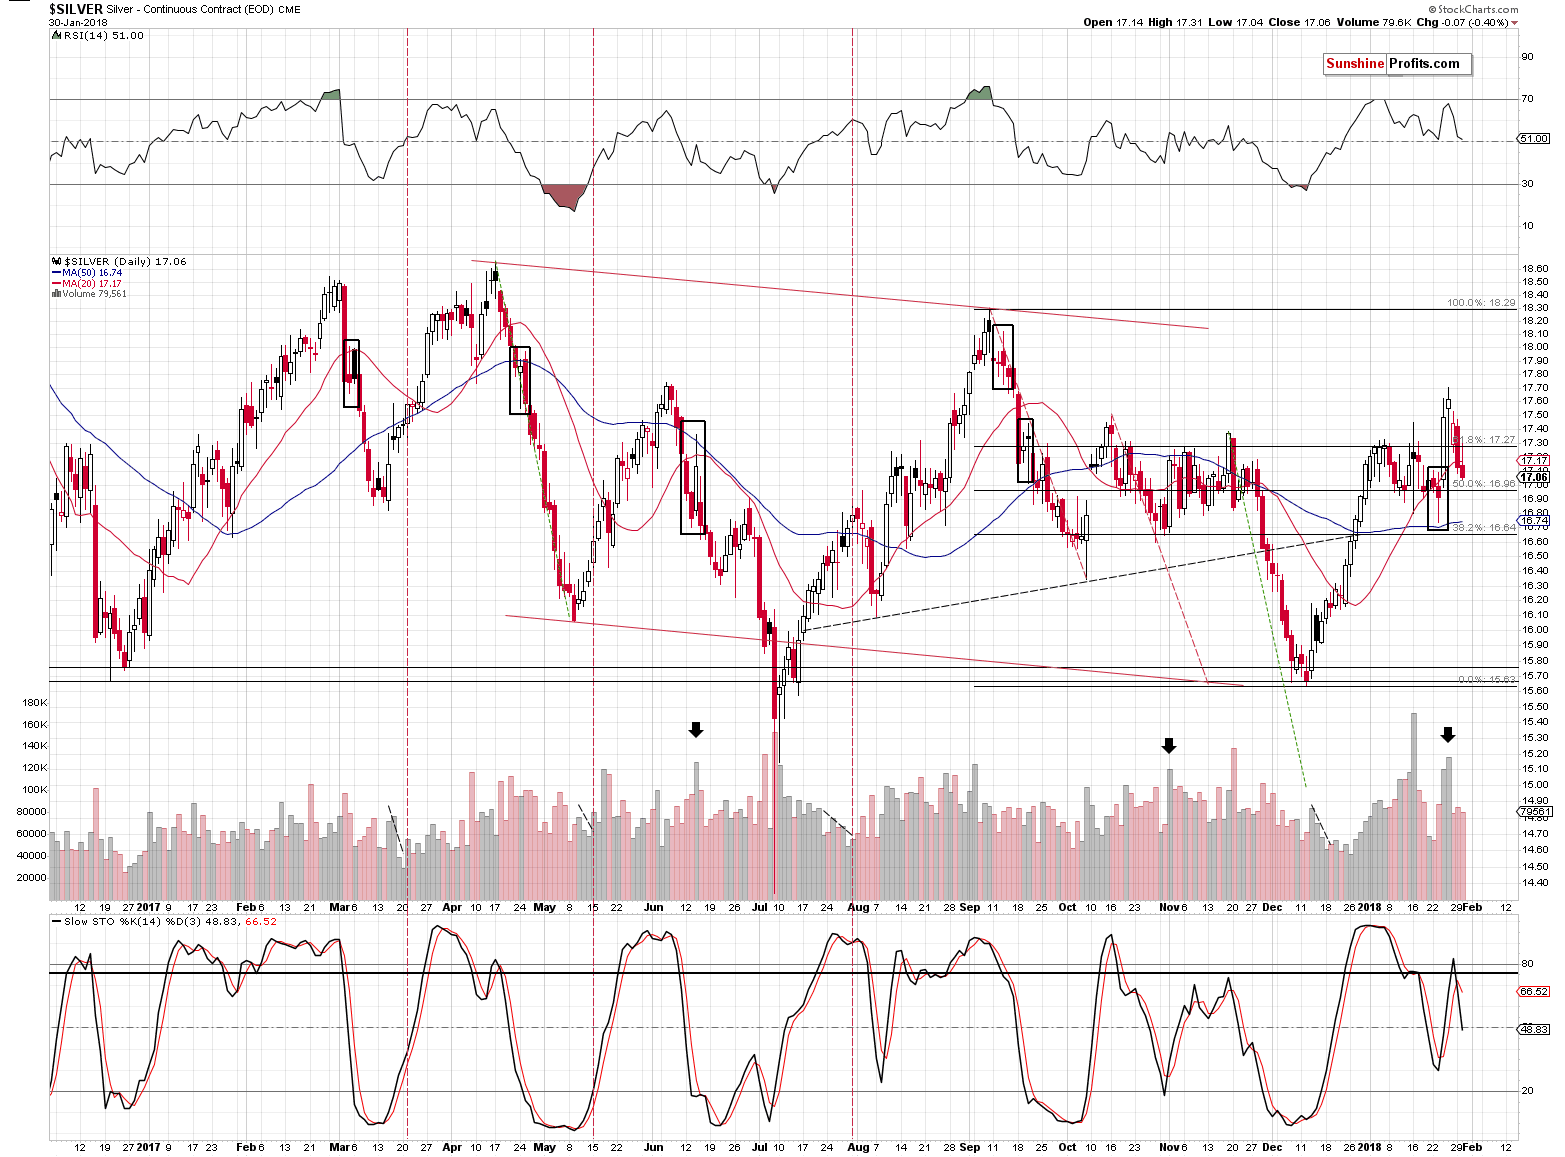
In yesterday’s alert, we wrote the following on silver:
In the recent past we wrote about 2 specific signals related to the very high volume levels. Both of them had bearish implications and it seems that we are beginning to see the results of these signals.
The Stochastic indicator just flashed a small sell signal, suggesting that that this is indeed just the beginning.
By the way, if you’ve been wondering what we based our stop-loss for silver on – it was the possibility of silver repeating the April 2017 topping pattern. Back then the breakout was small and it didn’t change the overall outlook. Moreover, it’s important to be aware that silver tends to “fake out” instead of breaking out quite often. It seems that silver has indeed repeated the “fakeout top” scenario. Naturally, the implications are bearish.
The above remains up-to-date except for the comments on the Stochastic indicator. Today, the sell signal is no longer small – it’s clearly visible. The thing that we would like to add today is the shape of yesterday’s session. Silver tried to move higher, but failed to do so, even despite a small move lower in the USD Index. That’s yet another sign of weakness.
Is gold’s short-term picture just as bearish?
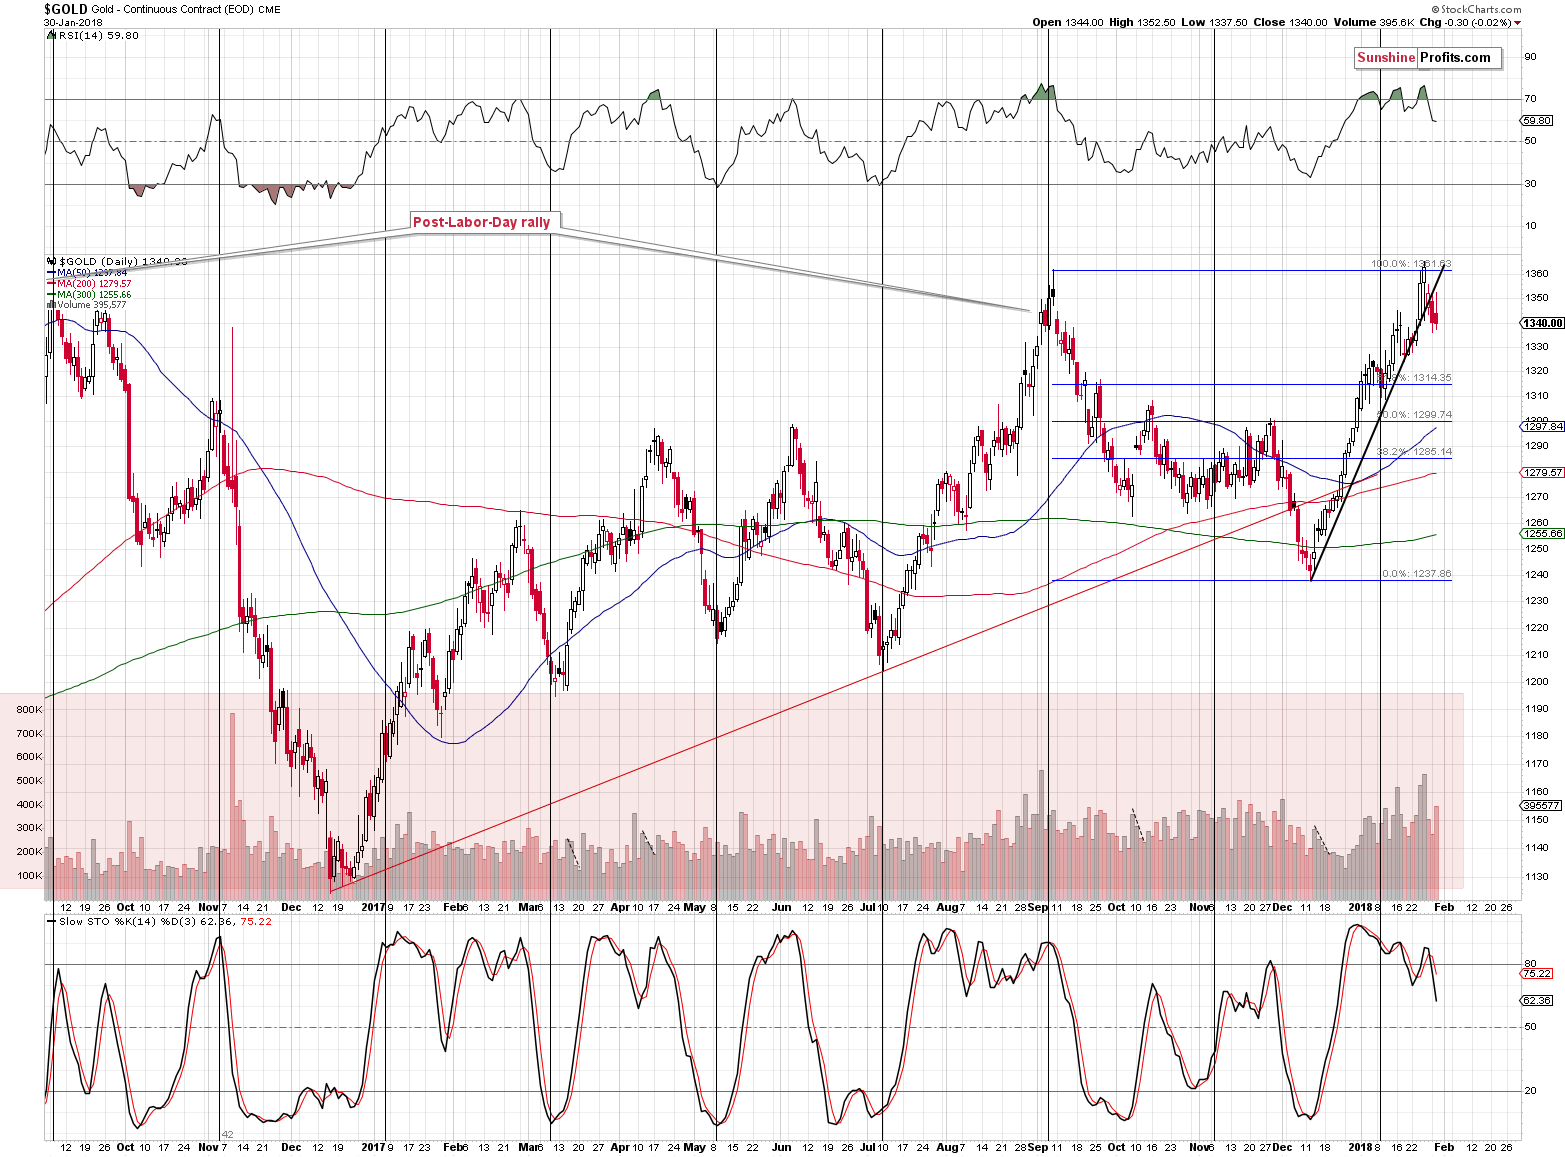
It’s starting to be. The yellow metal’s price moved higher during yesterday’s session, almost touching the previously broken rising support line and ended the session lower after giving up all the earlier gains. The breakdown is almost verified. Almost, because – based on our experience – it’s best to wait for 3 consecutive closing prices before saying that a breakdown is confirmed. Still, the failed attempt to move higher is a good indication that the breakdown will be confirmed and that lower prices will follow.
The most prominent bearish factor that we saw yesterday is once again the metals’ and miners’ inability to take real advantage of the downswings in the USD. The latter closed yesterday’s session a bit lower and yet gold and silver closed lower as well. The miners’ sizable decline serves as an exclamation point to the bearish implications of the mentioned metals-USD link.
In other words, we’ve just seen yet another bearish confirmation from the intermarket relationships.
What about Gold and Stock Market?
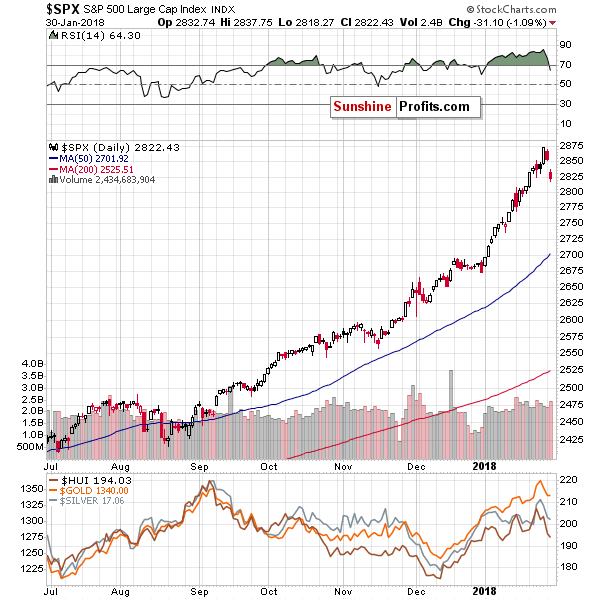
Let’s start with the stock market itself. As Paul correctly expected, the general stock market plunged. Does this mark the start of a 2008-like decline? Time will tell, but the thing that we would like to discuss today is what could take place in the precious metals market if a bigger decline is indeed seen in stocks (not necessarily as big as in 2008).
Let’s start with looking at the correlations, using our Correlation Matrix.
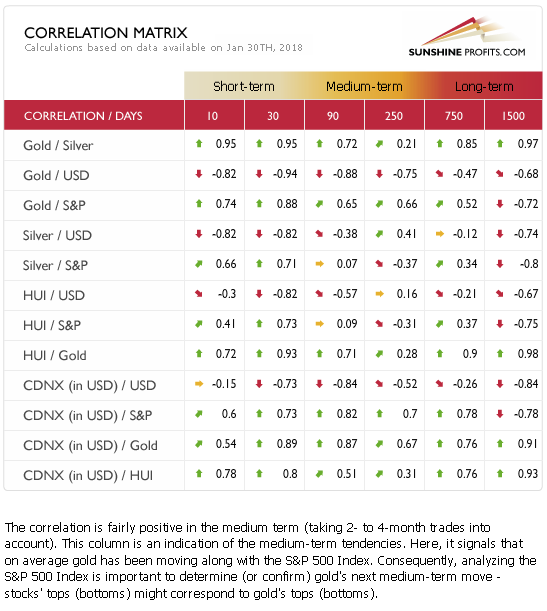
The above description is for the 90-trading-day column and the Gold / S&P 500 row. Indeed, the correlation in the past 90 trading days was rather positive, but the strength of the link is nothing to call home about. It’s more visible in the case of the past 30 trading days as both markets moved in tune (mostly rallying). So far there’s nothing that would indicate a negative relationship between stocks and gold – in fact, it seems that stocks could rally and decline along with gold in the coming months.
The longest analyzed time-frame, however, (1,500 trading days) shows visibly negative correlation. No wonder – in the past 6 years gold moved lower, while stocks moved higher.
This gives us an indication that the general rule that we presented in the opening paragraph of today’s analysis may be true and the money that will flow out of the stock market will move into precious metals. But, it may take years for the process to materialize. It’s pointless to expect this to be of any help in the short or medium term. Even a yearly decline might not be enough for the above factor to kick in.
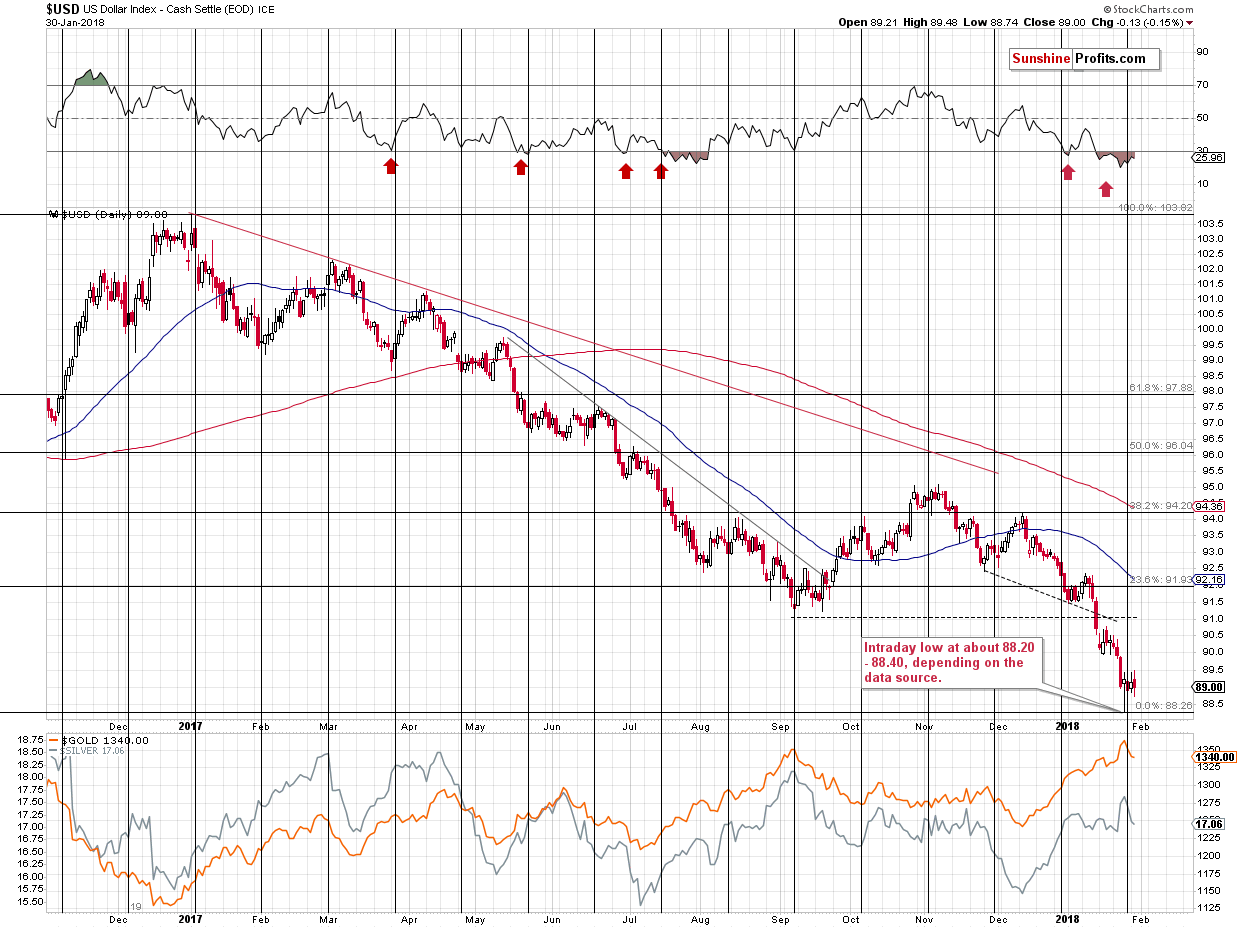
Before moving further, please note that the link between gold and the USD index is much more stable, especially in the short term. Consequently, if gold and stocks are both affected by a move in the USD, then this will be the key driver for gold. A move in the stock market would, in this case, be a result and not the cause. Given the current situation in the USD Index, the above scenario seems to be likely.
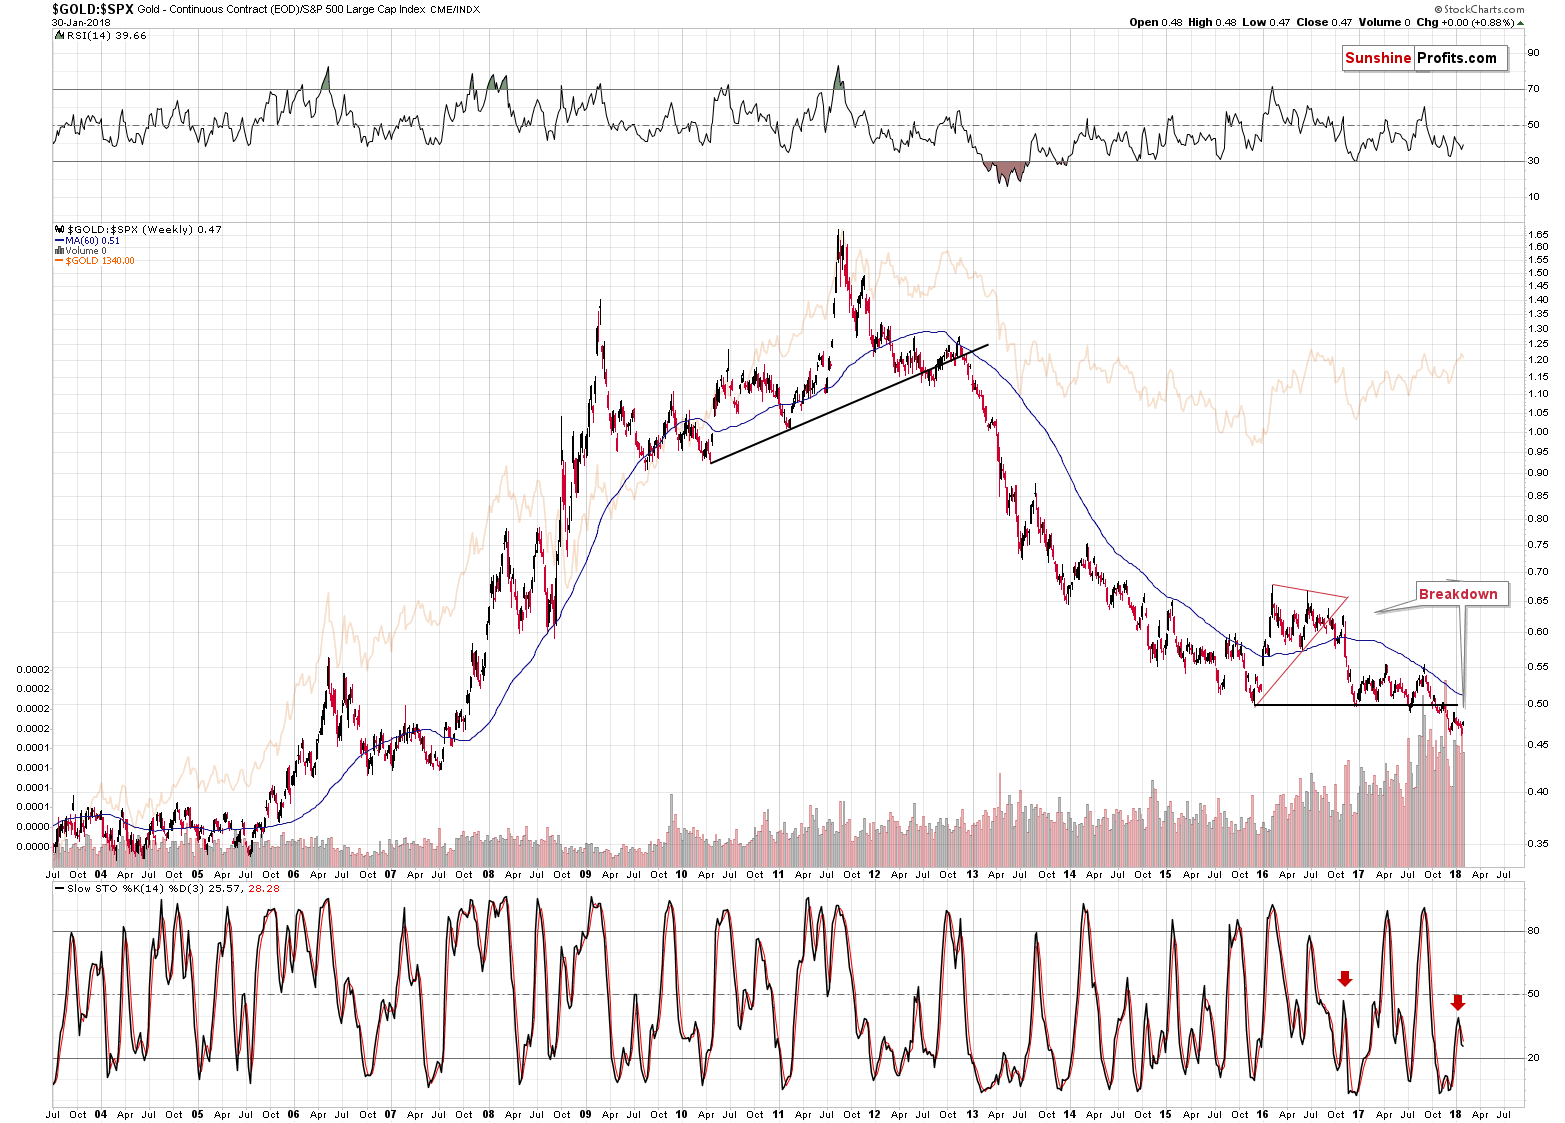
We described the details behind the gold to S&P 500 ratio on Monday and these comments remain up-to-date. Today we would like to add that even if stocks decline faster than gold, then there’s still room for the ratio to move higher before it changes anything regarding the outlook for both the ratio and the price of gold.
But will the ratio rally at all? Back in 2008 during the decline, the ratio moved in tune with gold, not against it – at least in the first part of the decline.
All in all, based on the factors that we have discussed so far, it seems that the link between gold and the general stock market is somewhat unclear.
This brings us to the most important part of today’s gold – S&P 500 Index analysis. This part will make the link much clearer, but not in the way many gold investors would expect.
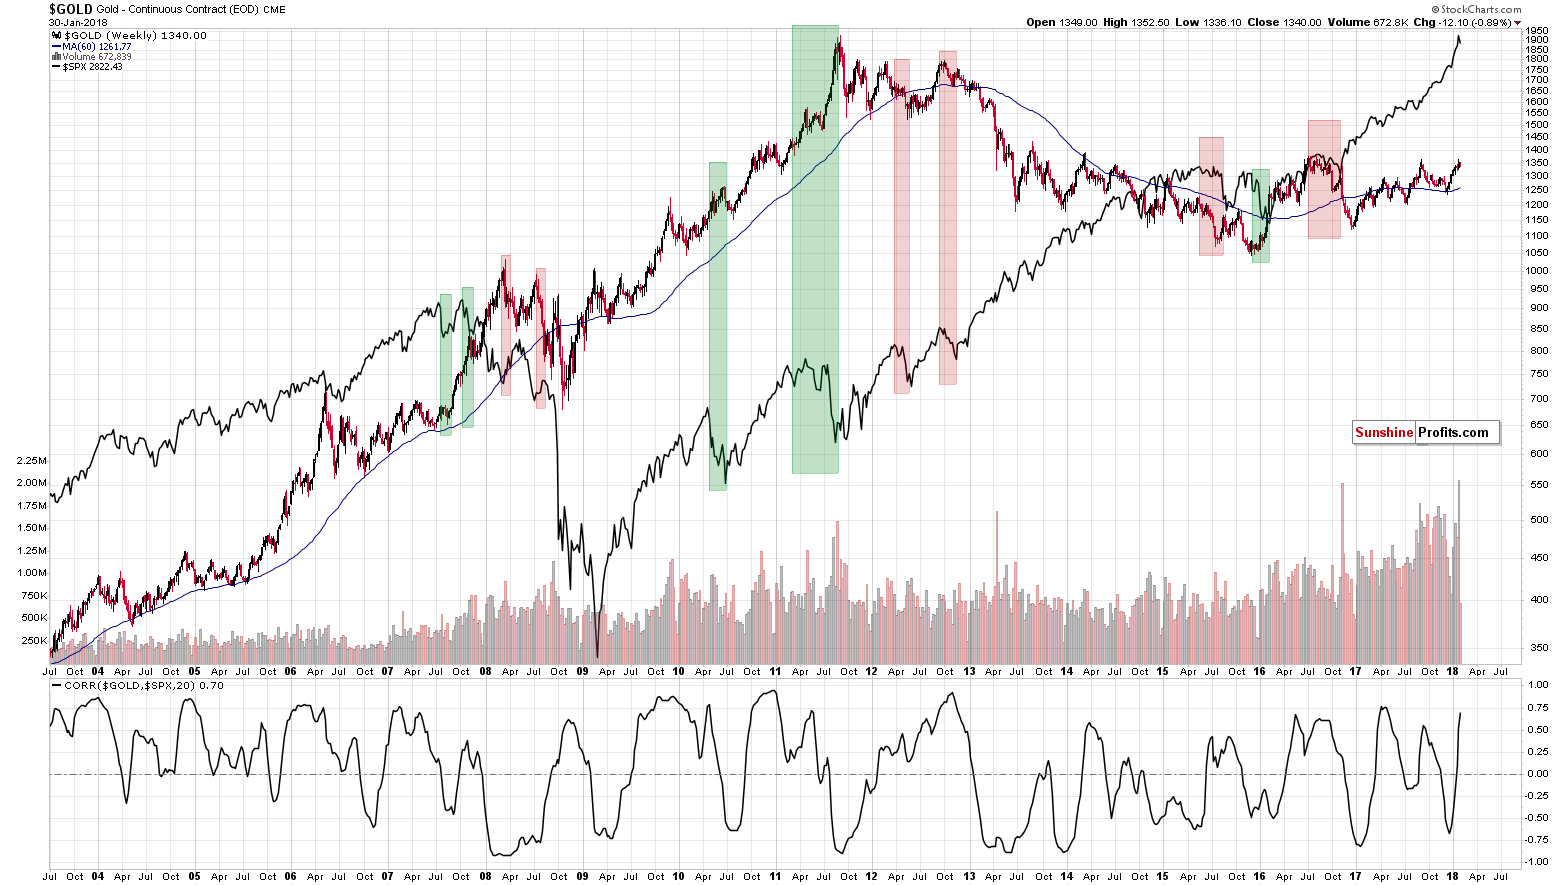
The above chart features gold (candlesticks) along with the S&P 500 Index (solid black line). We marked the bigger declines in the latter with semi-transparent rectangles.
The green rectangles represent cases when gold rallied during a decline in the stock market and the red rectangles represent cases when gold declined along with the stock market.
What’s one thing that – right from the start – differentiates between the above two kinds of reaction? Autocorrelation. Autocorrelation is a fancy way of saying that what happens first, makes the same reaction likely, which makes the follow-up to the follow-up likely to be the same as well – and so on. In other words, the way gold initially reacted to the decline in the S&P 500 was the way in which it kept on reacting in the following weeks and – sometimes – months.
What kind of price action did we see yesterday and on Monday? The S&P declined along with gold. So, what’s the likely impact that a declining stock market is going to have on the precious metals market? It’s likely going to be negative in the following weeks and – perhaps – months.
Summing up, the USD’s epic turnaround along with gold’s extraordinary weakness relative to the USD’s intraday decline along with multiple bearish confirmations paint a very bearish picture for the precious metals market for the following weeks. The situation was very bearish for PMs based on the above, but the record-breaking weekly volume in gold took the bearishness to a new – even more extreme – level. This week’s very significant underperformance in gold stocks serves as a perfect bearish confirmation.
The declining stocks market is often viewed as something that could trigger a rally in gold, but it doesn’t seem that it will be the case in the following weeks. Conversely, it seems likely that declining stock market will have negative impact on the precious metals sector.
As always, we will keep you – our subscribers – informed.
To summarize:
Trading capital (supplementary part of the portfolio; our opinion): Full short positions (200% of the full position) in gold, silver and mining stocks are justified from the risk/reward perspective with the following stop-loss orders and initial target price levels:
- Gold: initial target price: $1,218; stop-loss: $1,382; initial target price for the DGLD ETN: $53.98; stop-loss for the DGLD ETN $37.68
- Silver: initial target price: $14.63; stop-loss: $17.82; initial target price for the DSLV ETN: $33.88; stop-loss for the DSLV ETN $20.88
- Mining stocks (price levels for the GDX ETF): initial target price: $19.22; stop-loss: $26.14; initial target price for the DUST ETF: $39.88; stop-loss for the DUST ETF $15.78
In case one wants to bet on junior mining stocks' prices (we do not suggest doing so – we think senior mining stocks are more predictable in the case of short-term trades – if one wants to do it anyway, we provide the details), here are the stop-loss details and initial target prices:
- GDXJ ETF: initial target price: $27.82; stop-loss: $38.22
- JDST ETF: initial target price: $94.88 stop-loss: $37.78
Long-term capital (core part of the portfolio; our opinion): No positions (in other words: cash)
Insurance capital (core part of the portfolio; our opinion): Full position
Important Details for New Subscribers
Whether you already subscribed or not, we encourage you to find out how to make the most of our alerts and read our replies to the most common alert-and-gold-trading-related-questions.
Please note that the in the trading section we describe the situation for the day that the alert is posted. In other words, it we are writing about a speculative position, it means that it is up-to-date on the day it was posted. We are also featuring the initial target prices, so that you can decide whether keeping a position on a given day is something that is in tune with your approach (some moves are too small for medium-term traders and some might appear too big for day-traders).
Plus, you might want to read why our stop-loss orders are usually relatively far from the current price.
Please note that a full position doesn’t mean using all of the capital for a given trade. You will find details on our thoughts on gold portfolio structuring in the Key Insights section on our website.
As a reminder – “initial target price” means exactly that – an “initial” one, it’s not a price level at which we suggest closing positions. If this becomes the case (like it did in the previous trade) we will refer to these levels as levels of exit orders (exactly as we’ve done previously). Stop-loss levels, however, are naturally not “initial”, but something that, in our opinion, might be entered as an order.
Since it is impossible to synchronize target prices and stop-loss levels for all the ETFs and ETNs with the main markets that we provide these levels for (gold, silver and mining stocks – the GDX ETF), the stop-loss levels and target prices for other ETNs and ETF (among other: UGLD, DGLD, USLV, DSLV, NUGT, DUST, JNUG, JDST) are provided as supplementary, and not as “final”. This means that if a stop-loss or a target level is reached for any of the “additional instruments” (DGLD for instance), but not for the “main instrument” (gold in this case), we will view positions in both gold and DGLD as still open and the stop-loss for DGLD would have to be moved lower. On the other hand, if gold moves to a stop-loss level but DGLD doesn’t, then we will view both positions (in gold and DGLD) as closed. In other words, since it’s not possible to be 100% certain that each related instrument moves to a given level when the underlying instrument does, we can’t provide levels that would be binding. The levels that we do provide are our best estimate of the levels that will correspond to the levels in the underlying assets, but it will be the underlying assets that one will need to focus on regarding the signs pointing to closing a given position or keeping it open. We might adjust the levels in the “additional instruments” without adjusting the levels in the “main instruments”, which will simply mean that we have improved our estimation of these levels, not that we changed our outlook on the markets. We are already working on a tool that would update these levels on a daily basis for the most popular ETFs, ETNs and individual mining stocks.
Our preferred ways to invest in and to trade gold along with the reasoning can be found in the how to buy gold section. Additionally, our preferred ETFs and ETNs can be found in our Gold & Silver ETF Ranking.
As a reminder, Gold & Silver Trading Alerts are posted before or on each trading day (we usually post them before the opening bell, but we don't promise doing that each day). If there's anything urgent, we will send you an additional small alert before posting the main one.
=====
Latest Free Trading Alerts:
Looking at the daily chart of USD/CHF we can summarize the recent days in one word: boredom. But behind the current consolidation there may be something more than we think at first glance. Read today's alert and you'll find out what we mean.
USD/CHF - C Is for Consolidation
=====
Hand-picked precious-metals-related links:
PRECIOUS-Gold rebounds as dollar slips, but seen as vulnerable
World Gold Council upbeat on Long Term Outlook for Gold Demand in India
Alabama Bill Would Encourage Use of Gold and Silver in Trade
=====
In other news:
Fed expected to keep interest rates steady as Yellen era ends
ECB won't be too hasty in ending bond buys: Coeure
Euro zone inflation dip underpins ECB caution
German Joblessness Hits Record Low as Companies Face Bottlenecks
There’s a risk of market turbulence, but it’s unlikely to hit until 2019, says Santander chairman
Signaling Crackdown, SEC Boss Emerges as Crypto Skeptic-in-Chief
The Fintech World Responds To Market Focus On Cryptocurrencies
=====
Thank you.
Sincerely,
Przemyslaw Radomski, CFA
Founder, Editor-in-chief, Gold & Silver Fund Manager
Gold & Silver Trading Alerts
Forex Trading Alerts
Oil Investment Updates
Oil Trading Alerts

