

Briefly: in our opinion, full (250% of the regular size of the position) speculative short positions in gold, silver and mining stocks are justified from the risk/reward perspective at the moment of publishing this alert.
After an extremely bearish week, we finally saw a bit of strength in the precious metals market on Friday. Even mining stocks – finally – rallied. While all the important details seem to come from gold, silver, mining stocks, or one of their ratios, one should not forget about the markets that impact the above in a meaningful way. The most important of these markets is the USD Index, and it just formed a bearish shooting star candlestick in terms of the weekly price changes. That’s a very bearish development, which – if it is followed by a sizable decline in the USDX – is likely to trigger a powerful rally in the precious metals sector. What should one do in such an environment?
In 346 BCE, hoping to avoid a fight that would cost him troops that he would need in Persia, Philip II (king of Macedonia) decided to try to bluff the Spartans into an alliance. “It would be best for you to submit at once,” Philip declared in a message to the city. “If I win a war with Sparta, I will raze it to the ground. I will kill your men, and make slaves of your women and children. I will destroy you.”
Why are we quoting the above right after mentioning the situation in the USD Index?
In response to the above, the ruling council of Sparta, known as the Ephors, sent back a message consisting of just one word. This word is also the perfect reply to the previous sentence regarding the possibility of seeing a PMs’ rally triggered by a sizable decline in the USDX.
“If”.
Let’s take a look at the USDX chart (charts courtesy of http://stockcharts.com).
USD Index Downside Target
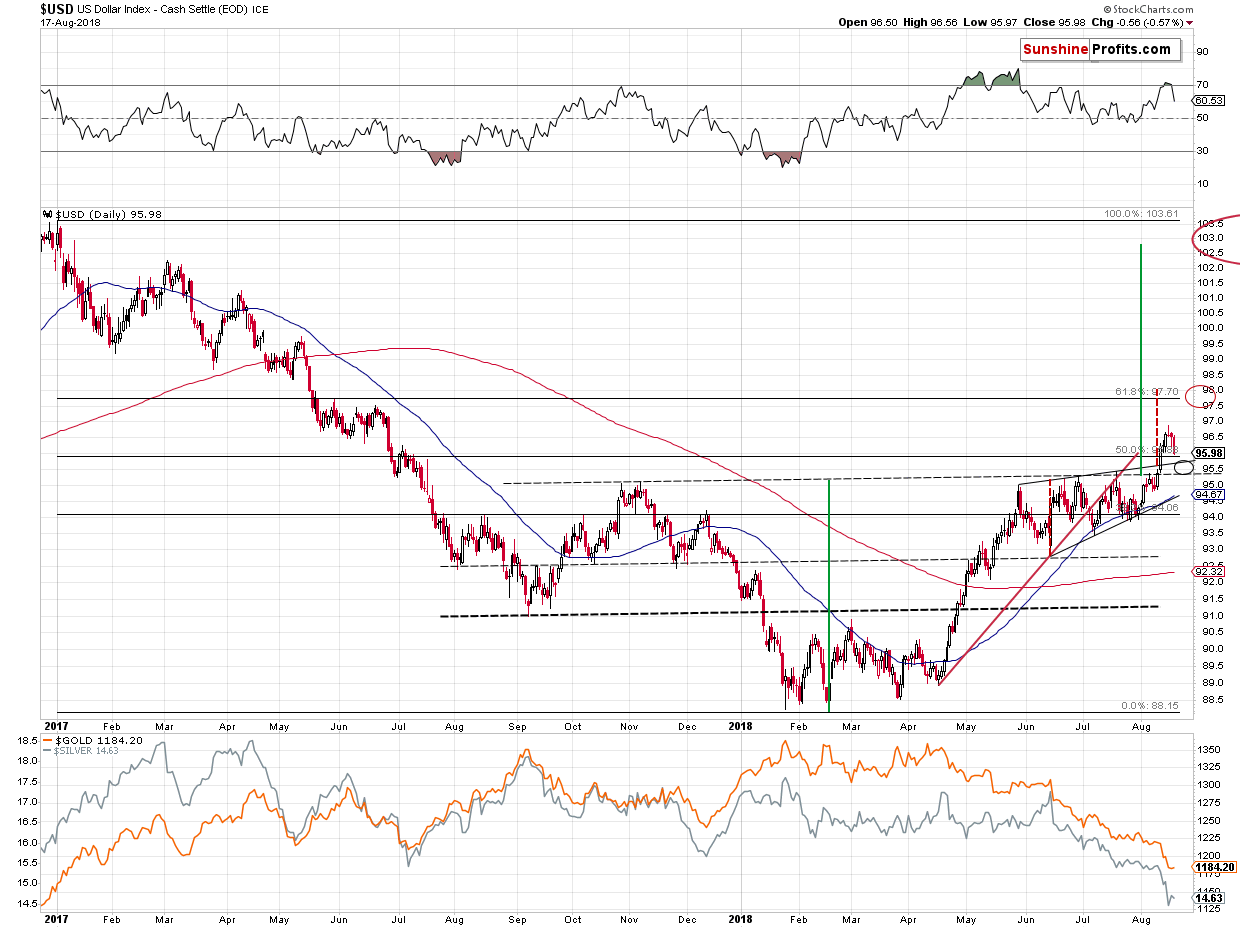
We may have indeed seen an important bearish indication based on the weekly price changes in the USD Index, but it has absolutely no implications for our trading positions in the precious metals sector. In fact, it barely changes the outlook for the USDX. The very short-term implications are bearish. But the above just isn’t the full truth. The full truth is that while we may see a move lower, it’s likely to be very small. Moreover, it’s something quite natural at this time.
The USD Index has recently broken above the rising wedge pattern and above the neck level of the reverse head-and-shoulders pattern. This means that one can expect the USDX to decline back to the previously broken levels and to verify them as support. And there will be nothing bearish about it.
These two levels create the near-term downside target area and is very close to where the USDX closed on Friday – between 95.4 and 95.7. Since the USDX just closed at about 96, the potential size of the downswing is between 0.3 and 0.6. In other words, the USDX is likely to at most repeat its Friday’s decline and perhaps it’s going to decline by only about half of its Friday’s decline.
Is this a substantial decline? No. Consequently, is it likely to trigger a substantial (!) rally in the precious metals or mining stocks? No.
To be clear, metals and miners are very oversold on a very short-term basis and are after a very volatile decline, so they could correct in a volatile manner as well, but even if this is the case, such a move would likely be very temporary and it might not be possible to trade this kind of a price swing, unless one is engaging in day-trading. The risk to reward ratio seems to favor sticking to the current short position even though we might have a temporary (probably 1-3 days at most) correction in profits.
What can we expect shortly if the USDX declines? Most likely the same thing we can expect for the U.S. currency. Something between a repeat of what we saw on Friday and half of that. Before assuming that in this case it’s a good idea to close the position and re-open it after seeing half of Friday’s move, please note that the possible (not imminent) move in the USDX could happen very quickly as both price targets are relatively close. It could just be a matter of hours or it could happen overnight. You could go to sleep with the USDX at 96 and you could wake up with it at 97 (and gold below $1,150) and already after an overnight drop to 95.5 or so. Is a chance of saving $5 - $10 on a trade in gold worth risking missing profits from a $60 - $135 decline? No, that’s not a good idea in our view. Consequently, we are not adjusting our positions in light of all the above. And in light of all that we wrote previously and what we’re about to write next today.
If you have just joined our service, be sure to read last Monday’s analysis with a list of long-term factors impacting the current move, and the analysis in which we discuss the short- and medium-term downside targets as well as the analysis in which we discuss the long-term upside potential of gold.
We already described the most important short-term development, but there are quite a few additional things that we would like to let you know about. Let’s move right to them.
Houston, We Have a Breakdown
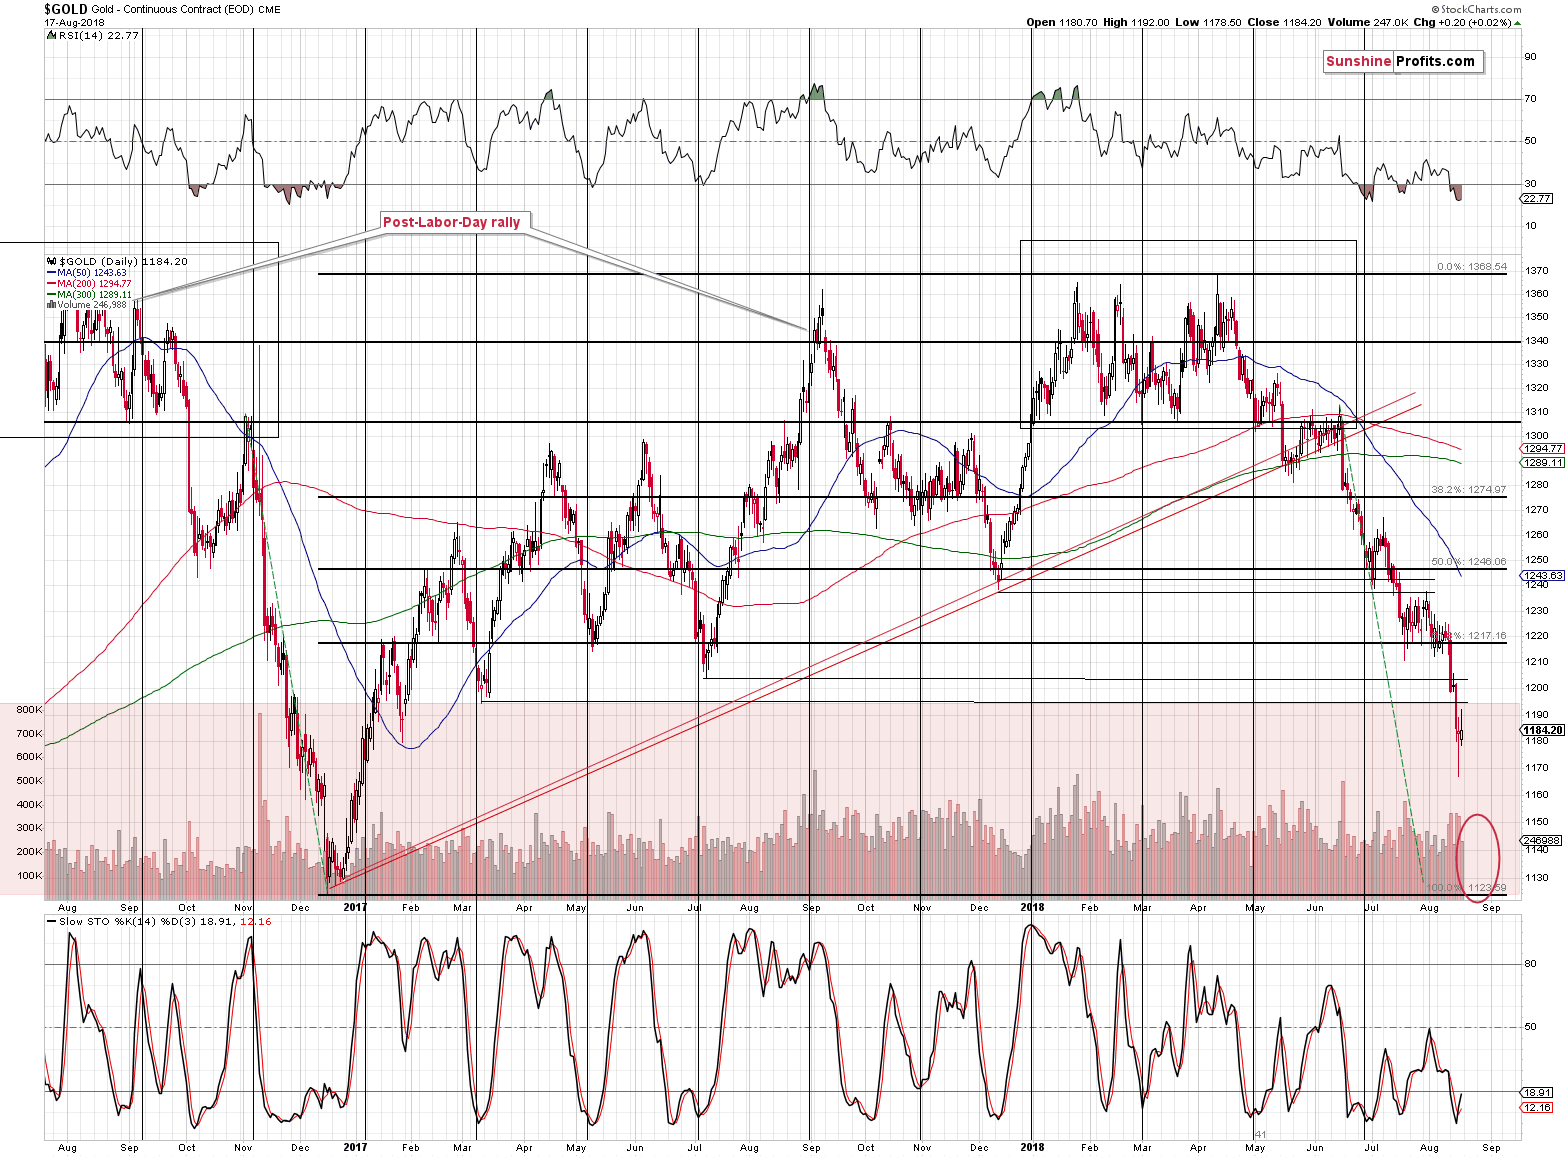
Gold has not only broken below the previous lows (including the late-January 2017 low in terms of the daily closing prices), but it also closed the week below them. The breakdowns below the previous lows appear to be confirmed. With gold in the red area that includes no significant support, and given the strong medium-term downtrend, we can definitely expect another wave down, even though the RSI is already very oversold.
Silver’s Breakdown, Rally, and Outlook
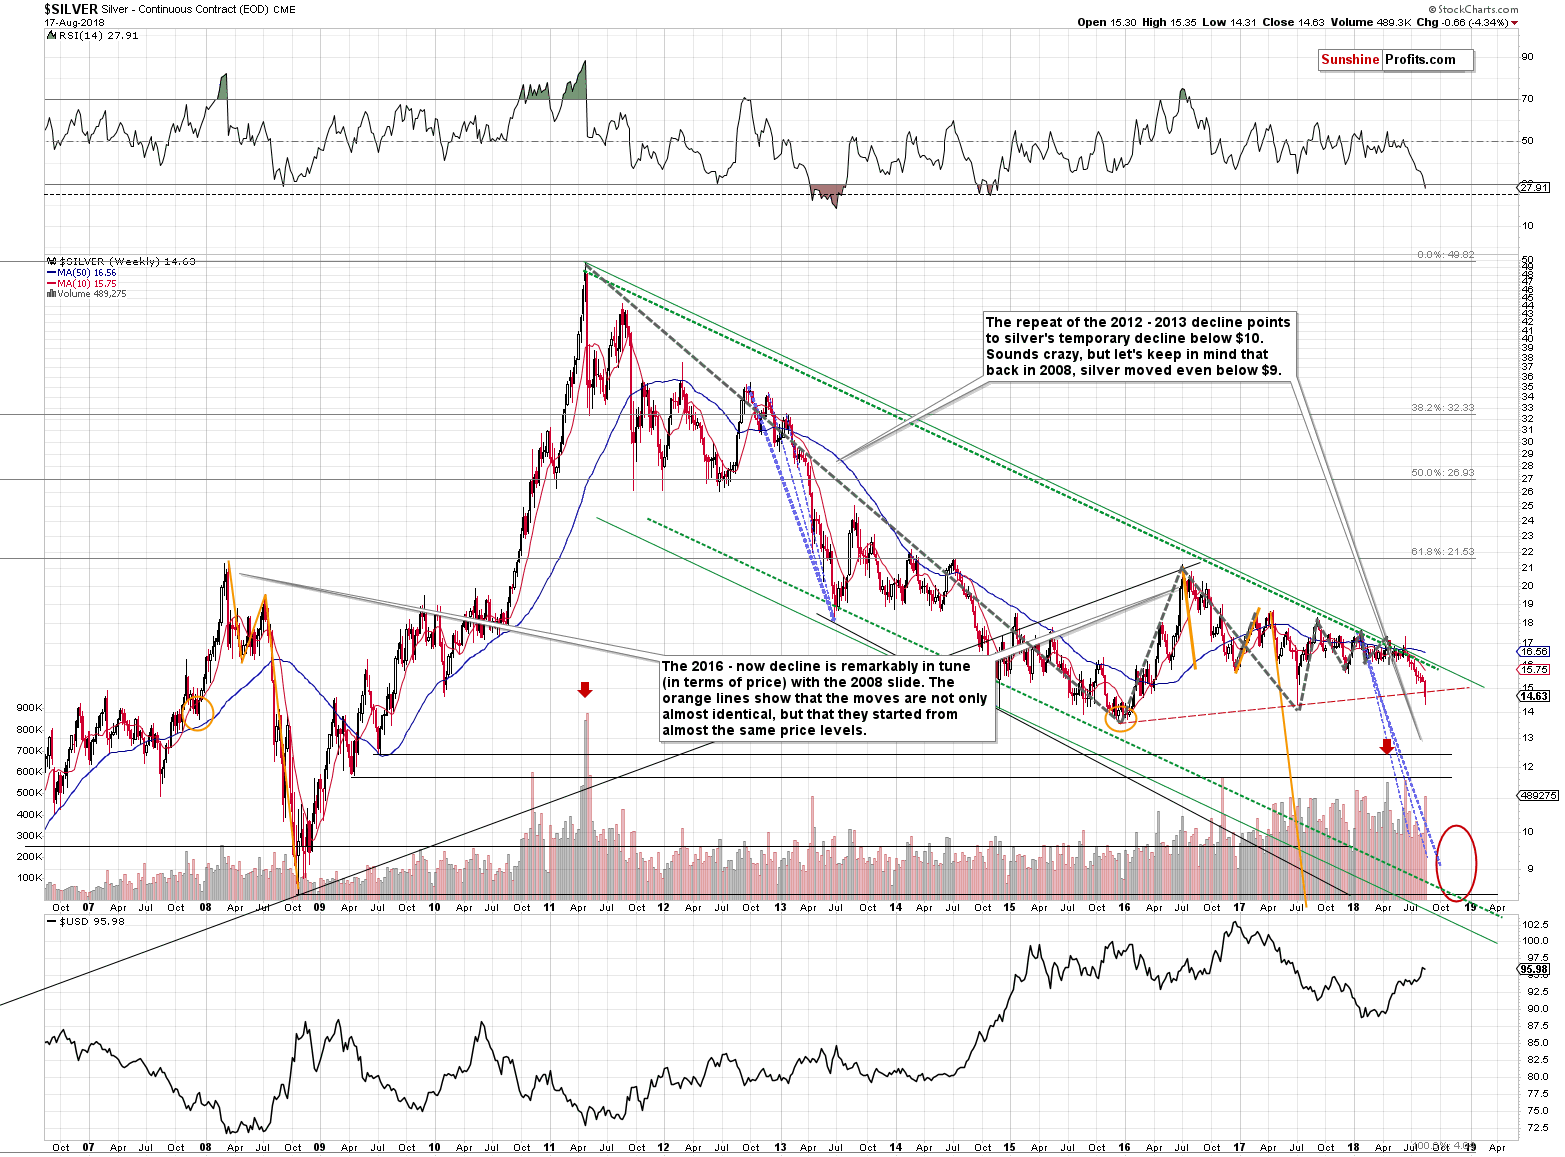
The white metal moved below the rising red support line and closed the week below it. It didn’t manage to immediately break below the July 2017 low, but that was not required for the outlook to remain bearish. The decline was and still is very bearish (just look how close silver is to its 2015 low), but no market can move up or down in a straight line. The July 2017 low was one of the levels that could have generated a pause – and it did. It wasn’t a sure bet and adjusting the positions wasn’t justified in our view, especially that the situation in the USD Index pointed to much higher USDX values with only a possibility of seeing lower values very briefly.
The RSI indicator based on the weekly prices is below 30, but it’s not yet at the levels that previously triggered rebounds in 2013. Consequently, we expect to see more weakness shortly. Perhaps not today, but most likely this week.
Mining Stocks’ Near-term Outlook
In the previous Alerts, we discussed the nearby targets for the HUI Index and we updated our calculations. Nothing really changed yesterday, so we won’t discuss the targets once again (the HUI is still likely to decline to 100 - 120). Instead, we are going to show you how easy it will be from the technical point of view for mining stocks to decline so far in the relatively short time frame.
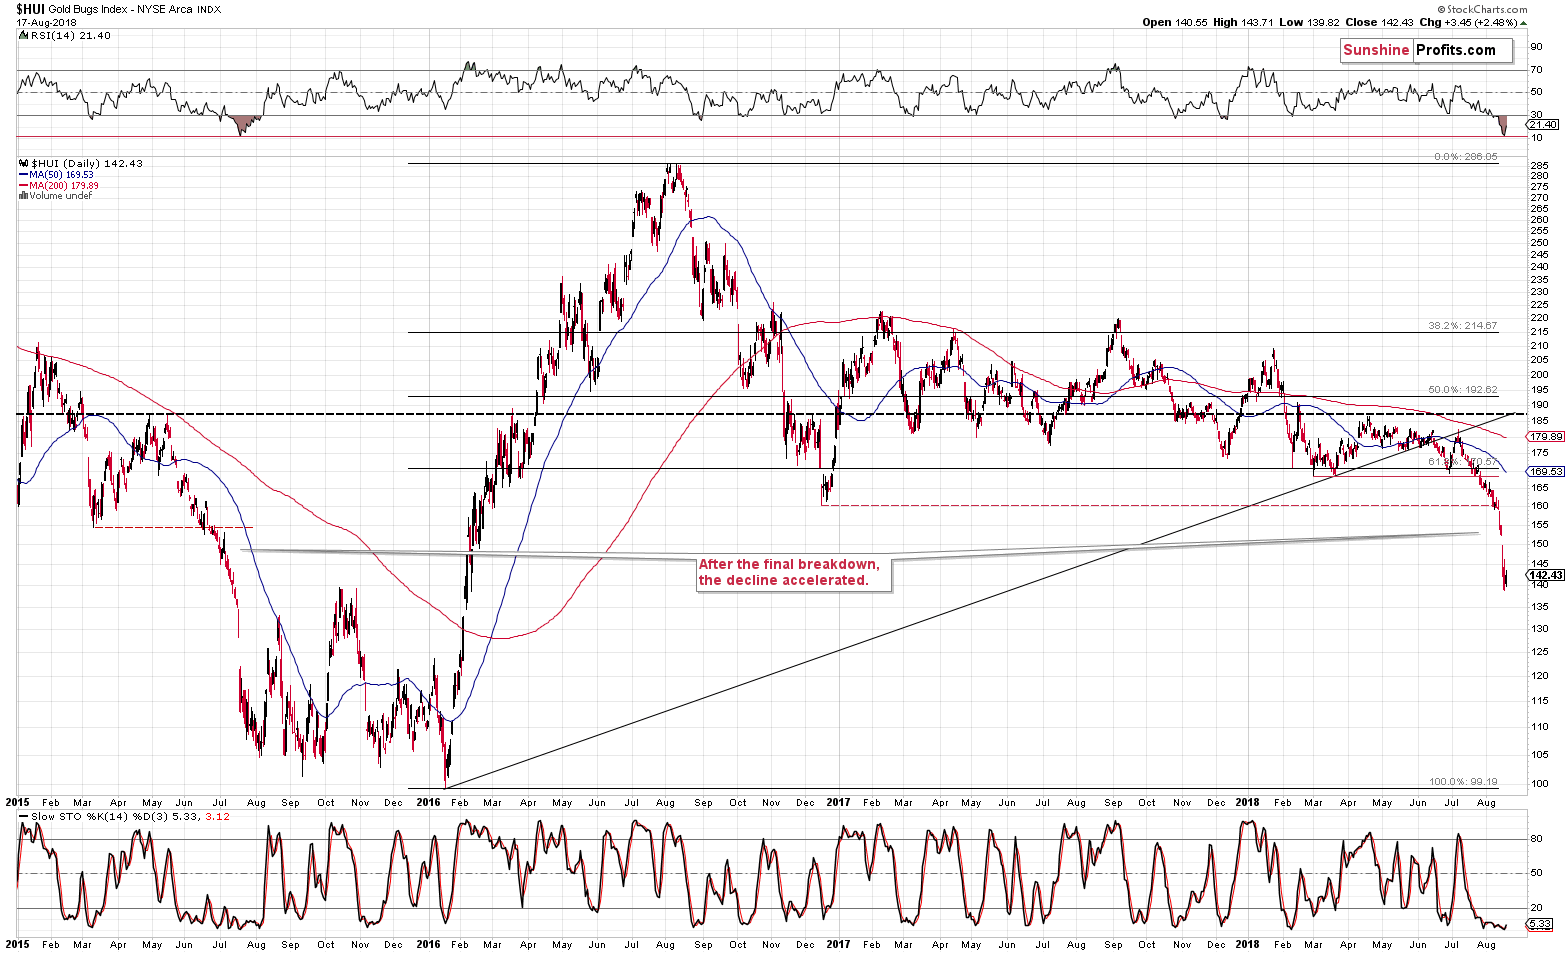
The direct analogy to the 2015 decline is the first reason. History repeats itself to a certain degree, so what happened previously at similar circumstances is likely to be repeated in a way. Back in 2015 the HUI Index decline sharply and substantially after breaking below its most recent low and it didn’t stop until it was very close to 100. Consequently, our previous comments on the above chart remain up-to-date:
The current decline is very similar to what we saw in 2015. They both started from similar index values, in both cases the HUI Index declined in a rather regular manner and in both cases this changed after the breakdown. The freefall followed in July 2015 and in August 2018. Back in 2015, the RSI moved to about 10, but it didn’t mean the end of the decline. It meant that the pace of decline slowed, but overall gold stocks kept on falling for another 2 weeks. Consequently, just because the RSI moved close to 10, it doesn’t mean that we’ll see a rally shortly, or that the upcoming bottom will be the final one. Conversely, we are likely to see lower mining stock values shortly.
The next reason is the proximity to the close support and resistance levels.
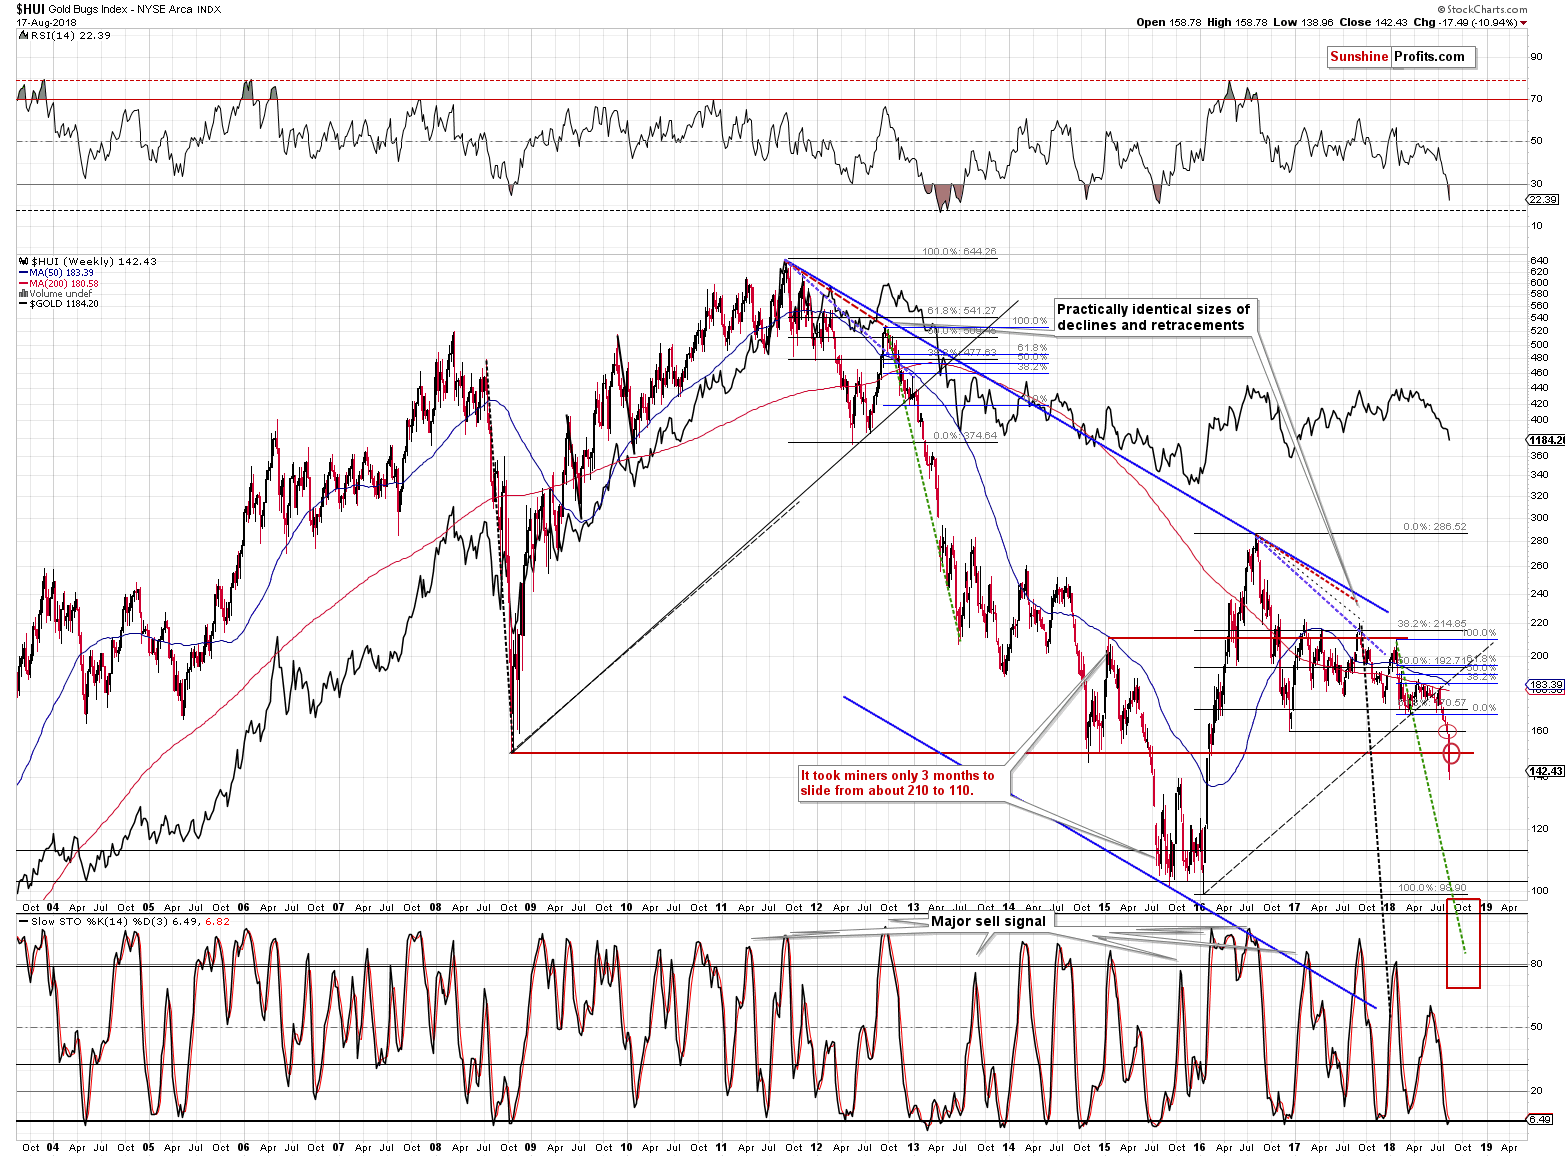
Gold stocks broke below all the nearby support levels and the next ones that we have are the 2015 lows. To be precise, the October 2015 highs also provide support, but it’s not very strong – it didn’t trigger any kind of rebound during the 2016 rally.
The important thing is that with the exception of October 2015, we haven’t recently (in the past 15 years) seen any rebound within the 143 – 110 area. This means that between these price levels investors have been simply following the trend. History tends to repeat itself, so we are likely to see a powerful slide shortly.
Please note that the support-less area in the HUI Index may be analogous to the one in the price of gold. Gold sliding to $1,120 - $1,130 could correspond to the HUI Index reaching the 110 level or so.
Gold Stock Ratios
Another important thing is the situation in the HUI’s ratios to gold and the general stock market.
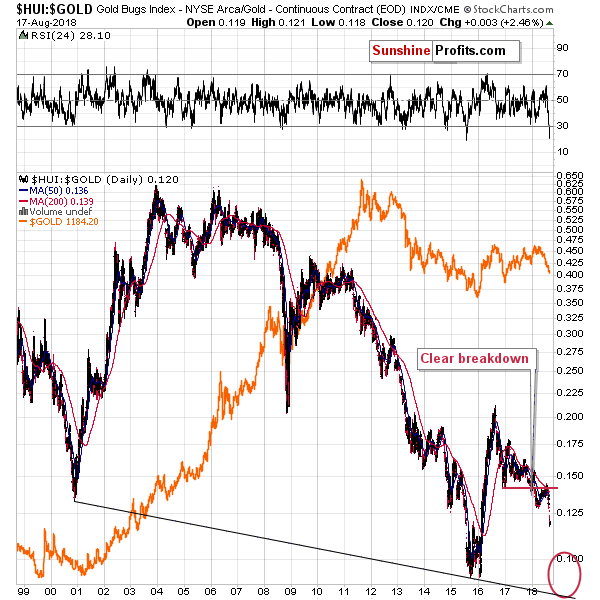
For many months we have been emphasizing that there is nothing really bullish about the early 2018 rally in the precious metals sector and in the gold stocks to gold ratio. In the case of the latter it was just a verification of the previous breakdown below the important 2016 bottom. The breakdown was indeed verified by a move back to the previously broken level and the big medium-term decline continued shortly thereafter. What we are seeing now is a natural result of the above.
Just like it is the case with the HUI Index, its ratio is also below the key nearby support levels and the nearest strong support is at the 2015 lows. This makes the implications for the short and medium term very bearish.
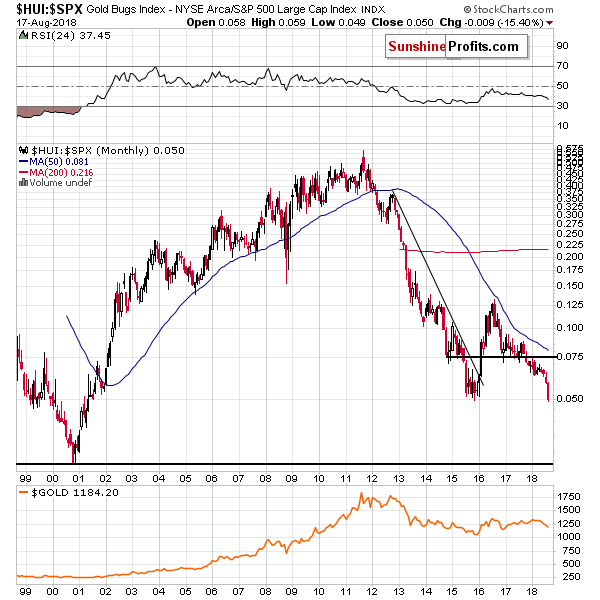
We can say the same thing about the HUI to S&P 500 ratio, which shows how well gold stocks performed against other stocks. The next and practically only reasonable support below the current ratio level is at the 2,000 low.
But why would the ratio decline at all? Isn’t it bottoming right now at the 2015 lows?
No, it’s breaking below them.
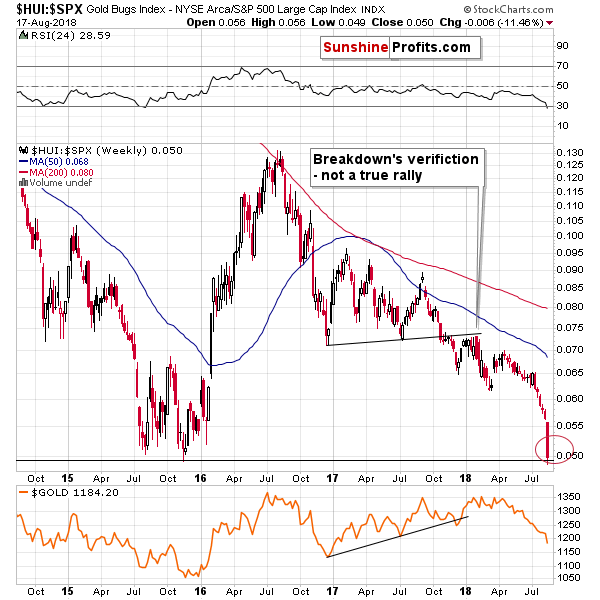
We have just seen a weekly close below the lowest weekly close of 2015, which is an important breakdown. This move is not yet confirmed, but it’s definitely present. Consequently, the implications of the ratio and its current position relative to the 2015 lows are bearish, not bullish.
Summary
Summing up, there are multiple very meaningful reasons due to which the precious metals sector is likely to move lower in the following weeks and months and last week’s declines show that the huge slide is clearly underway. In other words, it seems that our sizable profits on the short positions are going to become even bigger shortly. We may have a local bottom later this month, though, and we’ll keep you informed regarding the possibility of seeing a bigger turnaround. We might have seen a very short-term bottom right now, but the rally, the tradable bottom is likely to take place when the USD Index reaches an important upside target and the nearest such target is at about 98. The possible downside for the USDX is just 0.3 – 0.6 below Friday’s closing price, which doesn’t seem enough for one to adjust their trading position unless they are day-trading.
At the same time, it’s important to keep the very long-term picture in mind. We have recently published our report on gold’s long-term upside targets and if you haven’t read it so far, we suggest that you do so today. You can read more about our long-term upside target for gold here.
As always, we’ll keep you – our subscribers – informed.
To summarize:
Trading capital (supplementary part of the portfolio; our opinion): Full short positions (250% of the full position) in gold, silver and mining stocks are justified from the risk/reward perspective with the following stop-loss orders and exit profit-take price levels:
- Gold: profit-take exit price: $1,062; stop-loss: $1,221; initial target price for the DGLD ETN: $82.96; stop-loss for the DGLD ETN $54.27
- Silver: profit-take exit price: $12.72; stop-loss: $15.56; initial target price for the DSLV ETN: $46.97; stop-loss for the DSLV ETN $28.87
- Mining stocks (price levels for the GDX ETF): profit-take exit price: $13.12; stop-loss: $20.81; initial target price for the DUST ETF: $80.97; stop-loss for the DUST ETF $30.87
Note: the above is a specific preparation for a possible sudden price drop, it does not reflect the most likely outcome. You will find more detailed explanation in our August 1 Alert. In case one wants to bet on junior mining stocks’ prices (we do not suggest doing so – we think senior mining stocks are more predictable in the case of short-term trades – if one wants to do it anyway, we provide the details), here are the stop-loss details and target prices:
- GDXJ ETF: profit-take exit price: $17.52; stop-loss: $30.72
- JDST ETF: initial target price: $154.97 stop-loss: $62.78
Long-term capital (core part of the portfolio; our opinion): No positions (in other words: cash)
Insurance capital (core part of the portfolio; our opinion): Full position
Important Details for New Subscribers
Whether you already subscribed or not, we encourage you to find out how to make the most of our alerts and read our replies to the most common alert-and-gold-trading-related-questions.
Please note that the in the trading section we describe the situation for the day that the alert is posted. In other words, it we are writing about a speculative position, it means that it is up-to-date on the day it was posted. We are also featuring the initial target prices, so that you can decide whether keeping a position on a given day is something that is in tune with your approach (some moves are too small for medium-term traders and some might appear too big for day-traders).
Plus, you might want to read why our stop-loss orders are usually relatively far from the current price.
Please note that a full position doesn’t mean using all of the capital for a given trade. You will find details on our thoughts on gold portfolio structuring in the Key Insights section on our website.
As a reminder – “initial target price” means exactly that – an “initial” one, it’s not a price level at which we suggest closing positions. If this becomes the case (like it did in the previous trade) we will refer to these levels as levels of exit orders (exactly as we’ve done previously). Stop-loss levels, however, are naturally not “initial”, but something that, in our opinion, might be entered as an order.
Since it is impossible to synchronize target prices and stop-loss levels for all the ETFs and ETNs with the main markets that we provide these levels for (gold, silver and mining stocks – the GDX ETF), the stop-loss levels and target prices for other ETNs and ETF (among other: UGLD, DGLD, USLV, DSLV, NUGT, DUST, JNUG, JDST) are provided as supplementary, and not as “final”. This means that if a stop-loss or a target level is reached for any of the “additional instruments” (DGLD for instance), but not for the “main instrument” (gold in this case), we will view positions in both gold and DGLD as still open and the stop-loss for DGLD would have to be moved lower. On the other hand, if gold moves to a stop-loss level but DGLD doesn’t, then we will view both positions (in gold and DGLD) as closed. In other words, since it’s not possible to be 100% certain that each related instrument moves to a given level when the underlying instrument does, we can’t provide levels that would be binding. The levels that we do provide are our best estimate of the levels that will correspond to the levels in the underlying assets, but it will be the underlying assets that one will need to focus on regarding the signs pointing to closing a given position or keeping it open. We might adjust the levels in the “additional instruments” without adjusting the levels in the “main instruments”, which will simply mean that we have improved our estimation of these levels, not that we changed our outlook on the markets. We are already working on a tool that would update these levels on a daily basis for the most popular ETFs, ETNs and individual mining stocks.
Our preferred ways to invest in and to trade gold along with the reasoning can be found in the how to buy gold section. Additionally, our preferred ETFs and ETNs can be found in our Gold & Silver ETF Ranking.
As a reminder, Gold & Silver Trading Alerts are posted before or on each trading day (we usually post them before the opening bell, but we don't promise doing that each day). If there's anything urgent, we will send you an additional small alert before posting the main one.
=====
Latest Free Trading Alerts:
Stocks were little changed on Friday, as investors hesitated following Wednesday-Thursday's S&P 500's advance off support level of 2,800. Will the S&P 500 index continue towards its late January's record high? Or is this just an upward correction before another leg down?
Stocks Get Closer to January's Record High, What's Next?
=====
Hand-picked precious-metals-related links:
PRECIOUS-Gold inches higher as U.S.-China trade optimism pressures dollar
Hedge Funds Turned Record Short on Metals Just Before the Rout
Safe Havens, U.S. Rates and Physical Demand: Gold Myths Busted
Being ‘Used To Bad News’ Is Keeping Gold Down — Perth Mint
=====
In other news:
Shares climb on hopes for U.S.-China trade talks, Turkish lira falls
Big Questions on Global Economy Hang Over Jackson Hole Gathering
Greece emerges from eurozone bailout after years of austerity
=====
Thank you.
Sincerely,
Przemyslaw Radomski, CFA
Founder, Editor-in-chief, Gold & Silver Fund Manager
Gold & Silver Trading Alerts
Forex Trading Alerts
Oil Investment Updates
Oil Trading Alerts

