

Briefly: In our opinion, full (200% of the regular size of the position) speculative short positions in gold, silver and mining stocks are justified from the risk/reward perspective at the moment of publishing this alert.
Saying that yesterday silver moved higher outperforming gold is like saying that completing a triathlon makes one tired. It’s not a lie, but it doesn’t convey the entire truth either. The white metal soared in a spectacular way yesterday and what’s even more impressive than the rally itself, is that the rally relative to gold and mining stocks was even more profound. It’s usually the case that the entire precious metals market moves higher together, but yesterday’s action was all about silver. What’s next?
Let’s jump right into charts (chart courtesy of http://stockcharts.com).
Silver’s Outperformance
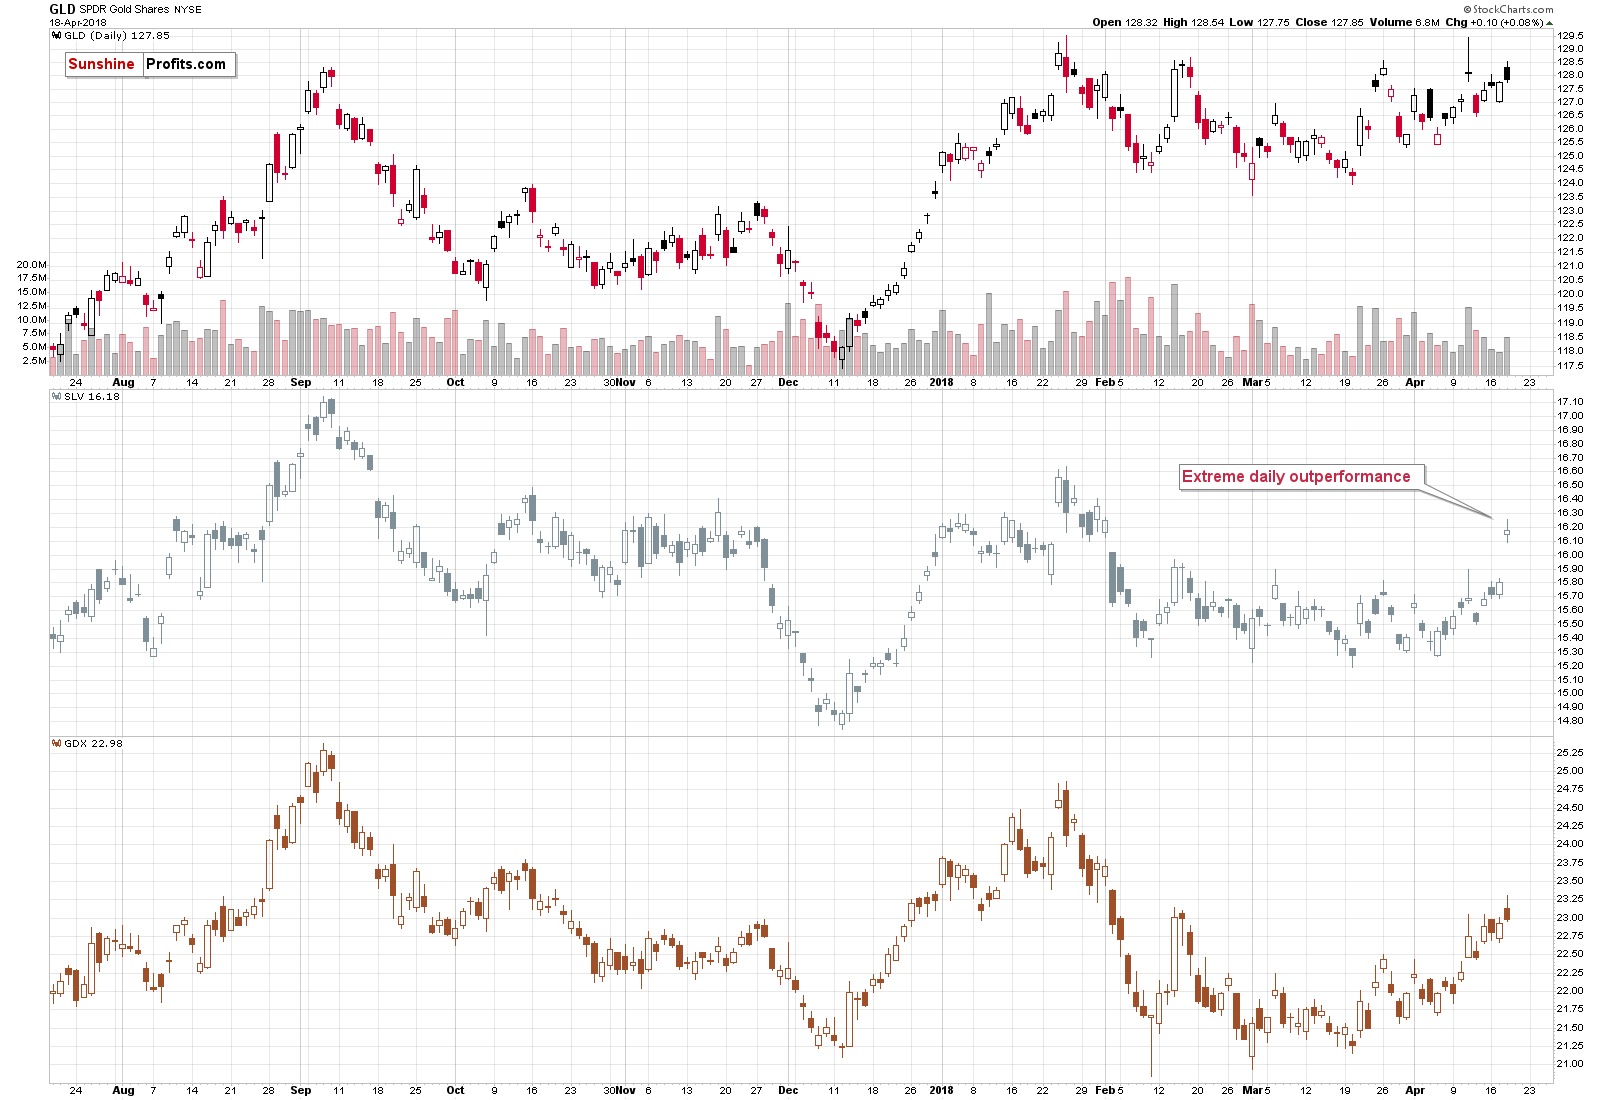
It’s clear at the first sight that the price of silver outperformed gold to a huge extent. It wasn’t driven by higher stock prices or rising gold. Mining stocks rallied only initially and they reversed the upswing before the end of the session. Silver truly outperformed. We emphasized it numerous times and we’ll say it once again – whenever silver outperforms on a very short-term basis, it’s a very bearish sign for the following days and weeks. Not necessarily for the single session that immediately follows, though, as some buy orders that were placed after hours could still be realized on the following day and this could attract additional momentum buyers.
Still, that’s the kind of performance that is a very bearish sign that should make one at least consider opening short positions in the precious metals sector, not closing them or opening long ones.
The most short-term cases when the above signal worked are not visible in the ratios as the latter are based on daily closing prices and the intraday extremes are not factored in properly. Precisely, using candlesticks will provide us with intraday highs, but if the highs formed at different times of the day, they will not be comparable.
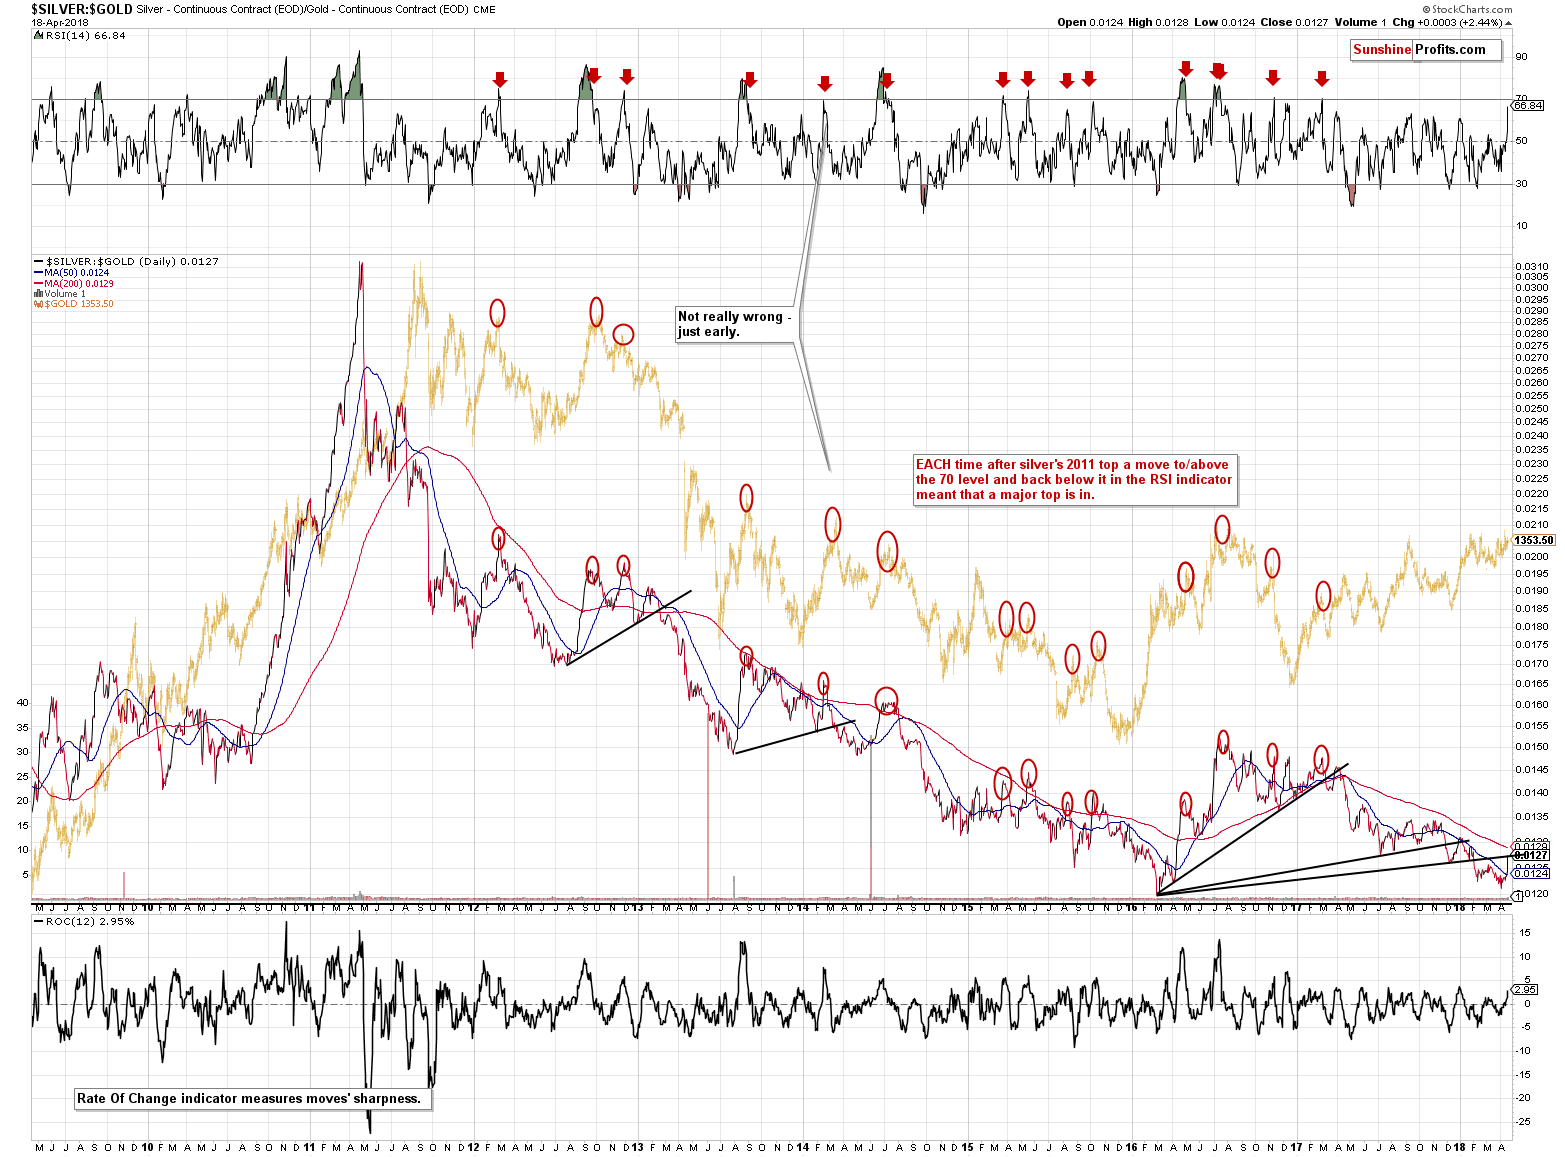
The silver to gold ratio shows that the ratio moved back to the rising black resistance line which it broke earlier this year. That’s the third time that that we’ve seen something like that in the recent history. Each breakdown below the rising black line was followed by a correction back to this line. Then the ratio moved lower once again.
That’s not the most important thing about the silver to gold ratio, though. The most important thing is that the RSI based on it moved very close to the 70 level and whenever the RSI gets above it and then declines, we see a major decline in the precious metals sector. To be clear, there are no certainties in any market, but please look at the areas marked on the above chart for details.
Now, the RSI is only at 66.84, not above 70, but let’s keep in mind that there were cases when the RSI didn’t move to 70 and we saw tops in its proximity. For instance, the early 2013 top and the late 2015 top.
This means that the precious metals sector could slide right away, but if silver outperforms just a bit more today (taking RSI above 70) and then declines in the following days, we’ll have a major and extremely effective confirmation that the final top is in.
Silver Pattern Update
We recently wrote about two patterns in silver, so you might be wondering if they still hold in light of yesterday’s price jump.
Let’s start with the long-term pattern.
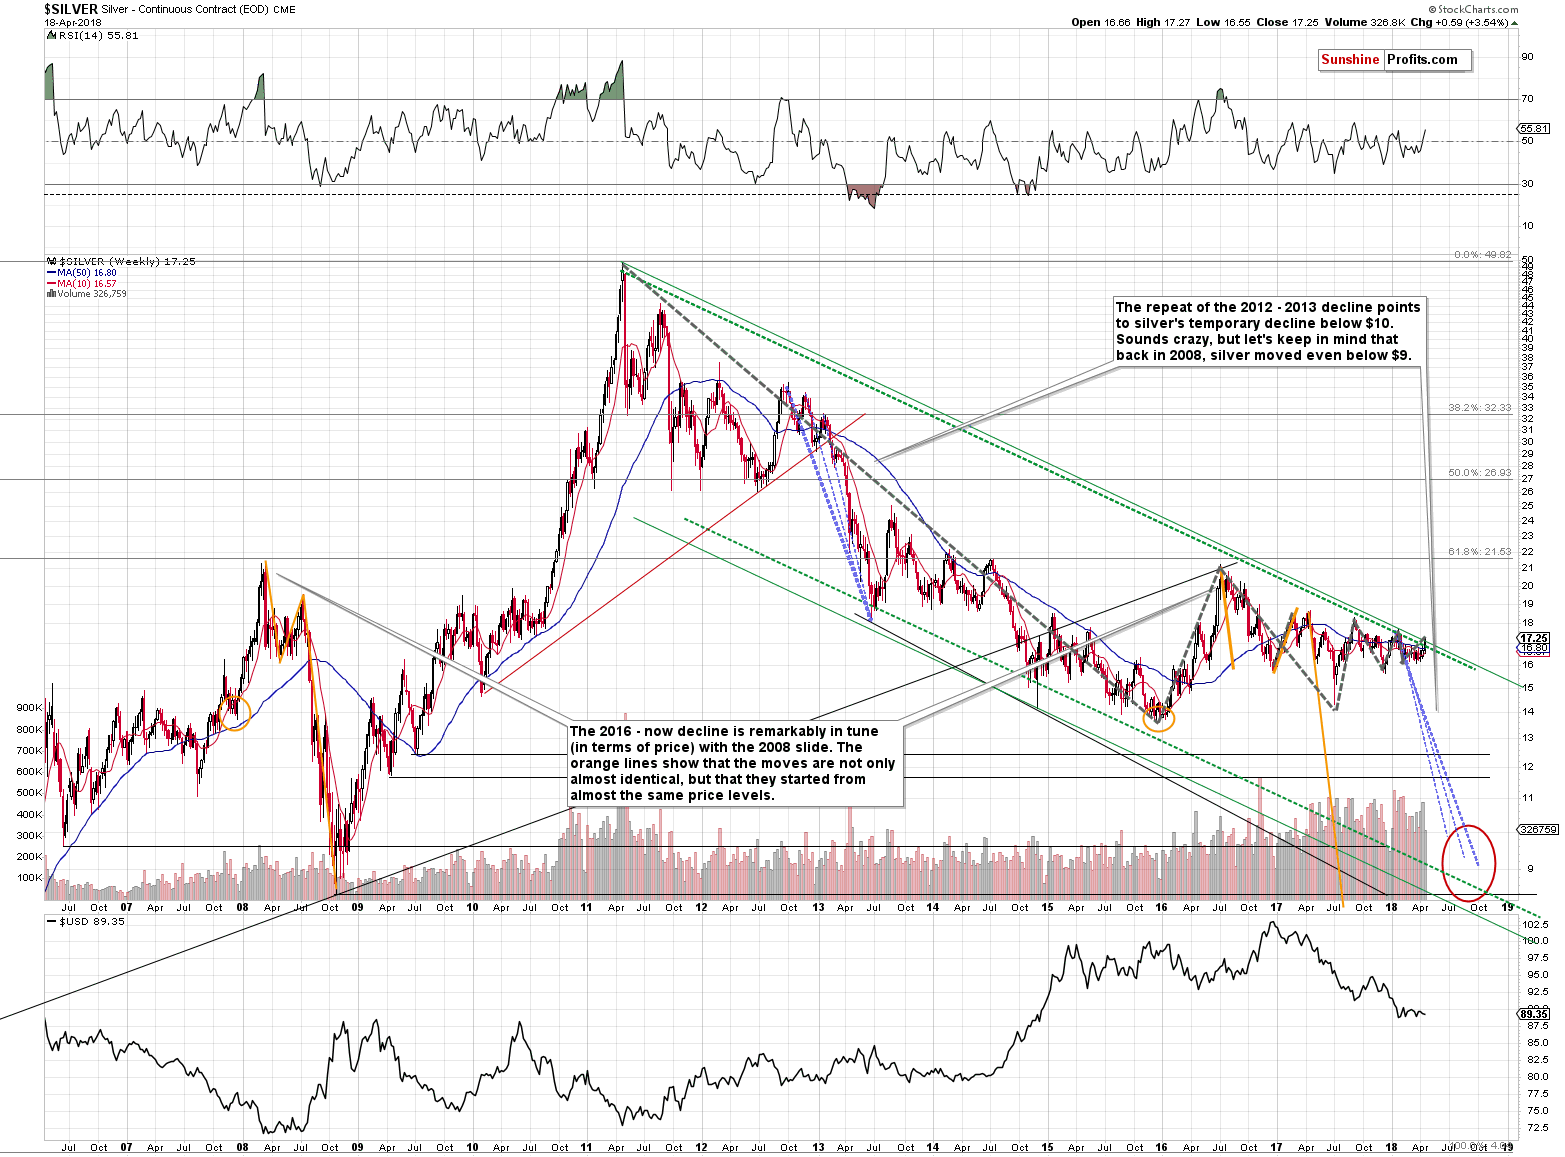
The long-term pattern that we described several days ago is silver’s tendency to move in short-term trends that are getting smaller. In other words, it moves like an oscillator.
Yesterday’s upswing didn’t change anything because even if we take the rally into account, the current short-term upswing is smaller than the preceding downswing. This means that once the new short-term move in silver (likely a decline) becomes bigger than the preceding one, we’ll have a true breakout from the oscillating pattern. Since the periods of lower volatility (it certainly declines since the moves are getting smaller) are often followed by periods of big volatility, we can expect the next downswing to be very significant.
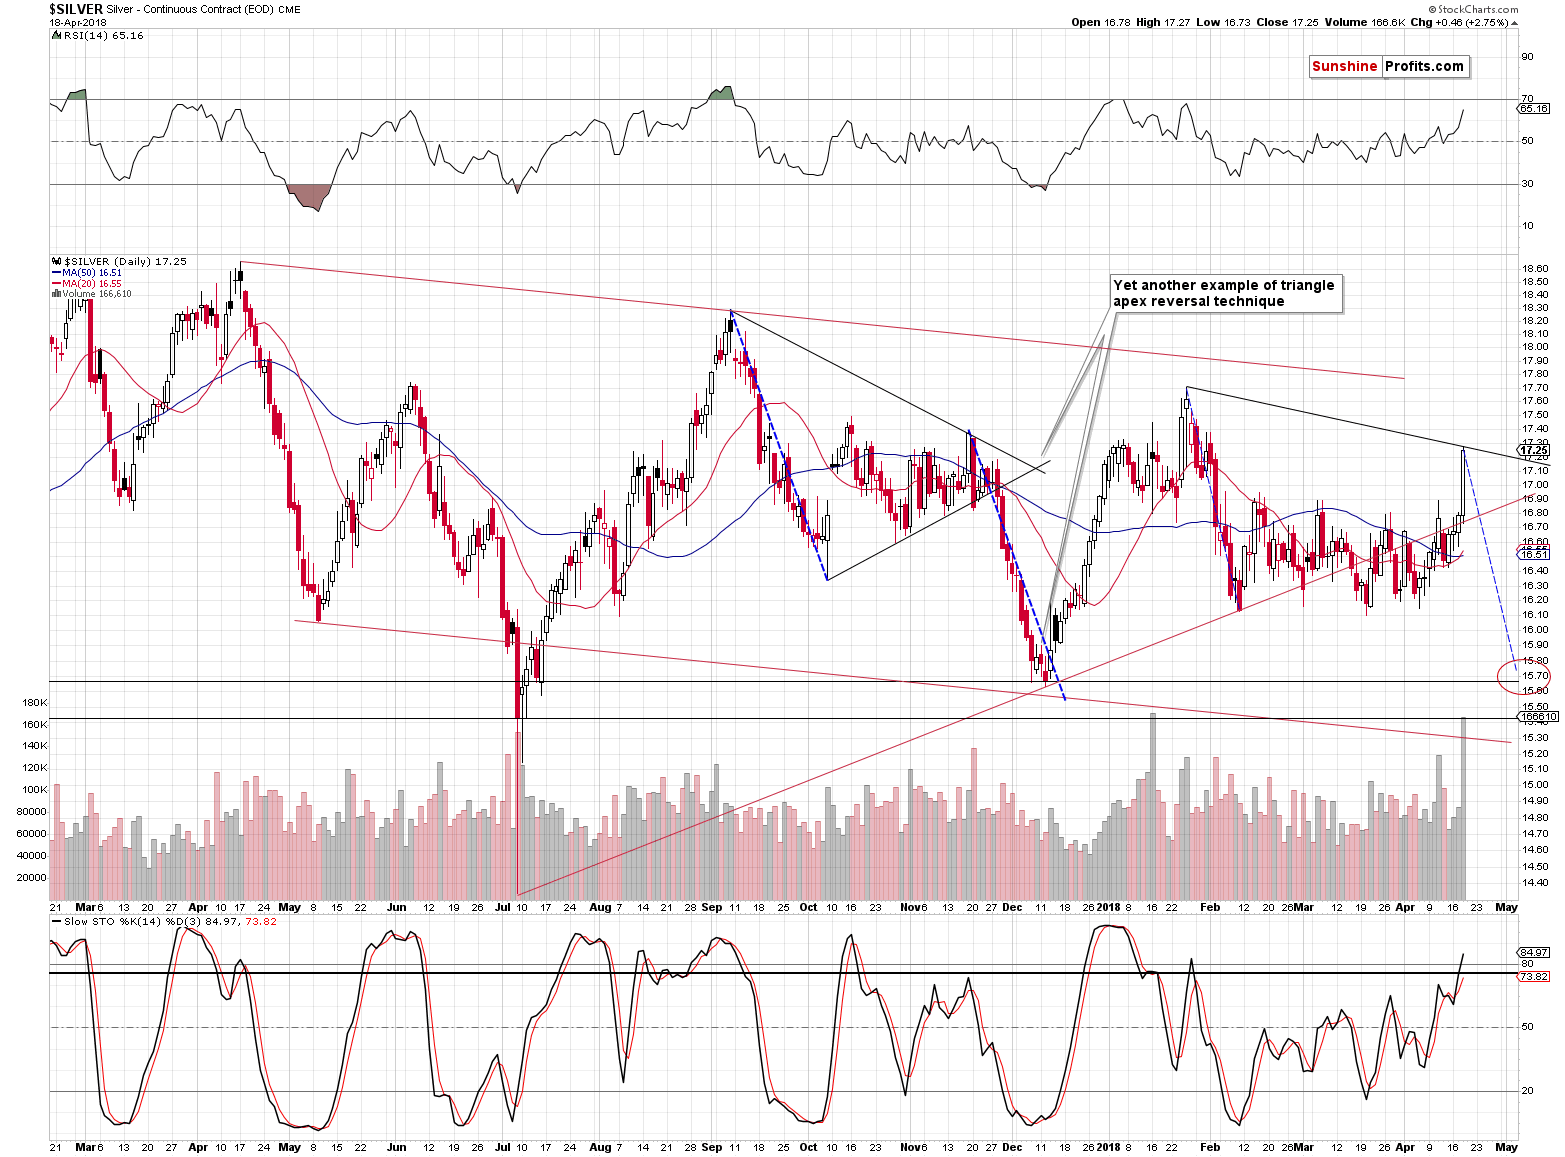
The silver chart shows that the self-similar pattern that we discussed previously is no longer very similar. In a way, the way silver moved between September and November 2017 still resembles the way silver has been moving since late January 2018, but yesterday’s rally was significantly higher than the rally that we saw in November, so it’s no longer very likely that the same action will follow.
Then again, regardless of the self-similar pattern, the next downswing is likely to be as big and as fast as the previous decline at least approximately, because that’s how silver often performs in general (the same goes for the mining stocks, by the way).
The thing that changed based on yesterday’s rally is the existence of the apex-based reversal in the near future. The most recent reversal is no longer the key top that we can use to create triangles and thus there is no apex of the triangle nearby. Consequently, the silver market is still likely to decline soon in a profound way, but not based on the above technique.
The volume in silver was huge and the one in the SLV ETF confirms it. This suggests two things. One is that the white metal might have been bought en masse by the investment public, and the second is that there might have been major shifts in the futures contracts’ ownership. Both could indicate a major turnaround.
Gold’s and Gold Stocks’ Reversals
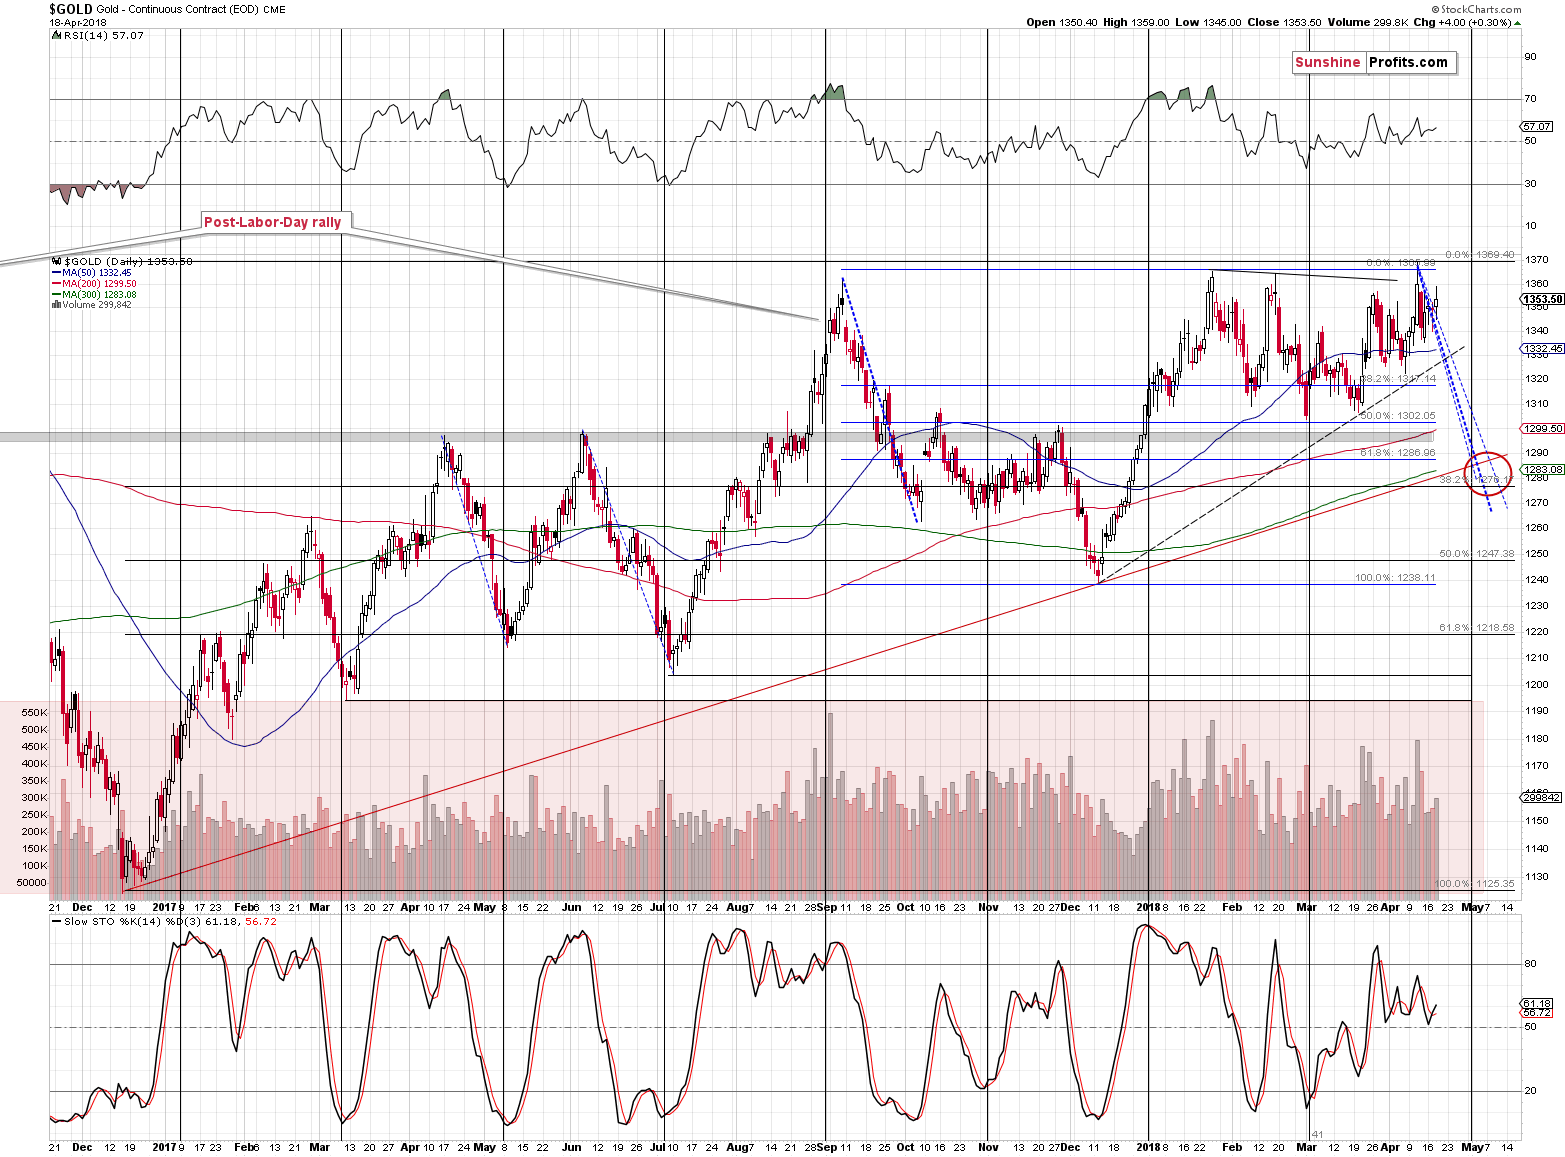
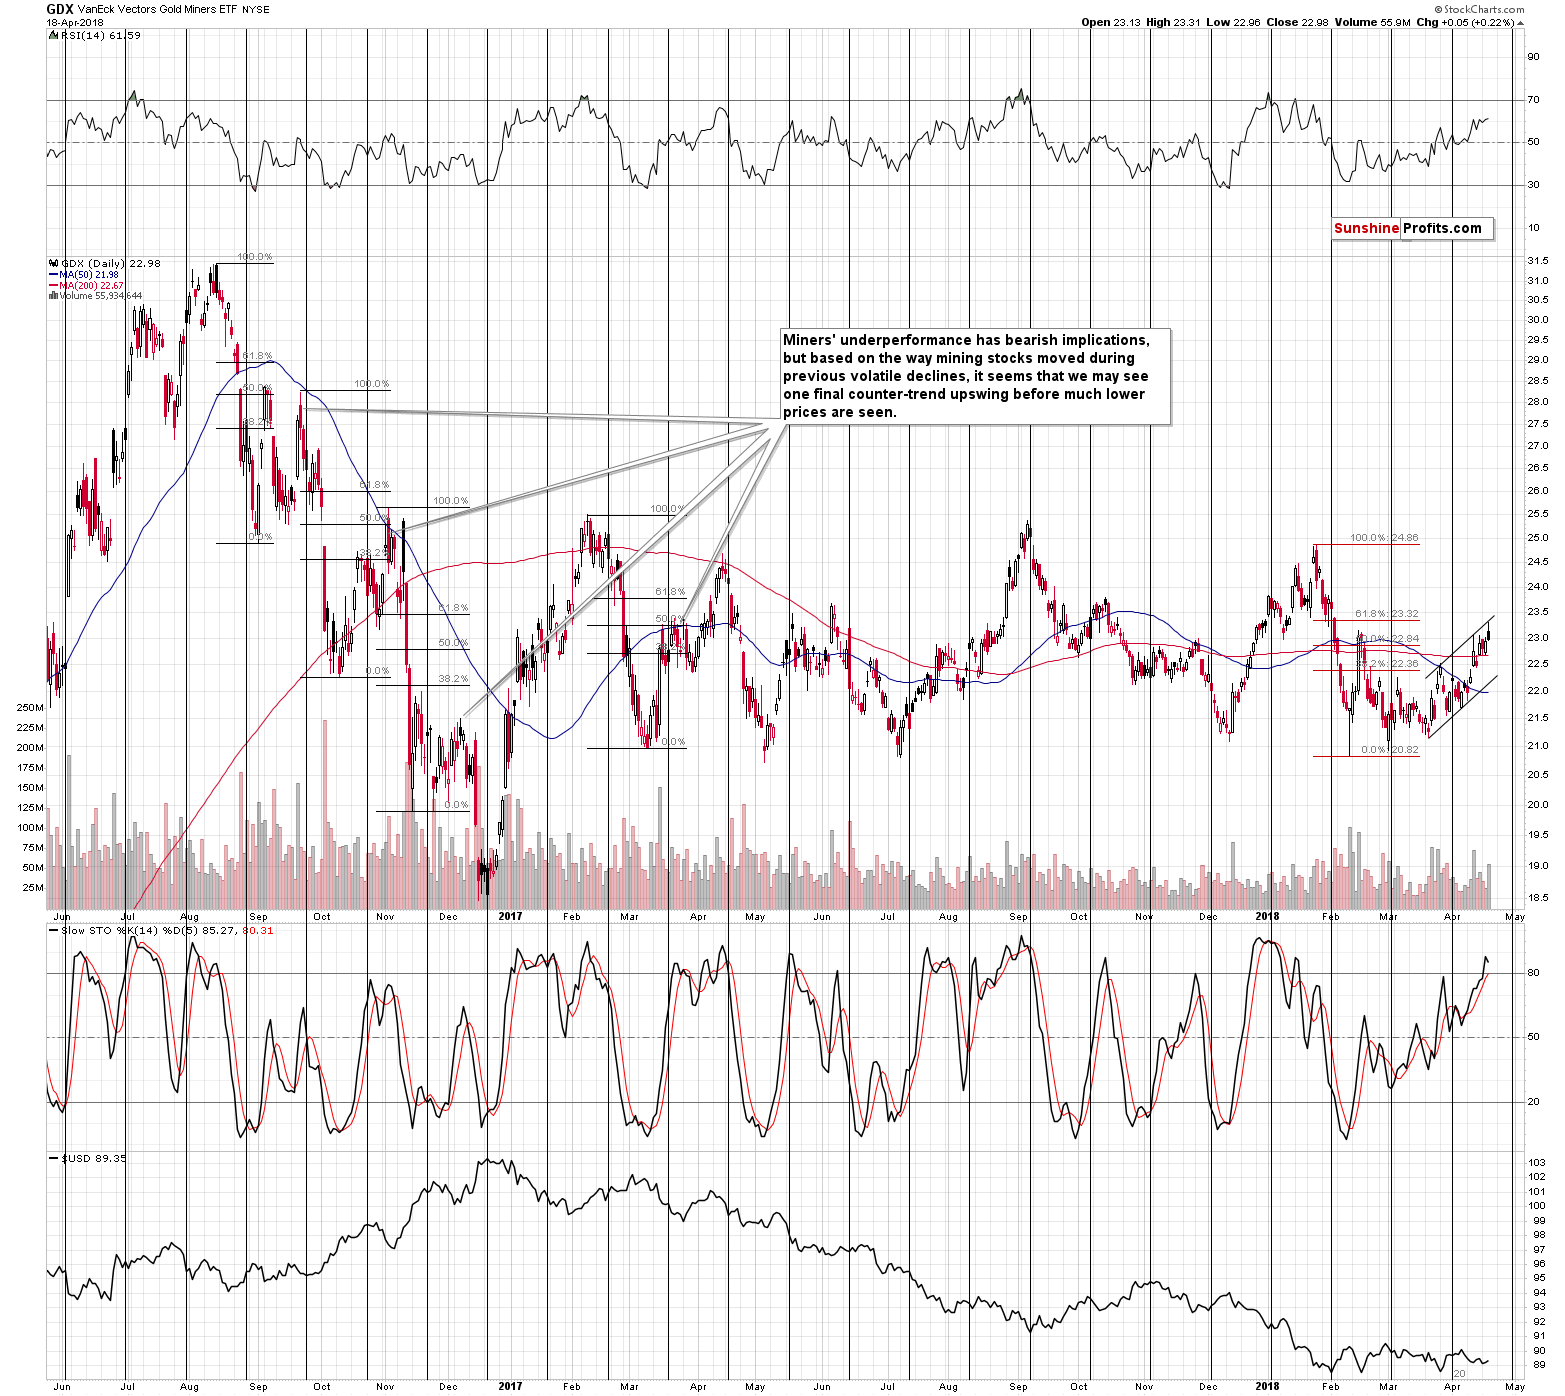
Meanwhile, gold and mining stocks moved higher only initially and gave up their gains before the end of the session. The session seems particularly meaningful in the case of the GDX ETF, which reversed on significant volume after touching the upper border of the rising trend channel.
Big volume confirms reversals and the one in the GDX is particularly bearish as it was at the same time a failed attempt to break above the mid-February high. The implications of invalidations of breakouts have immediate bearish implications and this is currently the case with the GDX ETF.
While most precious metals traders were busy watching silver, they might have missed something just as important – the reversal in the USD Index. Let’s take a closer look at the situation in the forex market.
Forex: Reversal and Upcoming Breakdown
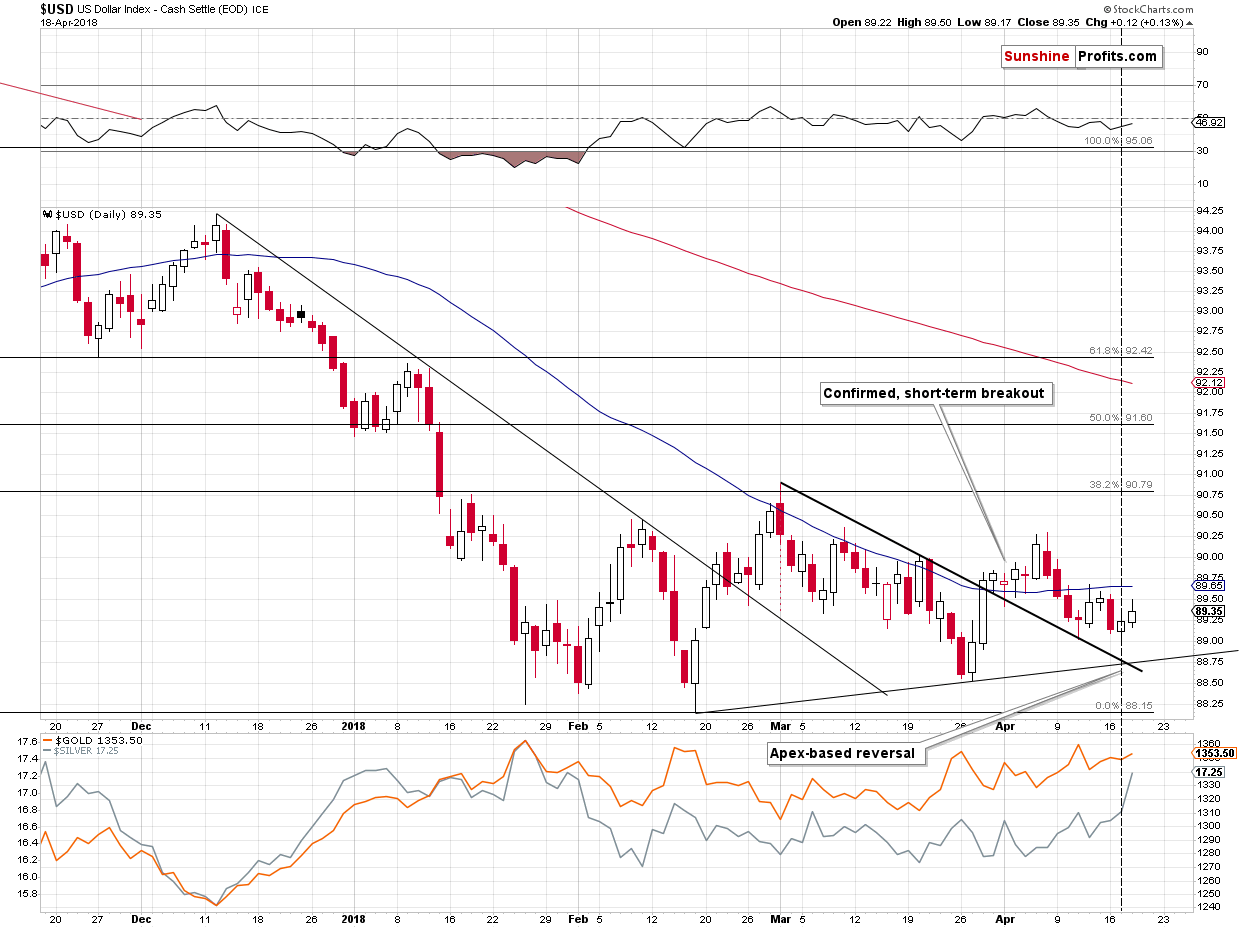
In yesterday’s alert, we wrote that the USD Index was likely to reverse based on the apex of the triangle that we marked with black lines.
It seems that we indeed saw a reversal as the USD moved higher both on Tuesday and yesterday.
This has profound implications for the following weeks and months.
Weeks, because a bigger rally in the USD Index is likely to translate into at least a visible decline in the EUR/USD.
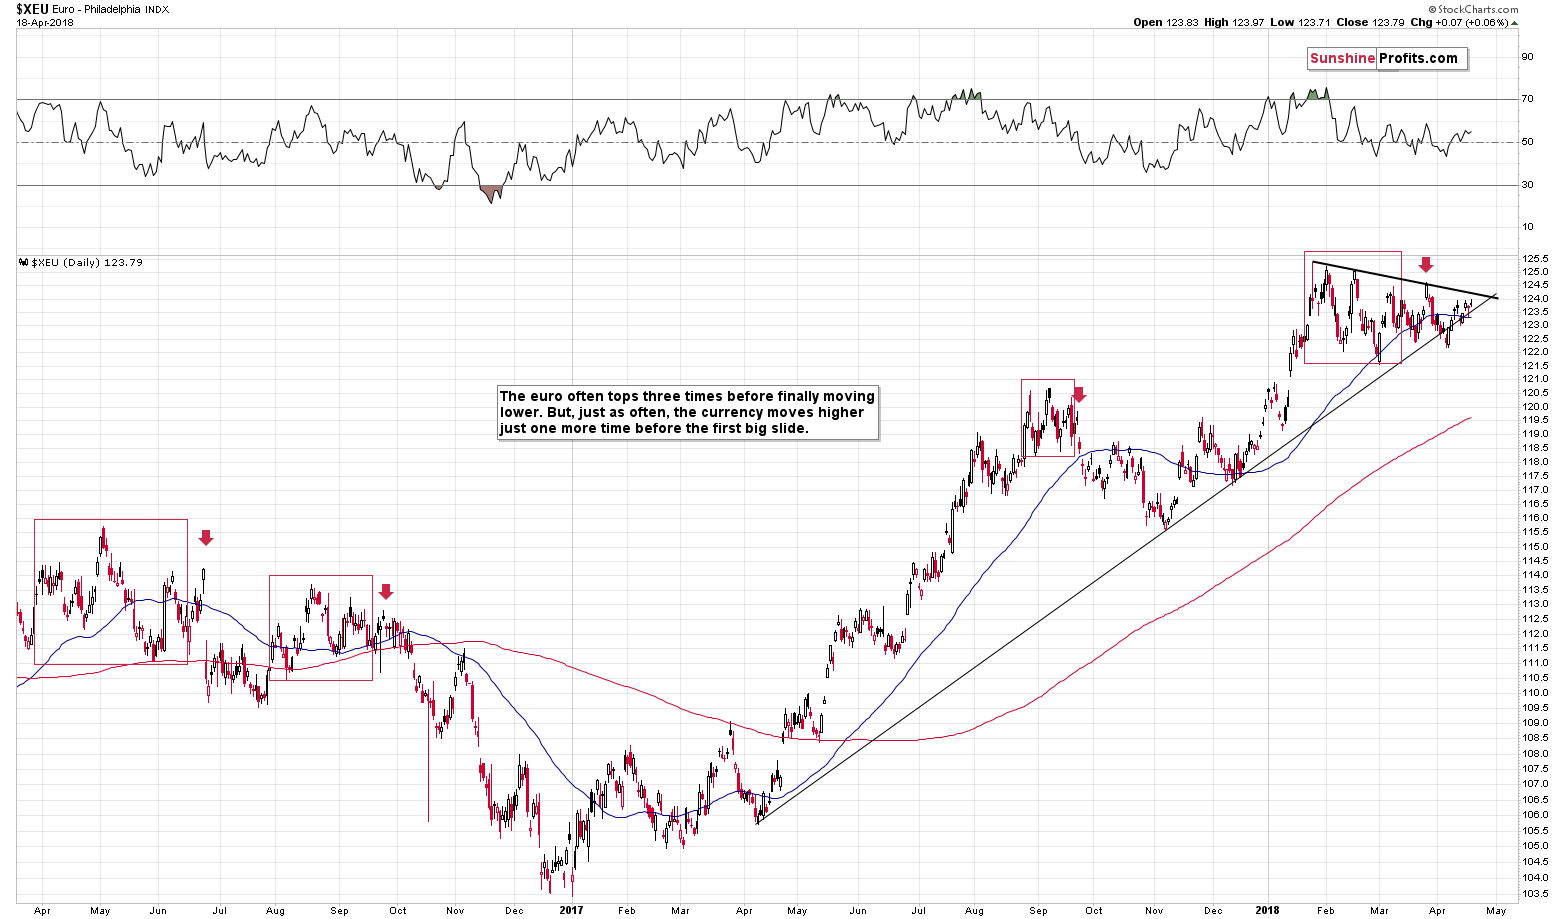
The situation on the EUR/USD chart didn’t change significantly yesterday, so our yesterday’s comments remain up-to-date:
That’s important, because the euro is on the verge of a breakdown. Looking at the above chart alone it’s not clear if we’re going to see a breakout or breakdown, but keeping the USDX picture in mind, a breakdown is much more likely. A breakdown below the medium-term support line would be an important development, so the follow-up action would likely be significant. Especially that the euro has been consolidating for more than 2 months. The last time we saw something similar was between late August 2016 and early October 2016. The decline that followed was the biggest that we saw in recent history.
(…) please note that the apex of the triangle in the euro is at the end of the month. That’s a perfect confirmation of the targets that we have for gold and silver based on the shapes of the previous declines, support lines, and gold’s cyclical turning point.
The implications for the precious metals market are bearish.
Q&A
In yesterday’s alert, we promised to reply to several interesting questions that we received from our subscribers and today we deliver.
Q: Does your analysis take into account global gold and silver ETF holdings and additions?
A: Yes, we analyzed this issue and we found that the moves in the ETF holdings are the result – not the cause of moves in the price of gold. For instance, just because the GLD ETF added a billion dollars in new money doesn’t make the outlook any more bullish than knowing that the price of gold increased.
Is an increase in price always bullish? No. For instance, a rally on very low volume is bearish and the same goes for silver’s outperformance. Also, please note that one wants to sell close to the tops, not bottoms and tops are formed after the price increases. Were the GLD ETF flows tiny before the 2011 top? Of course not.
Either way, that’s why we don’t cover the ETF inflows and outflows on a regular basis. You can read a detailed analysis along with a very informative chart in our April 15, 2016 article.
Q: Does your analysis take into account silver / gold backwardation in the futures market?
A: As it is the case with ETF holdings, we investigated this issue (please click the above link for details) and – again – we found nothing extraordinary. As serious as this issue may appear at first sight, it seems that “backwardation” and “contango” are words that gold promoters use to scare people and make it appear that the precious metals market is going to explode immediately, and thus either sell more bullion inventory or make people sign up for services that are perma-bullish toward gold. Before you ask, we are not perma-gold-bears as we expect gold and silver to soar in the coming years and to move above their 2011 highs and we had been bullish on gold for the long term until April of 2013 – you will find details on this chart.
Q: In your analysis, do you consider option expirations dates, close to delivery months?
A: Yes, that’s what we included in one of our investment tools – True Seasonals. That’s seasonality that’s enriched with the effect of the expiration dates of futures, options, and stock options.
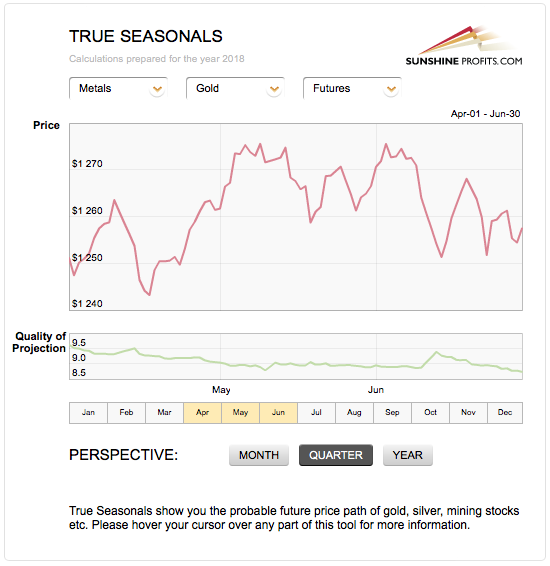
So far, the current quarter’s performance is in tune with the True Seasonal pattern. Please note that these patterns work best when there are no strong tendencies in the market and the long-term underperformance of mining stocks and the situation in the currency market suggests that there is a very big chance for the PM sector to move lower – that’s not something that even enriched seasonality should be able to change.
Q: While miners have underperformed for some time, can it be that miners are starting to play catch up, particularly since gold and silver prices have been fairly stable for the past month while the USD has also remained fairly stable?
A: It could be the case, but it’s not likely the case. The reason why we dedicated most of Monday’s alert to the issue of the mining stocks’ underperformance is to check whether the above is indeed the case or not. The analysis points to the situation in which the strength in miners is most likely a natural part of a bigger decline. The GDX to GLD ratio is after a breakdown without an invalidation, the similarity to the 2012-2013 decline in the HUI Index shows that a rally of similar size was also seen, and the short-term similarities to the previous big decline in both GDX and the GDX to GLD ratio show that what happened was a regular part of a bigger decline, not a bullish change.
Q: Unlike years past miners are generating positive free cash flow does this factor into your analysis?
A: It actually confirms it. Positive free cash flows are definitely positive news that should generate medium-term strength. The emphasis is on medium term, as that’s not short-term or temporary news that could drive the prices higher for a day or two. We are not only not seeing this strength in the medium term, but we are actually seeing mining stocks underperforming gold. The fact that they underperform even despite positive free cash flows makes the underperformance even clearer and even more bearish.
Q: Give the consistency and successfully you have had in your apex triangle analysis could you be somewhat biased in the use of the pattern?
A: We might have had too high expectations for this technique and we disclosed that as soon as we thought about it - on April 11th. We wrote the following:
However, since the charts and lines that we marked are of a long-term nature, then the implications are likely to be severe. However, at the same time, it means that we shouldn’t pay too much attention to them being very precise and we should accept that very short-term deviations are rather normal.
The apex-based reversals were so extremely effective that it was easy to extrapolate that into the future and expect this kind of efficiency each and every time and then be disappointed when things didn’t work out this way. It seems that such expectations were too high. In analogy, if you have a sharpshooter that hit the target that’s one mile away 9 out of 10 times (while everyone else managed to hit it 4 times at best), it’s easy to expect that they will practically always hit it from this distance. But, perhaps this sharpshooter just had a good day? Obviously, this person is very good with guns, but being disappointed if they only hit the target 6 or 7 times on the next day (still performing better than others) is an exaggeration. It would not be something to be disappointed with – it would be a very good outcome.
In the current situation, it might be the case that we shouldn’t expect the apex-based-reversals to work with daily precision. Actually, looking at the above charts, if the real reversal takes place in the same week as the expected reversal date, it should be viewed as very precise.
So, finally, the reply to the “what’s going on” and “what changed” questions is that the interpretation of the apex-based-reversals is changing. Instead of expecting the long-term triangle-apex-based reversals to work precisely on the predicted date, we are moving toward expecting the reversal to take place in the proximity of the target. One week before and after the expected reversal might be too broad, so it seems that a +/- 3-day rule is sufficient.
What finally happened? The entire precious metals sector reversed during the reversal week, right between the reversal dates proving the usefulness of the technique. Moreover, the price that gold reached at the reversal is the highest 2018 price to date. Silver and mining stocks have moved higher since that time, but still, it doesn’t change the fact that there was a reversal during the reversal week.
Q: With prices of all commodities increasing could gold and silver be anticipating future inflation?
A: Good question. Indeed, gold is believed to be a hedge against inflation, which is not the full truth. The price of the yellow metal is also viewed as an indicator of inflationary pressures. And indeed, the chart below seems to partially confirms this thesis (notice the 2009-2011 period).
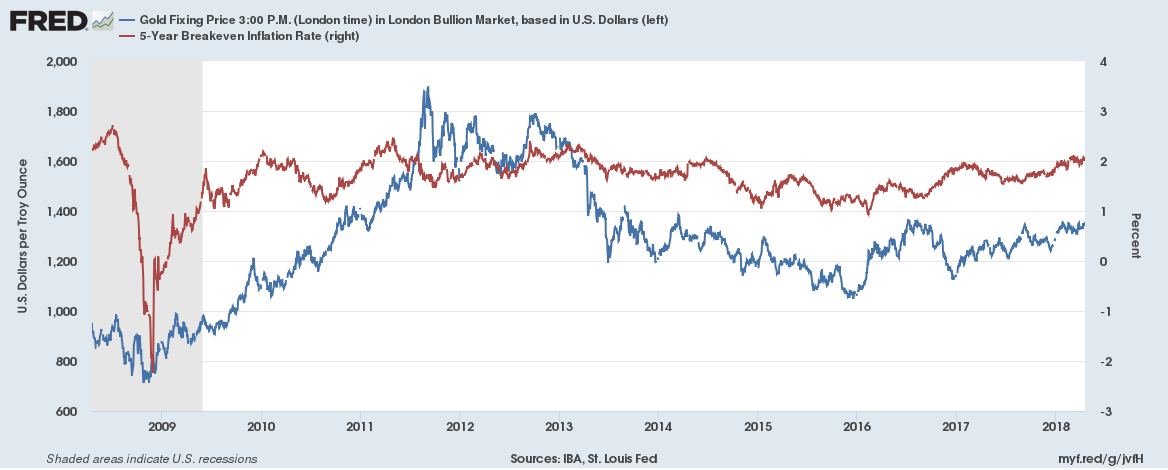
However, the correlation is far from being perfect. The decline in gold prices in 2011-2015 can hardly be explained by inflationary expectations. We believe that, at the moment, gold prices rather reflect a weak U.S. dollar. With a stronger greenback, the price of the yellow metal would be lower, despite a certain rebound in inflation. Gold shines most brightly during high and accelerating inflation - and we are not yet at this point. Inflation could rise this year, but it will most likely not get out of control.
Q: Is the back and forth in miners and PM simply a reflection of global uncertainty?
A: Most likely not. The precious metals sector should theoretically rally in uncertain times and has not so far – even though the USD moved to new lows, gold didn’t move to new highs and miners are underperforming.
We were also asked to comment on the dynamics in the juniors to gold ratio.
GDXJ to Gold Ratio
In particular, we were asked to comment on the following quote:
“GDXJ has strongly outperformed Gold over the past seven trading days. The GDXJ to Gold ratio has reached its highest mark since the start of February. That sudden relative strength is significant considering Gold is within spitting distance of a major breakout” according to ETF Daily News.
First of all, it seems better to use GLD than gold for comparison in order to make sure that the price moves are indeed comparable. The same data source and the same market ensure comparable closing prices.
When we first read that question, we were surprised. “How did we miss that” was the initial comment. The reason is that GDXJ:GDX, and GDXJ:SPY are the two charts that we’re looking at on a daily basis ever since we researched them years ago. At times, they provide interesting anomalies, but it’s not the case very often (usually no more than a few times per year). The only reason that we were not following the GDXJ:GLD ratio is that we didn’t find anything exceptional in it that would add value to what we are monitoring through the GDX:GLD and GDX:SPY ratio. So, either we missed something, or the ETF Daily News analyst(s) is/are excited over something that is not really exciting. Or there was some kind of new development that we hadn’t seen previously. Either way, it’s worth re-examining the situation.
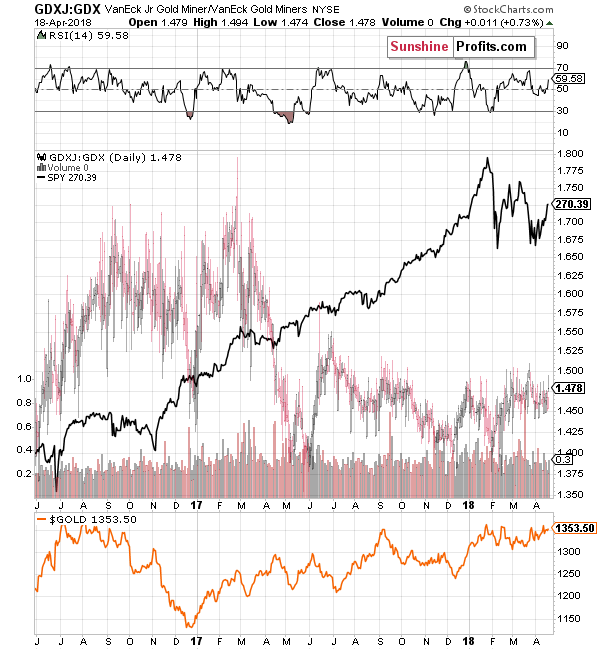
The juniors (GDXJ) to seniors (GDX) ratio has been moving back and forth in the trading range between 1.375 and 1.550 since mid-2017. The recent price move didn’t make the ratio move to new highs, it was very ordinary. The ratio has indeed moved higher from the beginning of February, but that doesn’t seem to have any implications. It also moved higher from December 2017 to early January 2018 and it didn’t cause any changes in the price of gold. There were other rallies in the ratio and they didn’t really result in anything specific – the outcomes varied. Is this bullish? Not really, especially if you factor in the fact that the biggest rally in the ratio (in mid-2016) preceded the biggest decline in gold that we’ve seen in the recent years.
The RSI indicator doesn’t show anything special about the current situation either.
Ok, but the question was about the GDXJ to gold ratio, not the one between GDXJ and GDX.
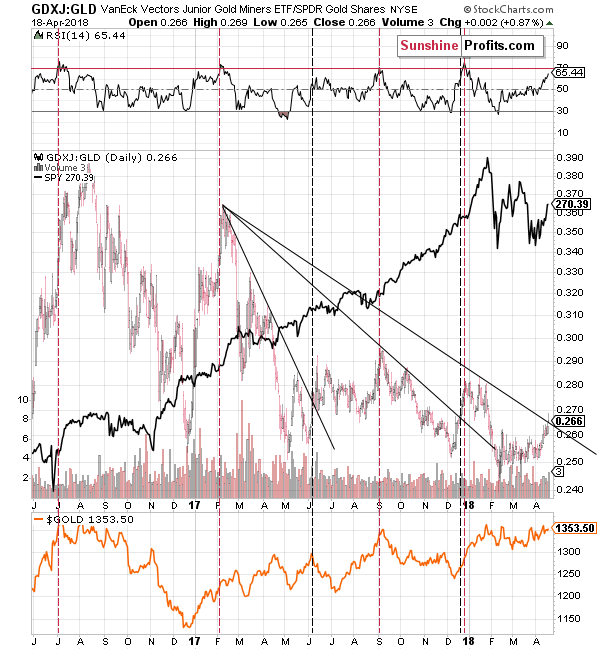
At first sight there seems to be nothing special about the above chart – the rally that we recently saw is in tune with the previous rallies (actually, a bit smaller). The problem is that these rallies were followed by different price behavior in gold – just like what we saw on the previous chart. For instance, from November 2016 to December 2016, the ratio rallied while gold declined.
But the ratio is breaking above the declining black resistance line!
That’s true, but it broke above analogous declining black resistance lines already twice in the recent past and we marked those cases with vertical black dashed lines. In one case the breakout took place at gold’s top (June 2017) and in the other case, the breakout took place during gold’s rally (December 2017). Therefore, there is no clarity regarding how we should interpret the recent breakout and thus it’s not a reliable signal.
But the RSI is moving toward 70 – it’s showing strength!
Again, it’s true, but it doesn’t imply anything. We marked cases when the RSI based on the ratio was moving to or above 70 and there were 4 such cases. In 2 cases, gold topped at that time, and in 2 cases gold continued to move higher. That’s exactly the opposite of the performance that we would like to see in a signal. Gold could be topping, but it could also rally further – this signal doesn’t seem to tell us anything reliable.
Summary
Summing up, silver’s huge rally and even bigger outperformance of gold and mining stocks is a major bearish confirmation, not something bullish. The big-volume reversal in mining stocks, which at the same time was an invalidation of an intraday breakout, confirms the bearish implications of yesterday’s session. The reversal that we’ve already seen in the case of the USD Index points to higher USD values, lower EUR/USD values and lower precious metals prices. Yesterday’s rally changed a few patterns in the case of silver, but it didn’t change the outlook, which remains bearish.
Thank you for understanding how the markets work (especially the silver market) - it seems very likely that our patience will be well rewarded.
As always, we will keep you – our subscribers – informed.
To summarize:
Trading capital (supplementary part of the portfolio; our opinion): Full short positions (200% of the full position) in gold, silver and mining stocks are justified from the risk/reward perspective with the following stop-loss orders and initial target price levels:
- Gold: initial target price: $1,218; stop-loss: $1,382; initial target price for the DGLD ETN: $53.98; stop-loss for the DGLD ETN $37.68
- Silver: initial target price: $14.63; stop-loss: $18.06; initial target price for the DSLV ETN: $33.88; stop-loss for the DSLV ETN $19.27
- Mining stocks (price levels for the GDX ETF): initial target price: $19.22; stop-loss: $23.54; initial target price for the DUST ETF: $39.88; stop-loss for the DUST ETF $21.46
In case one wants to bet on junior mining stocks' prices (we do not suggest doing so – we think senior mining stocks are more predictable in the case of short-term trades – if one wants to do it anyway, we provide the details), here are the stop-loss details and initial target prices:
- GDXJ ETF: initial target price: $27.82; stop-loss: $36.14
- JDST ETF: initial target price: $94.88 stop-loss: $41.86
Long-term capital (core part of the portfolio; our opinion): No positions (in other words: cash)
Insurance capital (core part of the portfolio; our opinion): Full position
Important Details for New Subscribers
Whether you already subscribed or not, we encourage you to find out how to make the most of our alerts and read our replies to the most common alert-and-gold-trading-related-questions.
Please note that the in the trading section we describe the situation for the day that the alert is posted. In other words, it we are writing about a speculative position, it means that it is up-to-date on the day it was posted. We are also featuring the initial target prices, so that you can decide whether keeping a position on a given day is something that is in tune with your approach (some moves are too small for medium-term traders and some might appear too big for day-traders).
Plus, you might want to read why our stop-loss orders are usually relatively far from the current price.
Please note that a full position doesn’t mean using all of the capital for a given trade. You will find details on our thoughts on gold portfolio structuring in the Key Insights section on our website.
As a reminder – “initial target price” means exactly that – an “initial” one, it’s not a price level at which we suggest closing positions. If this becomes the case (like it did in the previous trade) we will refer to these levels as levels of exit orders (exactly as we’ve done previously). Stop-loss levels, however, are naturally not “initial”, but something that, in our opinion, might be entered as an order.
Since it is impossible to synchronize target prices and stop-loss levels for all the ETFs and ETNs with the main markets that we provide these levels for (gold, silver and mining stocks – the GDX ETF), the stop-loss levels and target prices for other ETNs and ETF (among other: UGLD, DGLD, USLV, DSLV, NUGT, DUST, JNUG, JDST) are provided as supplementary, and not as “final”. This means that if a stop-loss or a target level is reached for any of the “additional instruments” (DGLD for instance), but not for the “main instrument” (gold in this case), we will view positions in both gold and DGLD as still open and the stop-loss for DGLD would have to be moved lower. On the other hand, if gold moves to a stop-loss level but DGLD doesn’t, then we will view both positions (in gold and DGLD) as closed. In other words, since it’s not possible to be 100% certain that each related instrument moves to a given level when the underlying instrument does, we can’t provide levels that would be binding. The levels that we do provide are our best estimate of the levels that will correspond to the levels in the underlying assets, but it will be the underlying assets that one will need to focus on regarding the signs pointing to closing a given position or keeping it open. We might adjust the levels in the “additional instruments” without adjusting the levels in the “main instruments”, which will simply mean that we have improved our estimation of these levels, not that we changed our outlook on the markets. We are already working on a tool that would update these levels on a daily basis for the most popular ETFs, ETNs and individual mining stocks.
Our preferred ways to invest in and to trade gold along with the reasoning can be found in the how to buy gold section. Additionally, our preferred ETFs and ETNs can be found in our Gold & Silver ETF Ranking.
As a reminder, Gold & Silver Trading Alerts are posted before or on each trading day (we usually post them before the opening bell, but we don't promise doing that each day). If there's anything urgent, we will send you an additional small alert before posting the main one.
=====
Latest Free Trading Alerts:
Trump arouses enormous emotions. His policies are usually widely debated. However, the recent decision passed relatively unnoticed. Bad! It’s really strange given its potential impact on the financial markets, including precious metals. So, what new is coming from Washington?
Trump’s Important Decision Nobody Talks About
Earnings season is just getting underway and stocks extend their short-term uptrend. Yesterday's trading session was mixed, as the market reached potential resistance level. Is this a topping pattern or just quick profit taking action before another leg higher? There are still two possible medium-term scenarios.
Earnings Season, More Doubts Emerge
=====
Hand-picked precious-metals-related links:
PRECIOUS-Gold gains as metals rally sparks inflation concerns
Gold price rally, cash crunch dulls Akshaya Tritiya festival buying
Chinese Gold output falls during the first quarter of 2018
=====
In other news:
Investors Are Getting Worried About an Inverted Yield Curve
VIX Rigging Talk Erupts on Wall Street After Another Wild Swing
Here Are the Biggest Tariff Concerns in the Fed's Beige Book
More China bank reserve cuts on the cards as PBOC seeks to prevent slowdown
What Bitcoin Is Really Worth May No Longer Be Such a Mystery
=====
Thank you.
Sincerely,
Przemyslaw Radomski, CFA
Founder, Editor-in-chief, Gold & Silver Fund Manager
Gold & Silver Trading Alerts
Forex Trading Alerts
Oil Investment Updates
Oil Trading Alerts

