

Briefly: In our opinion, full (200% of the regular size of the position) speculative short positions in gold, silver and mining stocks are justified from the risk/reward perspective at the moment of publishing this alert.
In yesterday’s alert, we wrote about the reversals in gold and gold stocks, but instead of a coherent decline in the entire precious metals market, we witnessed a move higher in gold and silver, while mining stocks declined. Was the only impact of gold’s triangle-apex-based reversal pattern a reversal… to the upside that we saw early during yesterday’s session? Are the implications actually bullish?
Not at all. Let’s see what exactly happened.
Gold moved higher and even rallied overnight only to decline in the following hours, thus showing that we not only saw the early reversal to the upside, but also the later reversal to the downside. The existence of the upside reversal doesn’t change the fact that there was indeed a bearish reversal later on and that the action that we were expecting indeed took place.
At the moment of writing these words, gold is trading more or less where it was trading about 24 hours ago, so the outlook is just as it was before – bearish.
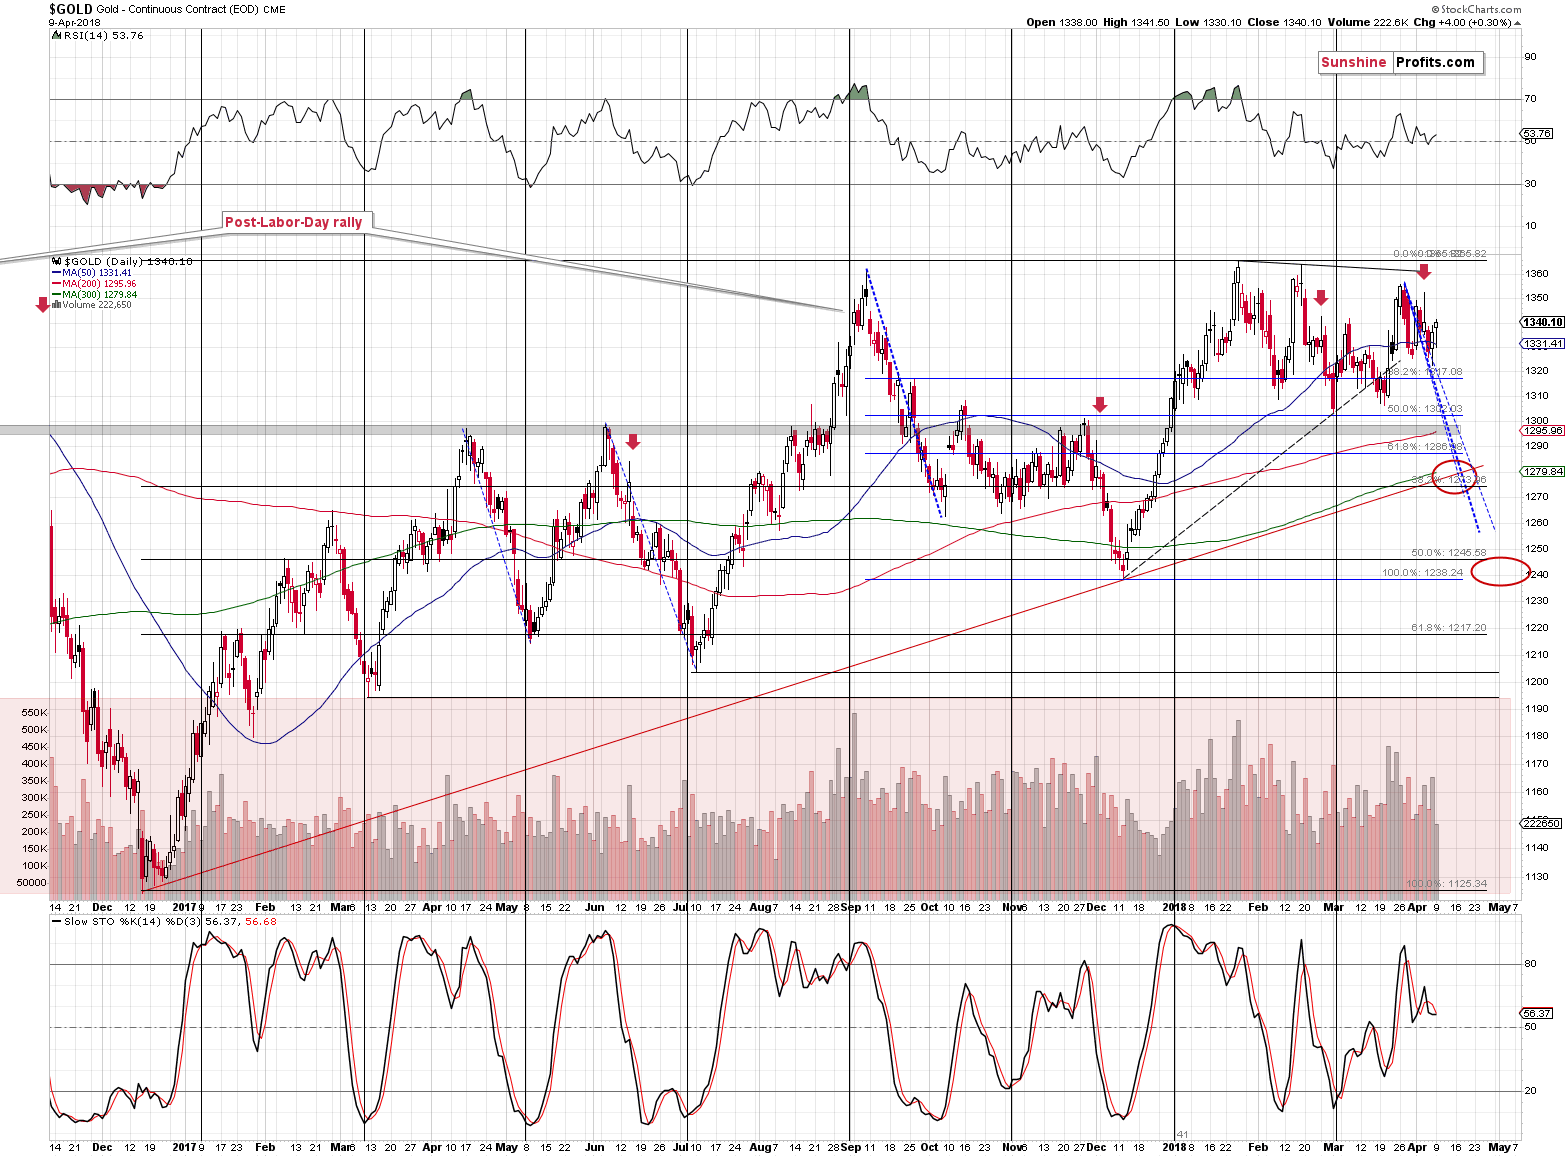
The additional bearish confirmations come from gold’s volume, silver’s price and mining stocks. Low volume during moves higher suggests that the buying power is drying up and since we saw the same thing in the case of the GLD ETF, we can view the volume signal as being confirmed.
The Silver Confirmation
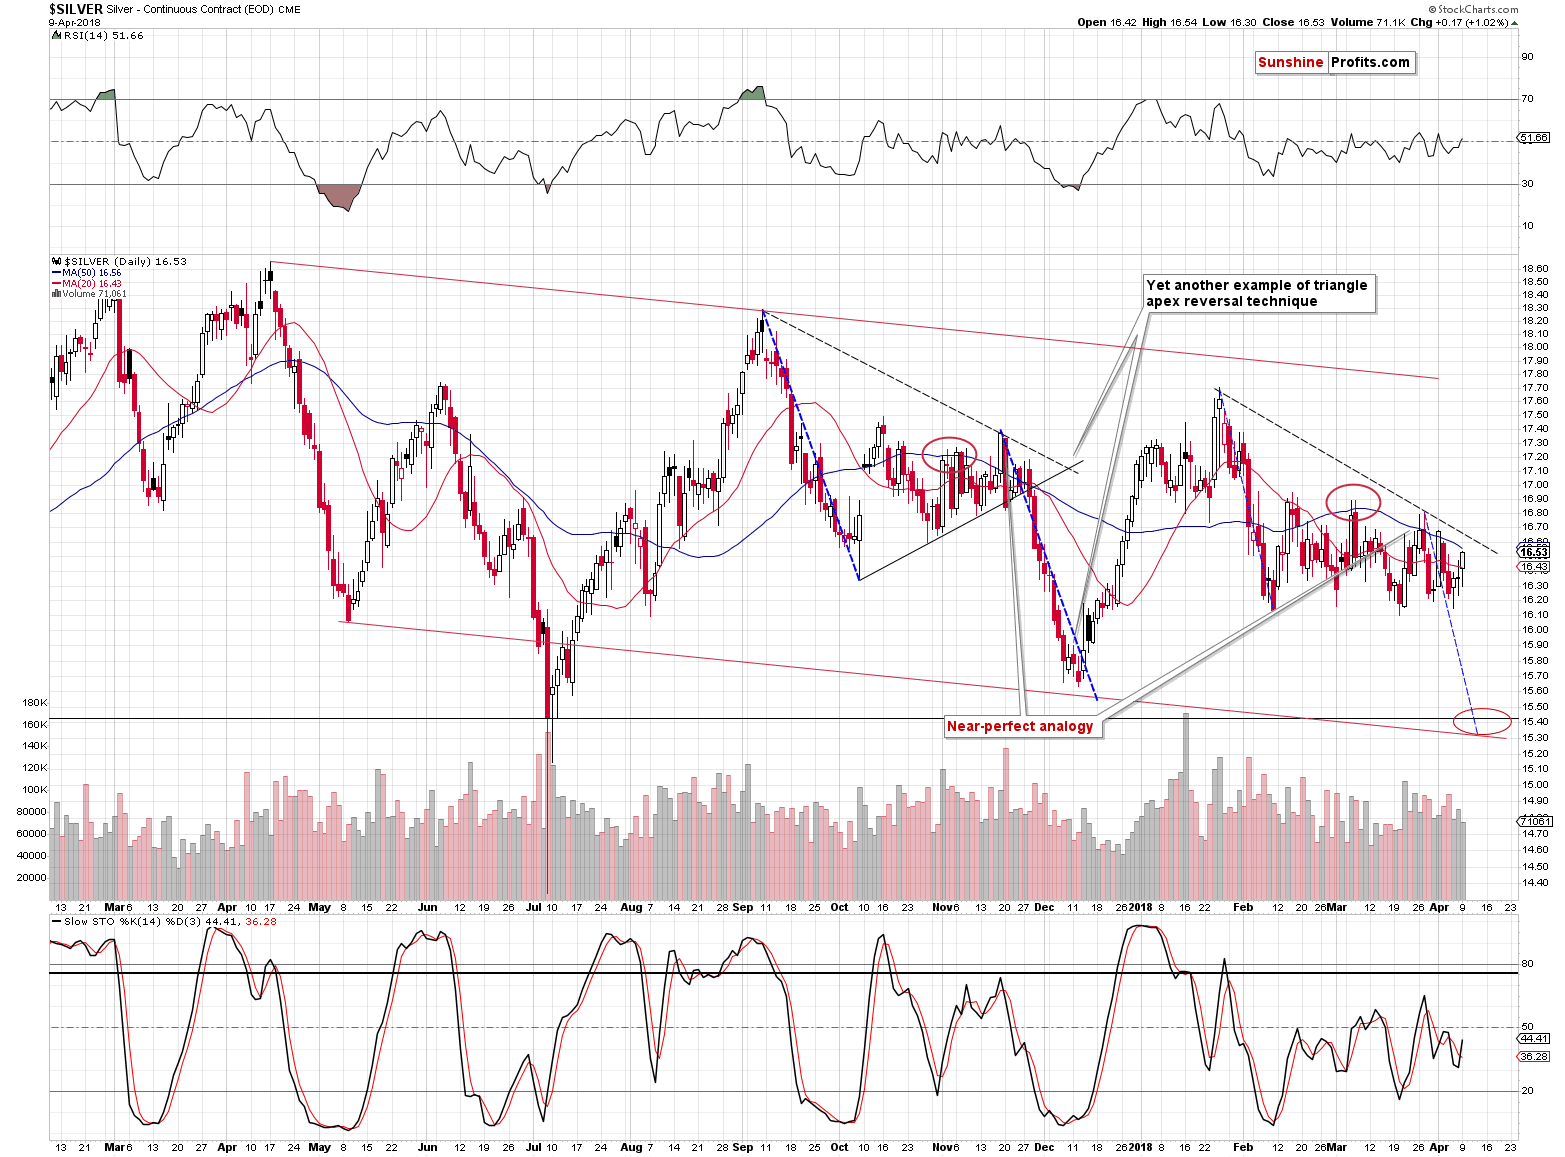
The confirmation is simply silver’s outperformance. That’s what accompanies local tops, especially when it’s accompanied by weakness in mining stocks – which we indeed saw yesterday.
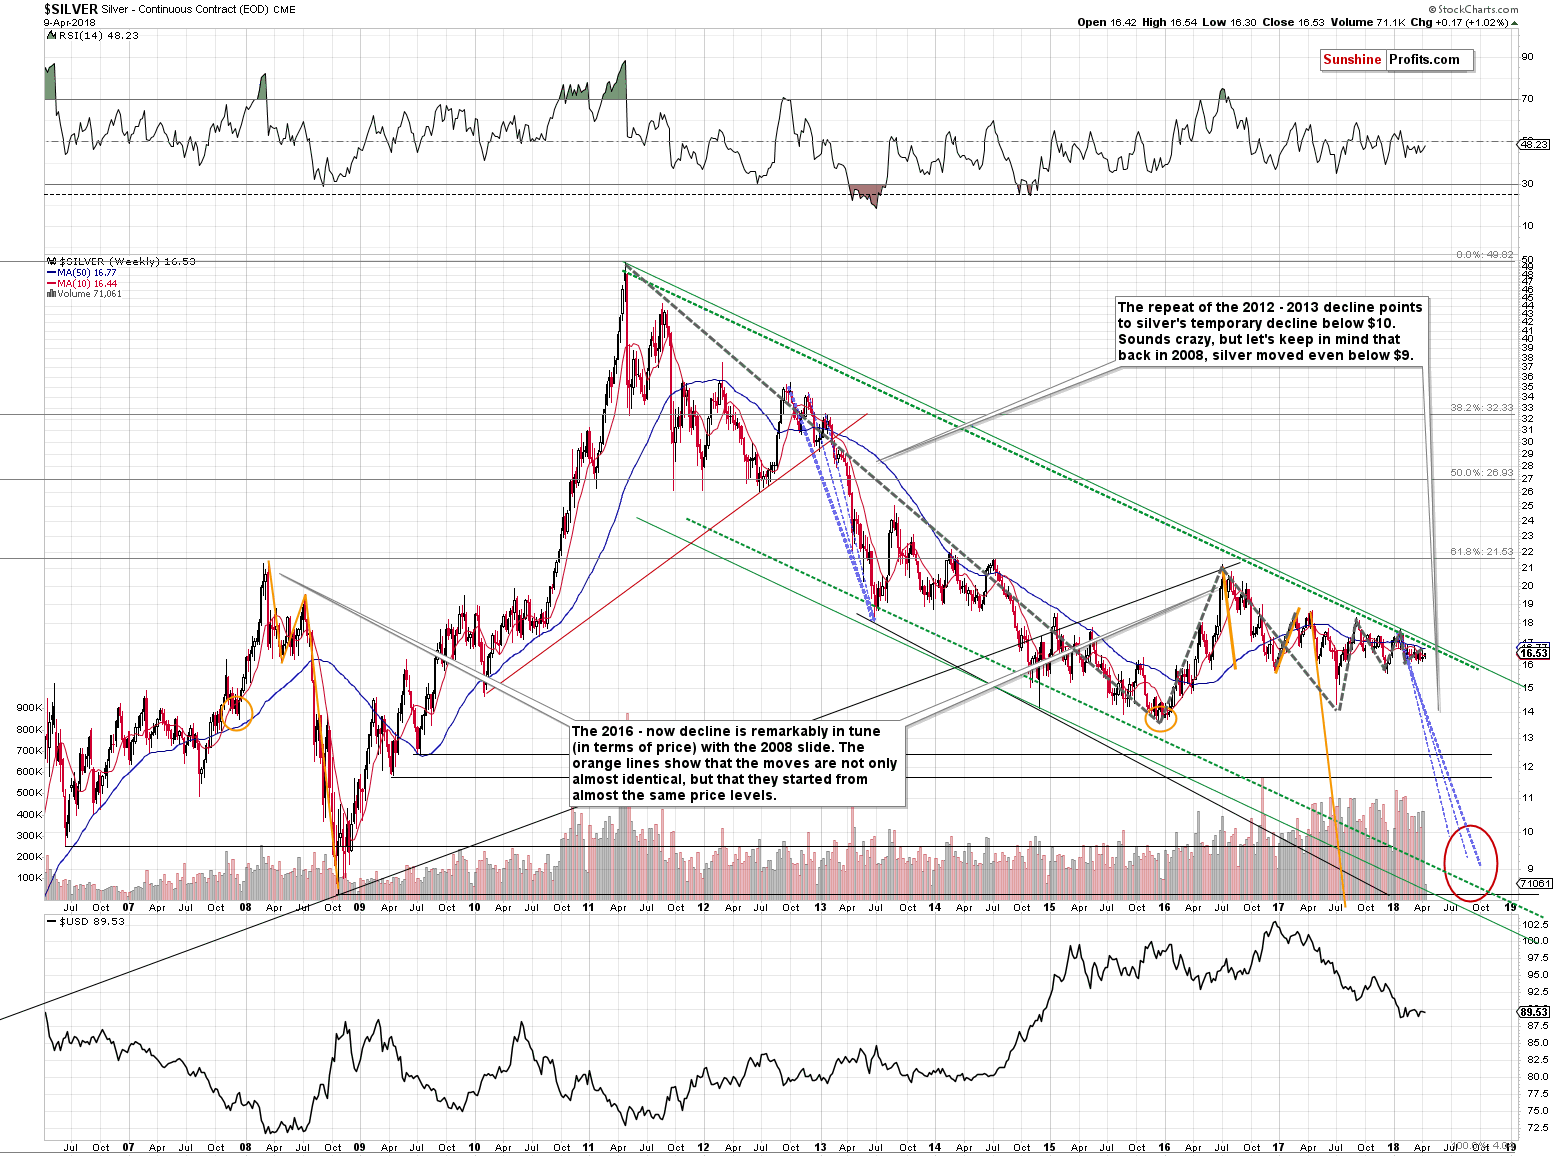
Silver’s performance seems to be now less similar to the September – December pattern as it deviates from the dashed blue line quite visibly. But, that’s not really the case. The consolidation is simply longer this time – the overall shape of both patterns is still remarkably similar. When we finally see the breakdown, the silver price is still likely to move lower in a decisive fashion, just as it moved lower in November and December 2017. When that happens, we’ll simply adjust the declining dashed blue line to the most recent local high in order to get the approximate bottom estimation.
Is silver still likely to form a local bottom later this week? It’s certainly possible – after all, it’s silver and silver is known to do crazy things from time to time (early July 2017). However, it’s also possible that silver moves back and forth with the final intraday top on Thursday or so. Then, the decline would follow.
In other words, we’re likely to substantially profit on the decline in the precious metals market either right away or in a few days. Does it really matter if we have to wait additional several days? Not really.
The Mining Stocks’ Confirmation
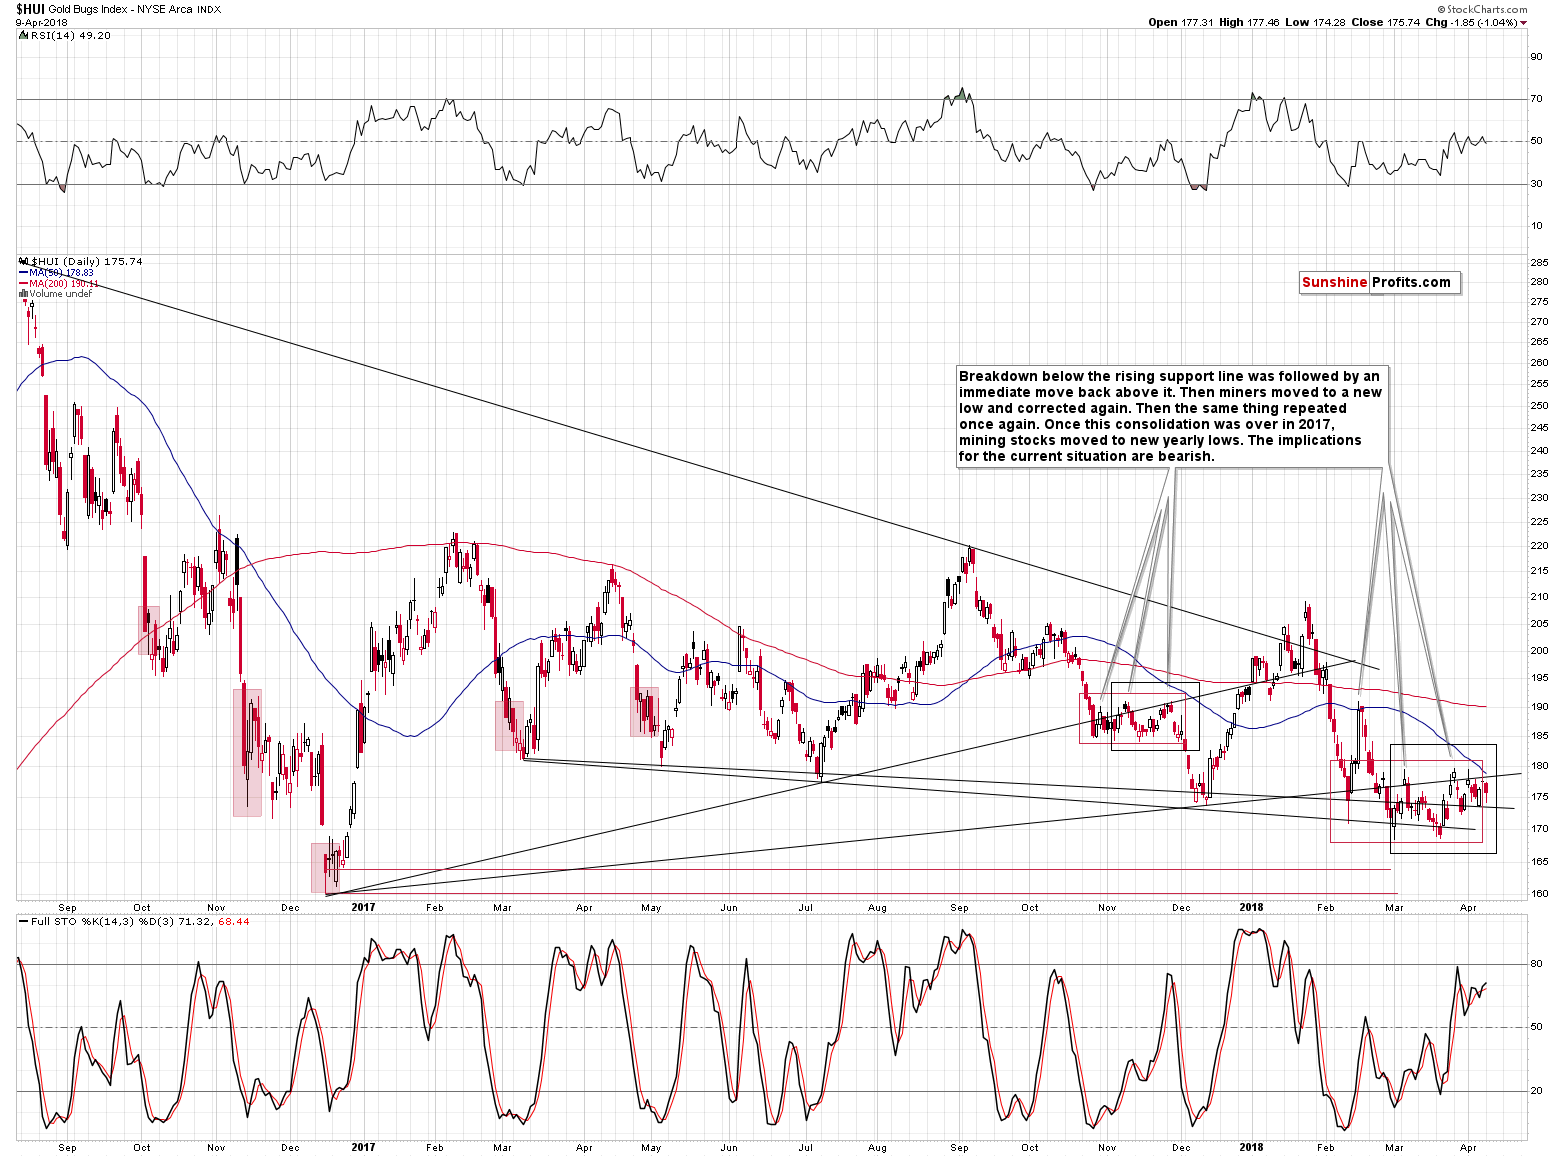
The bearish confirmation from mining stocks comes from the simple fact that miners declined while gold moved higher, and thus they underperformed the latter. There’s not much else that we can say about the above chart, so let’s move back to silver – we have something more to say about this market.
The Silver Oscillator
Many years ago, when I was taking my school leaving exams, I thought to myself that I would never use one of the things that learned. One of the exams was a physics exam and my task on it was to show the derivation of the formula for the damping of vibration motion in a swinging pendulum. Don’t worry – I will not torture you with the derivation process. Instead I will prove myself wrong by actually applying some of the theory to the silver market.
There are quite a few things that actually are harmonic oscillators: for instance something attached to a spring that’s being stretched and then let go, or a pendulum that’s swinging. In practice, they are all damped, because there are forces that make the subsequent moves smaller and smaller. For instance, friction can cause the moves to be damped. This may seem quite complicated when you read about it, but a brief look at a picture can make it all seem familiar.
Source: http://hyperphysics.phy-astr.gsu.edu/hbase/oscda.html
The moves, for instance in a swinging pendulum, are decreasing over time, just as what you can see above – the calculations behind it are rather complex, but the shape of the move is quite intuitive.
There seems to be one damped oscillator that no physics book ever featured. Maybe the only one ever which allows to directly profit from it.
The price of silver.
Since topping in 2011, silver has been moving back and forth in a specific way. The moves down and up were smaller, just like the ones in a damped harmonic oscillator.
On the above silver chart, we marked the key moves with thick gray dashed lines. Please note that their size is declining over time – just like it is the case with damped oscillators.
Ok, but why is this important from the investment point of view? Why should I care about all this?
Because it shows how little is needed for silver to start a massive move.
The existence of the oscillating pattern alone is not enough to draw the above conclusion, but it is enough once we combine it with the simple fact that the biggest and most volatile moves are characterized by declining and very low volatility. That’s exactly what the damped vibrations are – a decrease in silver’s volatility. The fact that silver’s price moves are smaller and smaller is a clear sign that silver is preparing for a big move. Based on multiple factors that we discussed previously, it’s likely that this big move is going to be lower.
What does the oscillating pattern imply again?
The oscillator implies a clear pattern – each move should be smaller than the previous one. As soon as the above is broken – by a move that’s bigger than the previous one, we have a major breakout or breakdown. Normally, one would want to wait for a bigger confirmation like a weekly close below or above a key price extreme. Being aware of the mentioned pattern, we know that it’s not necessary to wait for it. In other words, we’ll get the “Buckle up! The big move is starting!” signal much sooner than those who are not aware of this pattern.
Since the recent moves in silver were small, it takes very little for the white metal to break from it and be ready for a major move. It seems that our patience with the current trading position will be well rewarded.
On a side note, in order to let everyone know more or less what we do in our regular alerts, every now and then we share parts of our analyses publicly (naturally, without disclosing the key details like positions and position sizes), but we will not share the above with anyone else. This part of our analysis will remain exclusive to you – our subscribers.
Summary
Summing up, it seems that we’re about to see a decline in precious metals based on the recent move higher and the triangle-apex-based reversals in gold and gold stocks. Yesterday’s low-volume upswing in gold, the outperformance of silver and underperformance of mining stocks all serve as bearish confirmations. Based on silver’s oscillating pattern, it seems that the critical breakdown is much closer than everyone thinks.
As always, we will keep you – our subscribers – informed.
To summarize:
Trading capital (supplementary part of the portfolio; our opinion): Full short positions (200% of the full position) in gold, silver and mining stocks are justified from the risk/reward perspective with the following stop-loss orders and initial target price levels
- Gold: initial target price: $1,218; stop-loss: $1,382; initial target price for the DGLD ETN: $53.98; stop-loss for the DGLD ETN $37.68
- Silver: initial target price: $14.63; stop-loss: $17.33; initial target price for the DSLV ETN: $33.88; stop-loss for the DSLV ETN $21.48
- Mining stocks (price levels for the GDX ETF): initial target price: $19.22; stop-loss: $23.54; initial target price for the DUST ETF: $39.88; stop-loss for the DUST ETF $21.46
In case one wants to bet on junior mining stocks' prices (we do not suggest doing so – we think senior mining stocks are more predictable in the case of short-term trades – if one wants to do it anyway, we provide the details), here are the stop-loss details and initial target prices:
- GDXJ ETF: initial target price: $27.82; stop-loss: $36.14
- JDST ETF: initial target price: $94.88 stop-loss: $41.86
Long-term capital (core part of the portfolio; our opinion): No positions (in other words: cash)
Insurance capital (core part of the portfolio; our opinion): Full position
Important Details for New Subscribers
Whether you already subscribed or not, we encourage you to find out how to make the most of our alerts and read our replies to the most common alert-and-gold-trading-related-questions.
Please note that the in the trading section we describe the situation for the day that the alert is posted. In other words, it we are writing about a speculative position, it means that it is up-to-date on the day it was posted. We are also featuring the initial target prices, so that you can decide whether keeping a position on a given day is something that is in tune with your approach (some moves are too small for medium-term traders and some might appear too big for day-traders).
Plus, you might want to read why our stop-loss orders are usually relatively far from the current price.
Please note that a full position doesn’t mean using all of the capital for a given trade. You will find details on our thoughts on gold portfolio structuring in the Key Insights section on our website.
As a reminder – “initial target price” means exactly that – an “initial” one, it’s not a price level at which we suggest closing positions. If this becomes the case (like it did in the previous trade) we will refer to these levels as levels of exit orders (exactly as we’ve done previously). Stop-loss levels, however, are naturally not “initial”, but something that, in our opinion, might be entered as an order.
Since it is impossible to synchronize target prices and stop-loss levels for all the ETFs and ETNs with the main markets that we provide these levels for (gold, silver and mining stocks – the GDX ETF), the stop-loss levels and target prices for other ETNs and ETF (among other: UGLD, DGLD, USLV, DSLV, NUGT, DUST, JNUG, JDST) are provided as supplementary, and not as “final”. This means that if a stop-loss or a target level is reached for any of the “additional instruments” (DGLD for instance), but not for the “main instrument” (gold in this case), we will view positions in both gold and DGLD as still open and the stop-loss for DGLD would have to be moved lower. On the other hand, if gold moves to a stop-loss level but DGLD doesn’t, then we will view both positions (in gold and DGLD) as closed. In other words, since it’s not possible to be 100% certain that each related instrument moves to a given level when the underlying instrument does, we can’t provide levels that would be binding. The levels that we do provide are our best estimate of the levels that will correspond to the levels in the underlying assets, but it will be the underlying assets that one will need to focus on regarding the signs pointing to closing a given position or keeping it open. We might adjust the levels in the “additional instruments” without adjusting the levels in the “main instruments”, which will simply mean that we have improved our estimation of these levels, not that we changed our outlook on the markets. We are already working on a tool that would update these levels on a daily basis for the most popular ETFs, ETNs and individual mining stocks.
Our preferred ways to invest in and to trade gold along with the reasoning can be found in the how to buy gold section. Additionally, our preferred ETFs and ETNs can be found in our Gold & Silver ETF Ranking.
As a reminder, Gold & Silver Trading Alerts are posted before or on each trading day (we usually post them before the opening bell, but we don't promise doing that each day). If there's anything urgent, we will send you an additional small alert before posting the main one.
=====
Latest Free Trading Alerts:
Friday was hot and sponsored by the letter “P”. Payrolls were published and Powell made the first speech as the Fed Chair, pushing the price of gold to proliferate. What picture does it paint for gold?
3xP: Payroll, Powell and Price of Gold
The stock market retraced most of its last week's Wednesday - Thursday's gains on Friday, as investors reacted to worse-than-expected monthly jobs data release, trade tariffs announcement. Friday's sell-off brought the S&P 500 index back to its medium-term upward trend line. Will it break lower this time?
=====
Hand-picked precious-metals-related links:
PRECIOUS-Gold steady as market wary on geopolitical rumblings
Gold Imports by India Are Said to Slump Before Key Day for Sales
World Gold Cuncil: Official gold reserves
=====
In other news:
Fed has to be gradual, patient in raising rates: Dallas Fed President Kaplan
Why Bitcoin Behaves Like the Flu
5 Key Takeaways From China's President Xi Jinping's Speech To Boao Forum
=====
Thank you.
Sincerely,
Przemyslaw Radomski, CFA
Founder, Editor-in-chief, Gold & Silver Fund Manager
Gold & Silver Trading Alerts
Forex Trading Alerts
Oil Investment Updates
Oil Trading Alerts

