

Briefly: In our opinion, full (200% of the regular size of the position) speculative short positions in gold, silver and mining stocks are justified from the risk/reward perspective at the moment of publishing this alert.
Yesterday’s session was very surprising to many gold investors. Why did it rally so much? Why did it decline before the end of the session? Why did we see a huge reversal all of the sudden? But not to you. By reading our analyses, you had already known that this was the reversal week, so all that happened yesterday was quite normal. What’s next?
Since the reversal was indeed seen and confirmed by huge volume, the next likely move is very likely to be to the downside and it’s likely to start shortly. In fact, it seems that it’s already underway.
Let’s take a closer look at what happened, starting with gold (chart courtesy of http://stockcharts.com).
Gold’s Profound Reversal
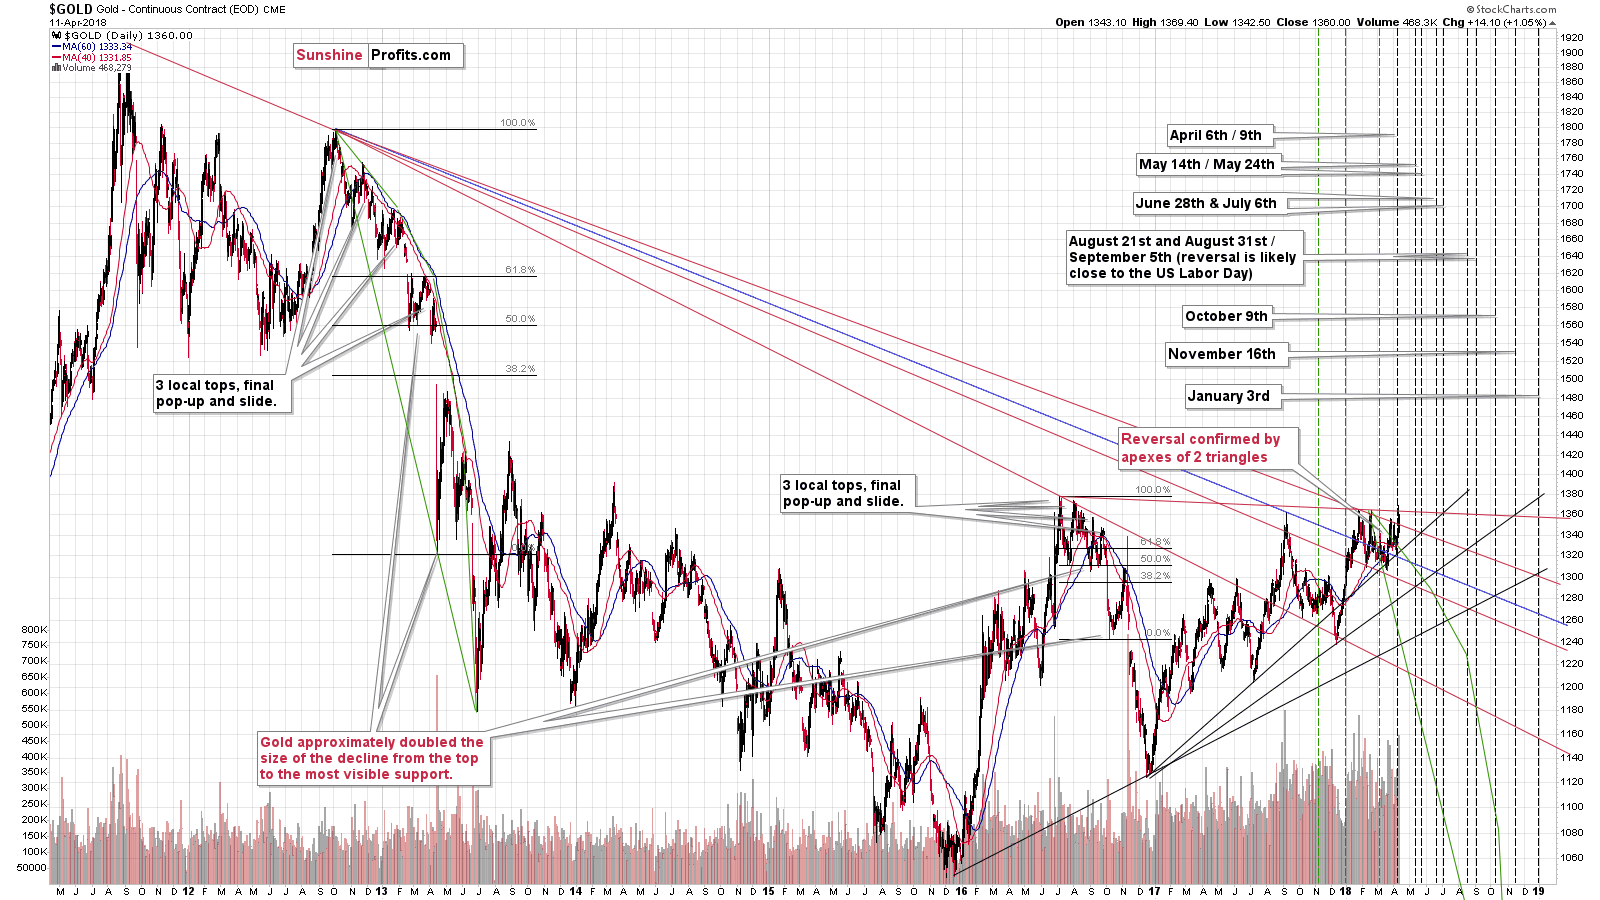
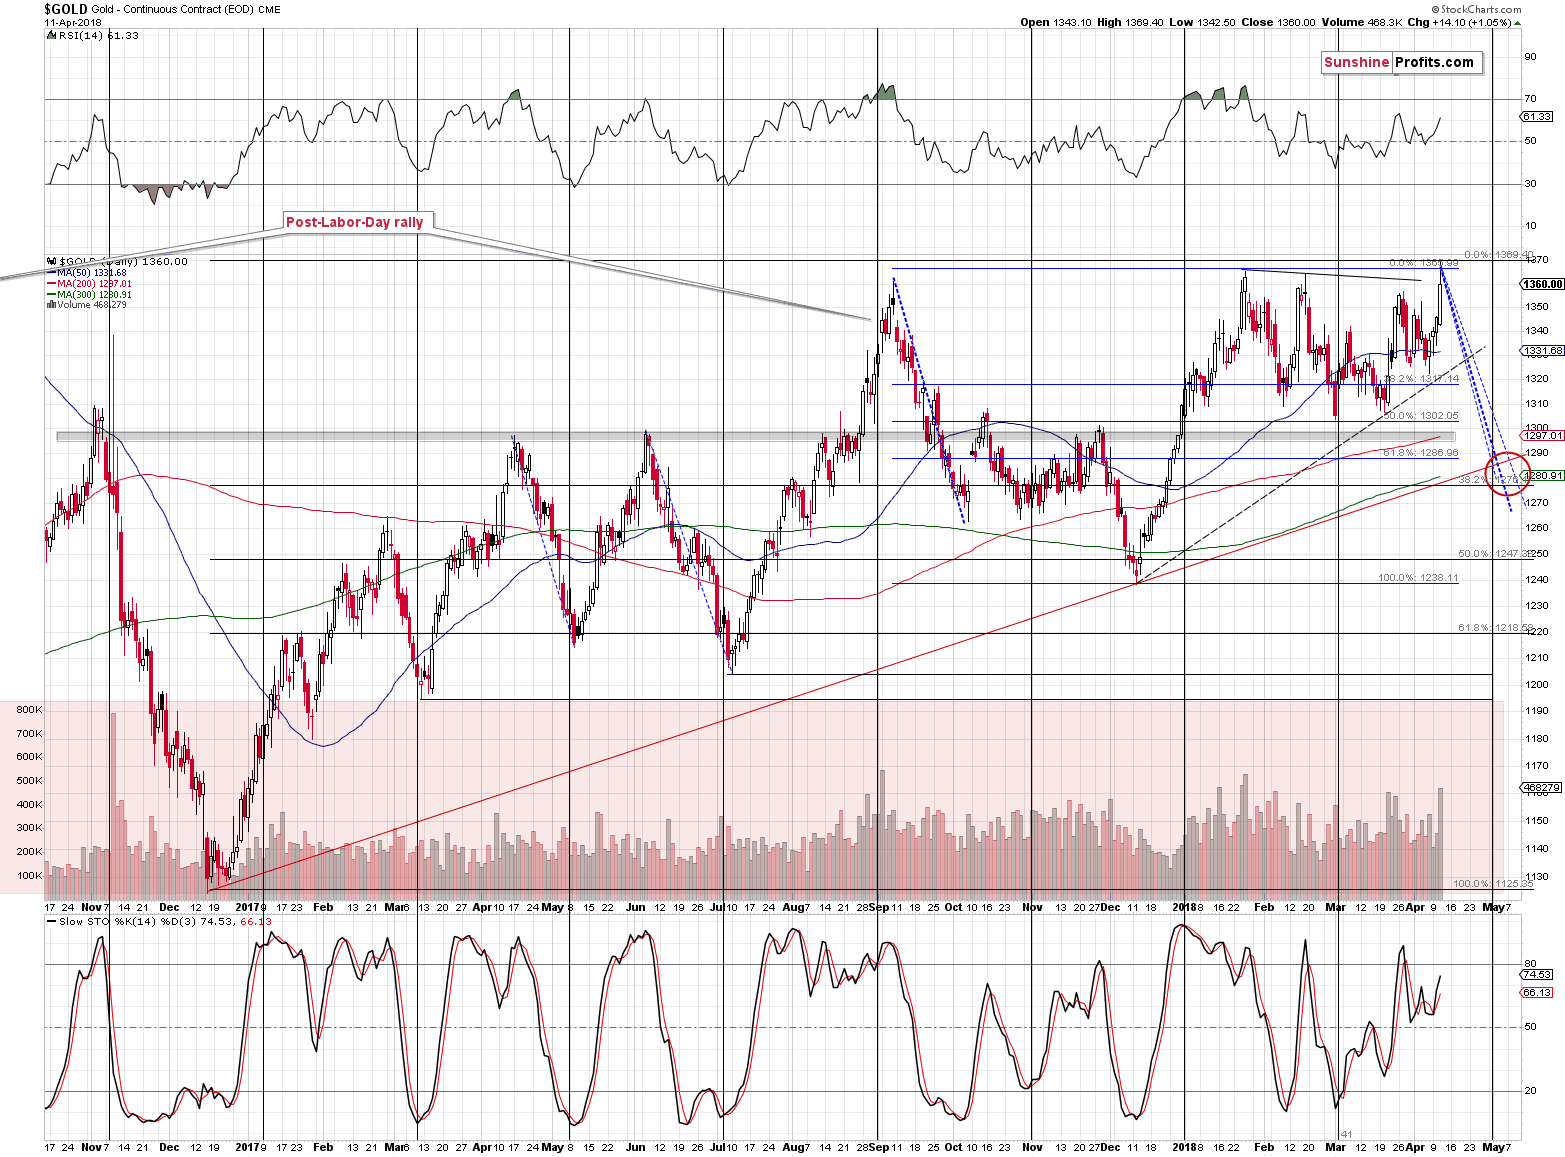
As you can see on the above chart, gold reversed a bit after the triangle-apex-based reversal, but it was so close that the delay is almost impossible to notice without knowing that there indeed was one. At first sight, everything looks to be in order – gold reversed at its reversal – simple as that.
And what reversal that was!
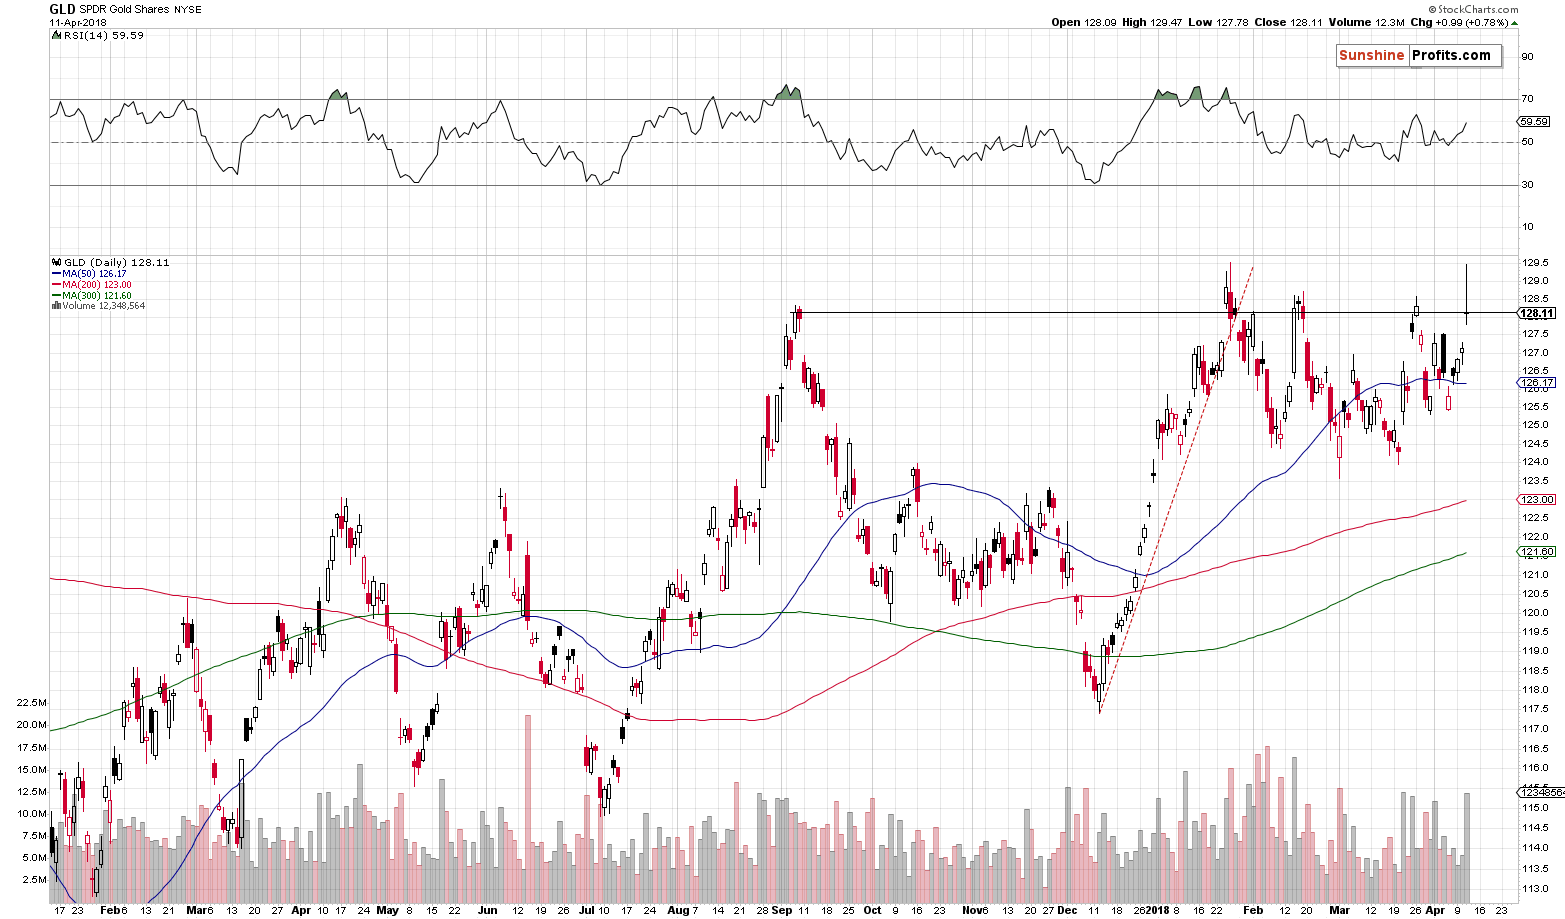
Stockcharts’ data for gold’s continuous futures contract doesn’t seem to give proper emphasis to yesterday’s closing price, so we’re supplementing the regular gold chart with the one of the GLD ETF.
In the case of gold, we saw a temporary move above the previous high, which was immediately invalidated. In the GLD ETF, we see that the invalidation of the breakouts was much more profound. In this case, there was no breakout in terms of intraday highs, but there was a move right to it and a comeback below all 2018 highs, also in terms of daily closing prices.
Both gold and GLD were accompanied by very high volume, which serves as a confirmation of the reversal.
Gold’s Aggressive Downside Target
While we’re discussing gold, we would like to take the opportunity to reply to a question that we received yesterday. Here’s the question:
Dear PR,
I am still surprised with your forecast for Gold moving below $1,000 in 5 month time. When is the last time Gold went down over 36% in such a short period of time? You can’t expect the dollar to rally 36%?
Why not set less aggressive targets?
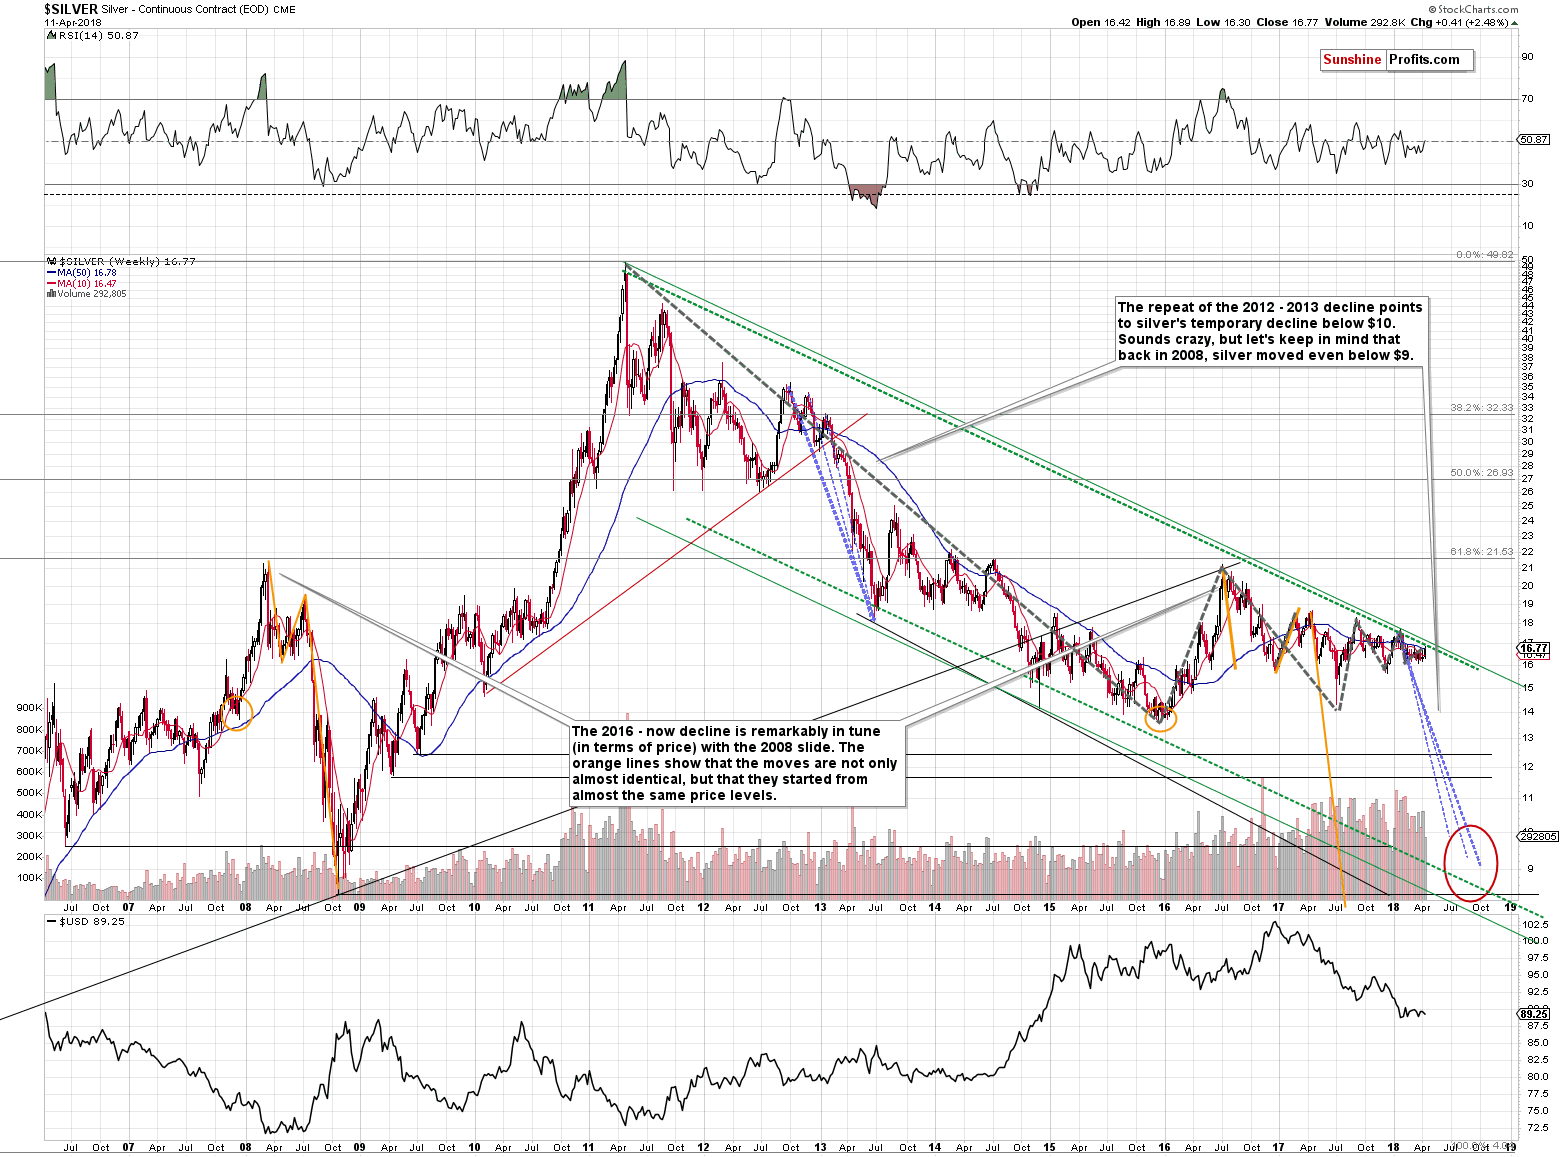
We agree that expecting gold to decline below $1,000 and even discussing the possibility of silver moving below $10, may seem a bit extreme. But if the prolonged long-term bear market in the precious metals is indeed ending, then shouldn’t we actually expect the decline to be rather extreme? The major reason for which the 2015 bottom doesn’t seem to be the final bottom is that it was not extreme enough – people were not scared enough; the PM investors didn’t drop the towel. No – instead, people were expecting higher gold prices and thus it doesn’t seem that it was the true bottom. If a move visibly below $1,100 wasn’t scary enough, then we actually should be expecting something more profound. A move to or a bit below $900 seems definitely extreme, not to mention a move below $10 in silver.
One could say that this prediction being extreme is not a “bug”, but a “feature”.
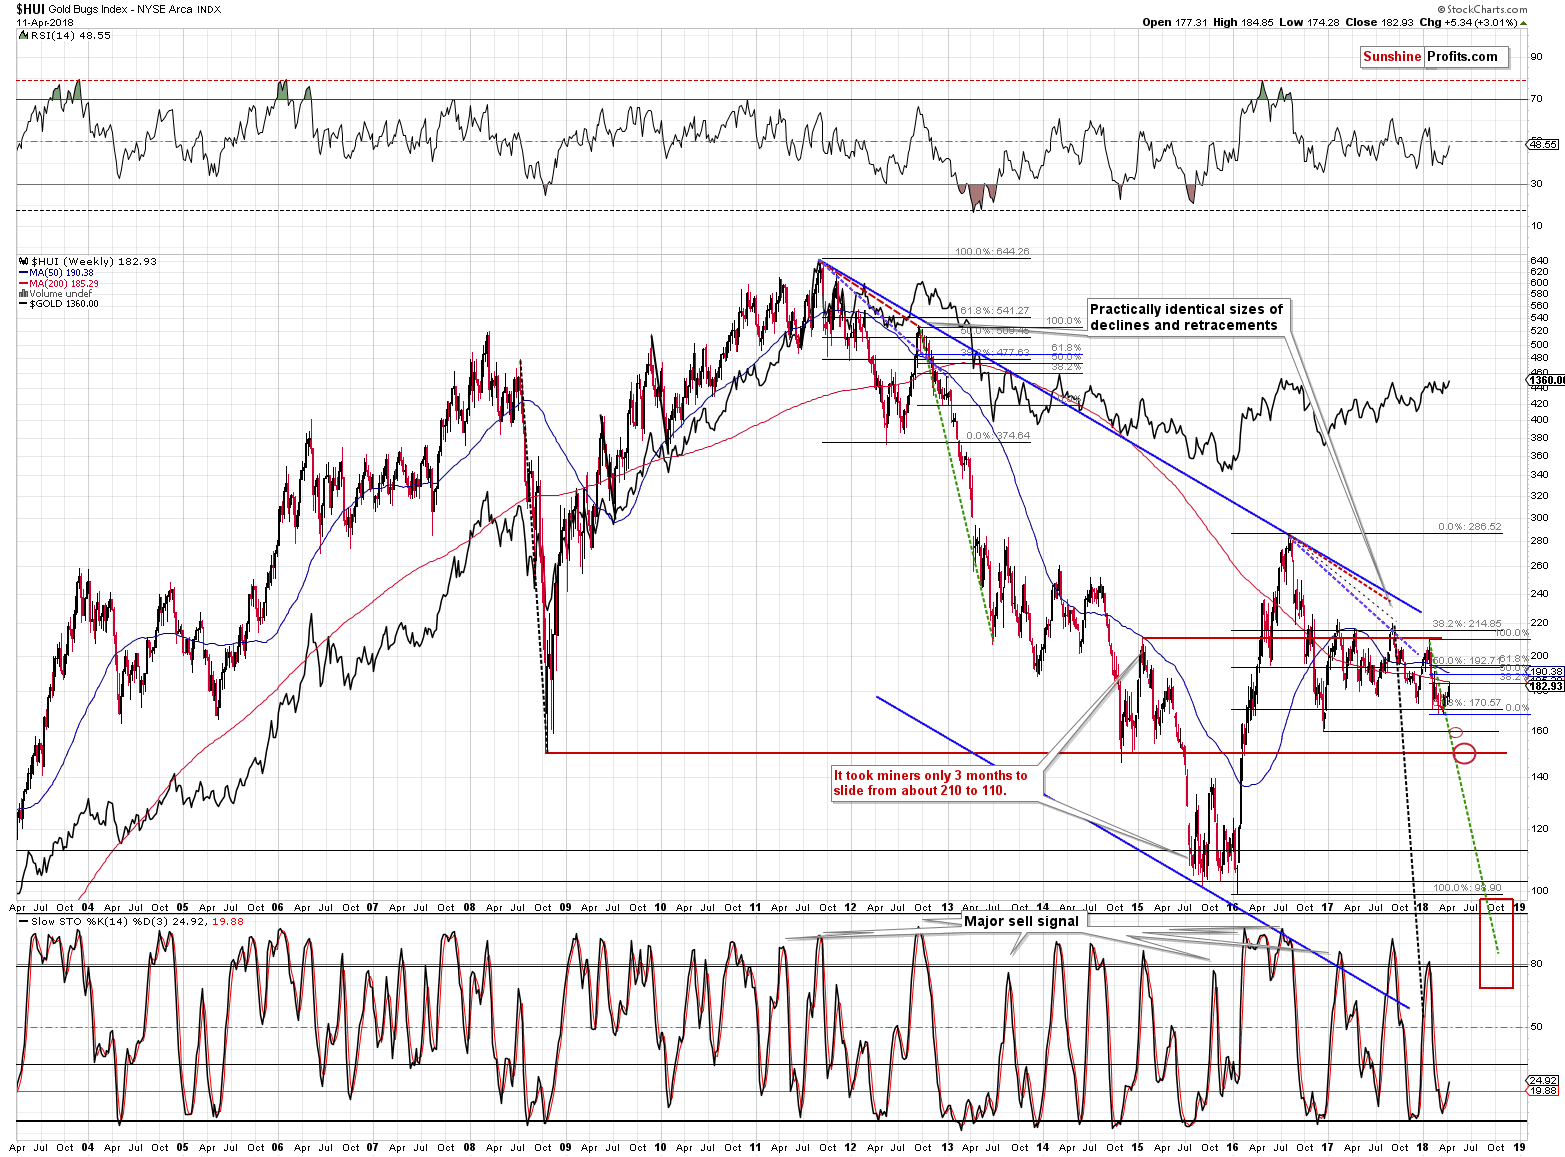
The last time when gold moved as low as quickly was during the 2012 – 2013 decline and since we have many similarities with that period (gold stocks severe medium-term underperformance being one of them), it’s actually a factor that makes the $890 - $900 target for gold more likely.
The USD Index could rally 36% (to 120 or so), but it doesn’t seem that likely. This move, however, is not required for gold to drop below $1,000. There’s more to the gold market than just the USD Index, especially when long-term moves are concerned. For instance, in early July 2016, gold topped at $1,367 (taking weekly closes into account) and the USD Index ended the same week at 96.33. Gold is now at about $1,350 ($17 lower), but the USD Index is lower as well (7.13 lower) – at about 89.2 based on the Stockcharts’ data.
So, the USD Index declined over 7 index points and gold did not manage to rally. It even declined. Something like that would not be possible given a stable gold-USD link.
This gold-USD link is not stable, and we can actually profit form this knowledge. To make a long story short, if we see that gold refuses to move one way, even though the USD Index makes it move in this direction, then it is a very strong indication, that gold will eventually (!) move strongly in the opposite direction. In the current case, we have gold that refused to rally even though it got multiple reasons to do so from the USD Index.
The same strength that prevented gold from soaring higher will be the same strength that pushes gold dramatically lower once the USD finally shows strength. In other words, it seems very likely that the moves higher in the USD index will translate into bigger declines in gold, than one might expect based on a stable gold-USD relationship.
Finally, let’s discuss why we didn’t set less aggressive targets. We already discussed the key reason above – the move should be scary enough and all price targets north of $1,000 don’t seem to fulfill this requirement. Naturally, if the technical tools all pointed to a different target, we would likely strongly consider it. But they don’t.
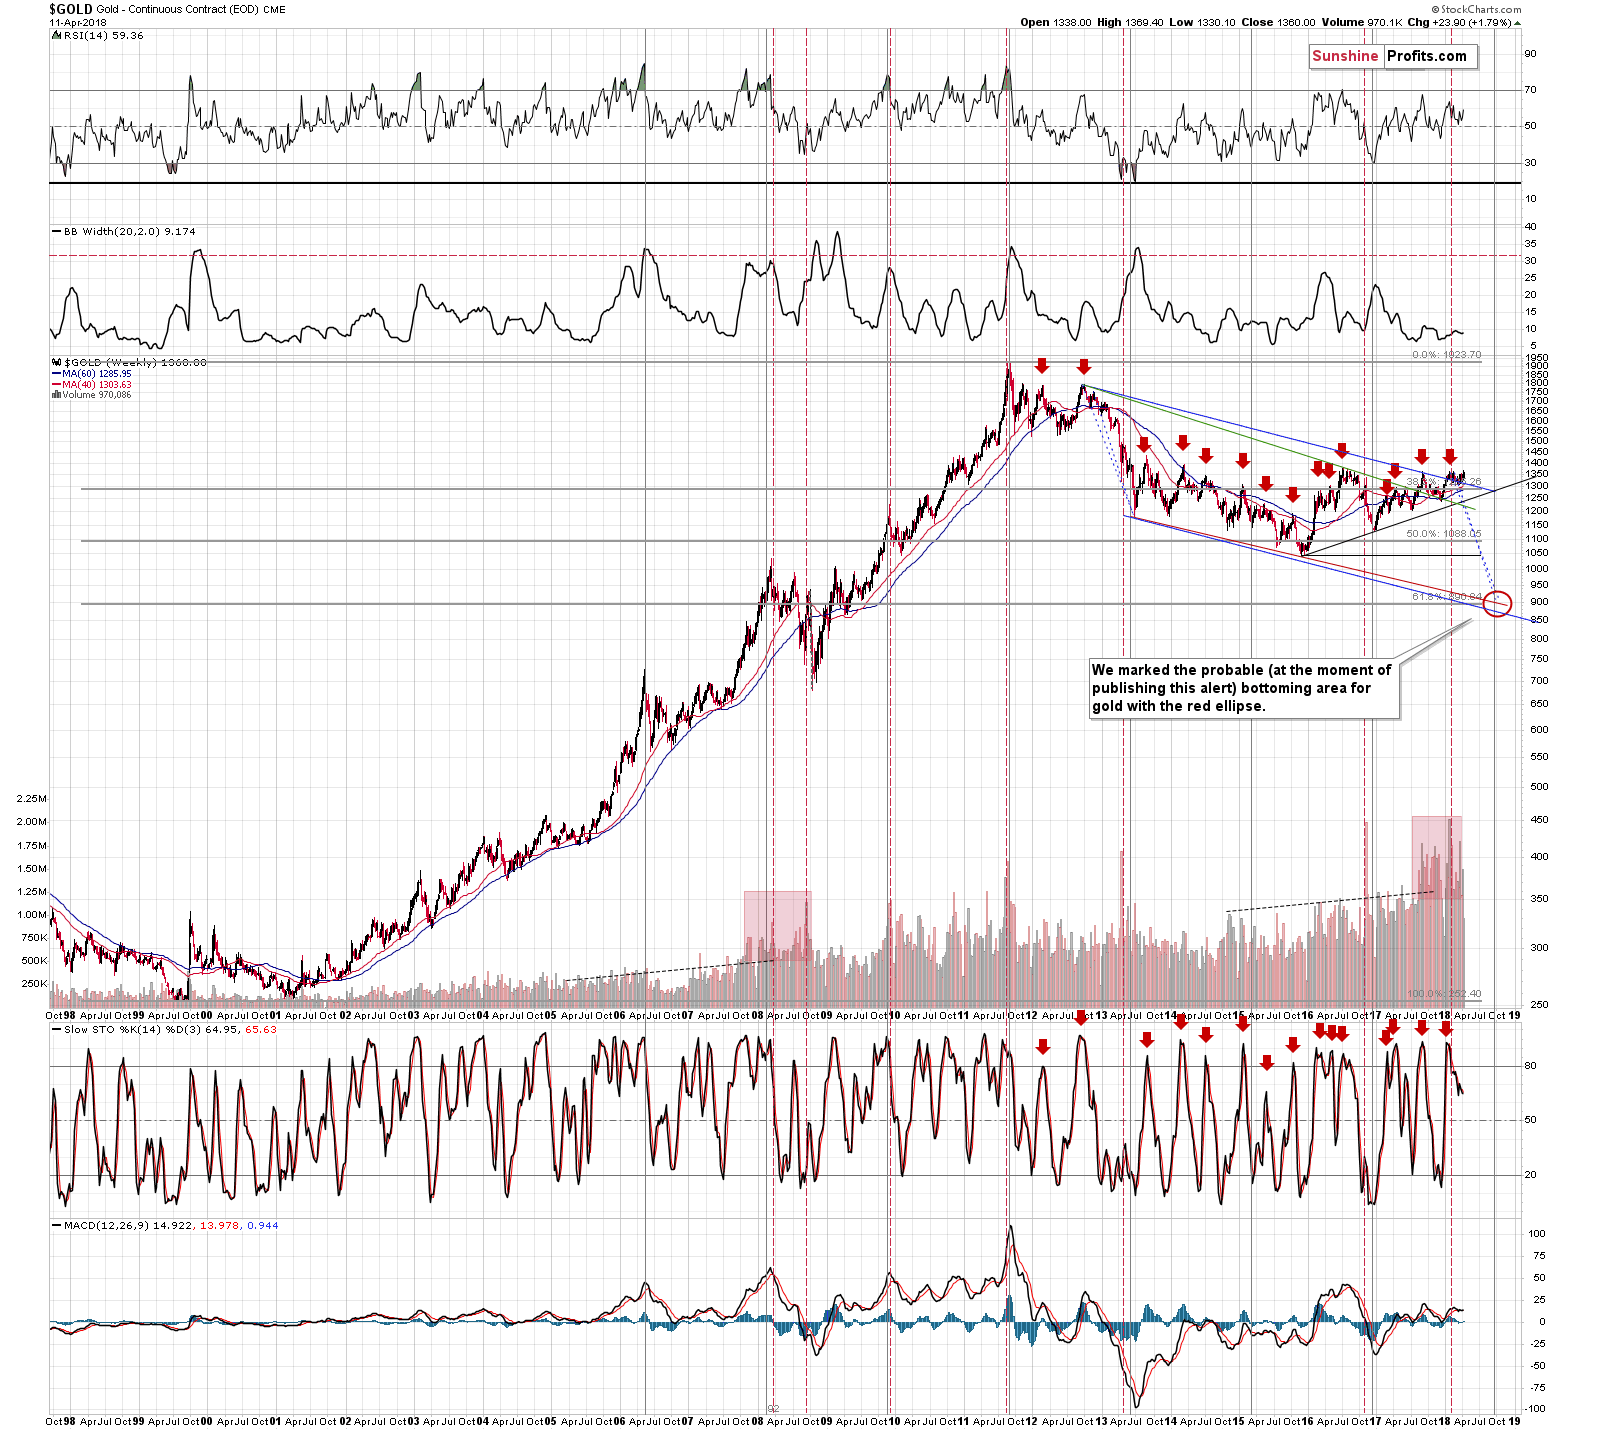
The analogy to the 2012 – 2013 decline, the very long-term turning point, the apex of the long-term triangle and the final – key – Fibonacci retracement level (61.8%) all point to the same price / time combination. In light of all these signals, we simply can’t have a less aggressive target.
Naturally, just because that’s the target for the final bottom in gold, it doesn’t mean that we will not temporarily adjust our trading positions during the way to this level. In fact, that’s what we’ve done recently (not in the last few days as it didn’t seem justified to change the position during the reversal week) – we cashed profits from the previous short position and we re-entered it at higher prices. If there is a very favorable combination of short-term bullish factors, we’ll consider going temporarily long. At this time, however, it seems that we have just seen another local top and a major reversal. Perhaps yesterday’s session will be referred to as the reversal in the following months.
Silver’s Profound Reversal
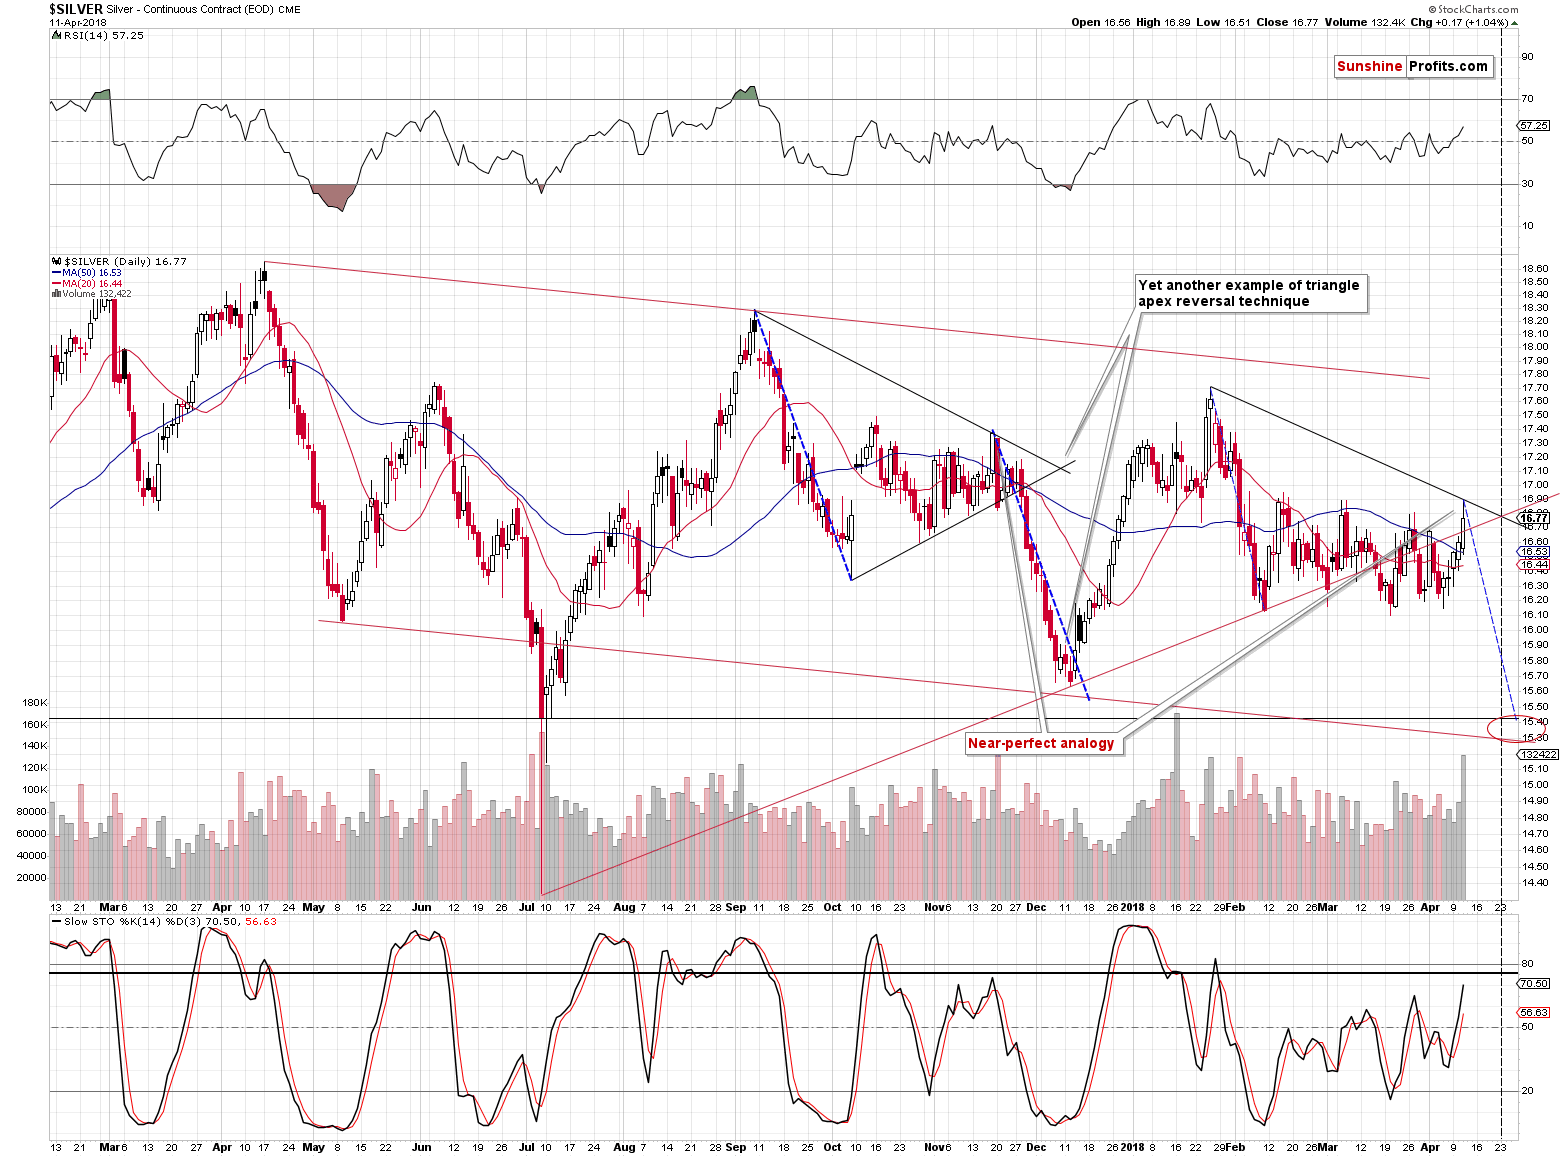
The reversal took place 1 day before the silver’s triangle-apex-based reversal. Compared to the length of the lines on which this reversal is based, this is extreme precision.
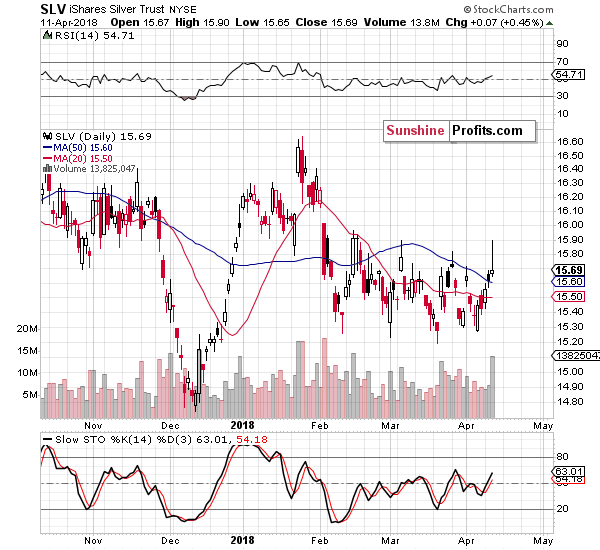
Just as what we saw in the gold market, silver’s reversal is even more visible if you look at its proxy – the SLV ETF. The volume was huge in both silver and SLV and thus the implications of the reversal are clearly bearish.
We previously commented on the silver price in the following way:
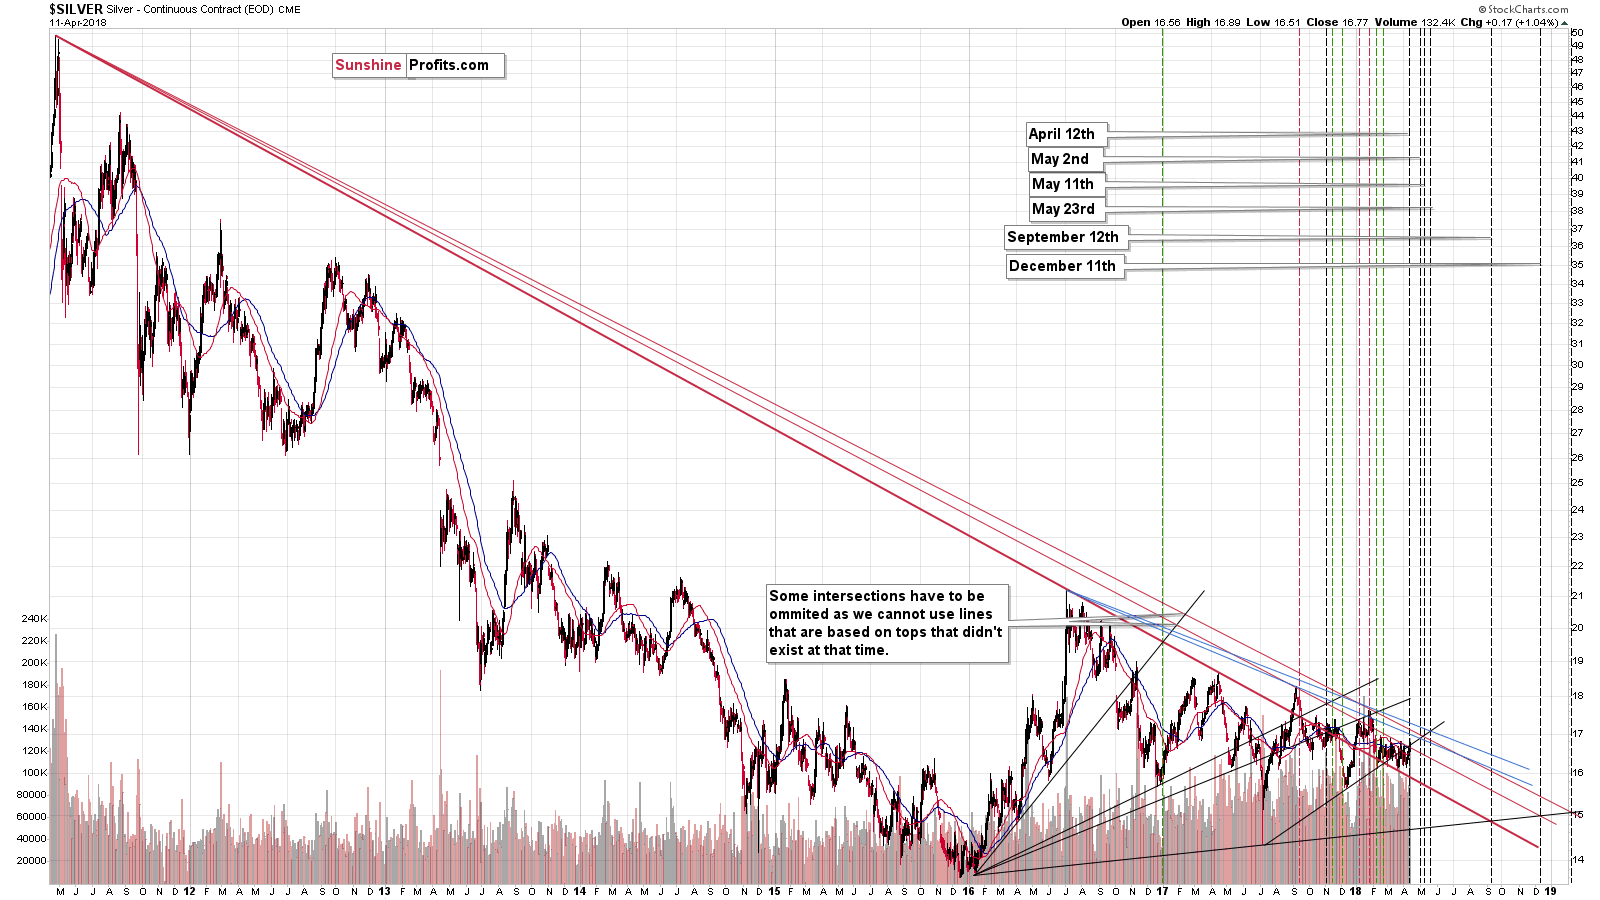
Silver’s performance seems to be now less similar to the September – December pattern as it deviates from the dashed blue line quite visibly. But, that’s not really the case. The consolidation is simply longer this time – the overall shape of both patterns is still remarkably similar. When we finally see the breakdown, the silver price is still likely to move lower in a decisive fashion, just as it moved lower in November and December 2017. When that happens, we’ll simply adjust the declining dashed blue line to the most recent local high in order to get the approximate bottom estimation.
Is silver still likely to form a local bottom later this week? It’s certainly possible – after all, it’s silver and silver is known to do crazy things from time to time (early July 2017). However, it’s also possible that silver moves back and forth with the final intraday top on Thursday or so. Then, the decline would follow.
In other words, we’re likely to substantially profit on the decline in the precious metals market either right away or in a few days. Does it really matter if we have to wait additional several days? Not really.
In yesterday’s alert, we added the following:
At that time the scenario in which silver tops tomorrow or close to it (meaning possibly today) is now much more likely than a sudden 2-day decline.
Silver has indeed reversed and we adjusted the declining dashed blue line on the silver chart accordingly. If the current decline in the white metal is going to be similar to the January – February 2018 one, then we can expect silver to bottom a bit before the end of the month. However, there is a medium-term triangle-apex-based reversal at about April 23rd, so we might see an initial bottom at that time. This would be in tune with how silver bottomed in December – there was an initial bottom several days before the final one in terms of the daily closing prices.
Finally, we would like to point out that yesterday’s intraday rally didn’t change anything regarding silver’s oscillating pattern. Its important implications remain up-to-date. You can read more about them in Tuesday’s Alert.
Gold Stocks’ Reversals
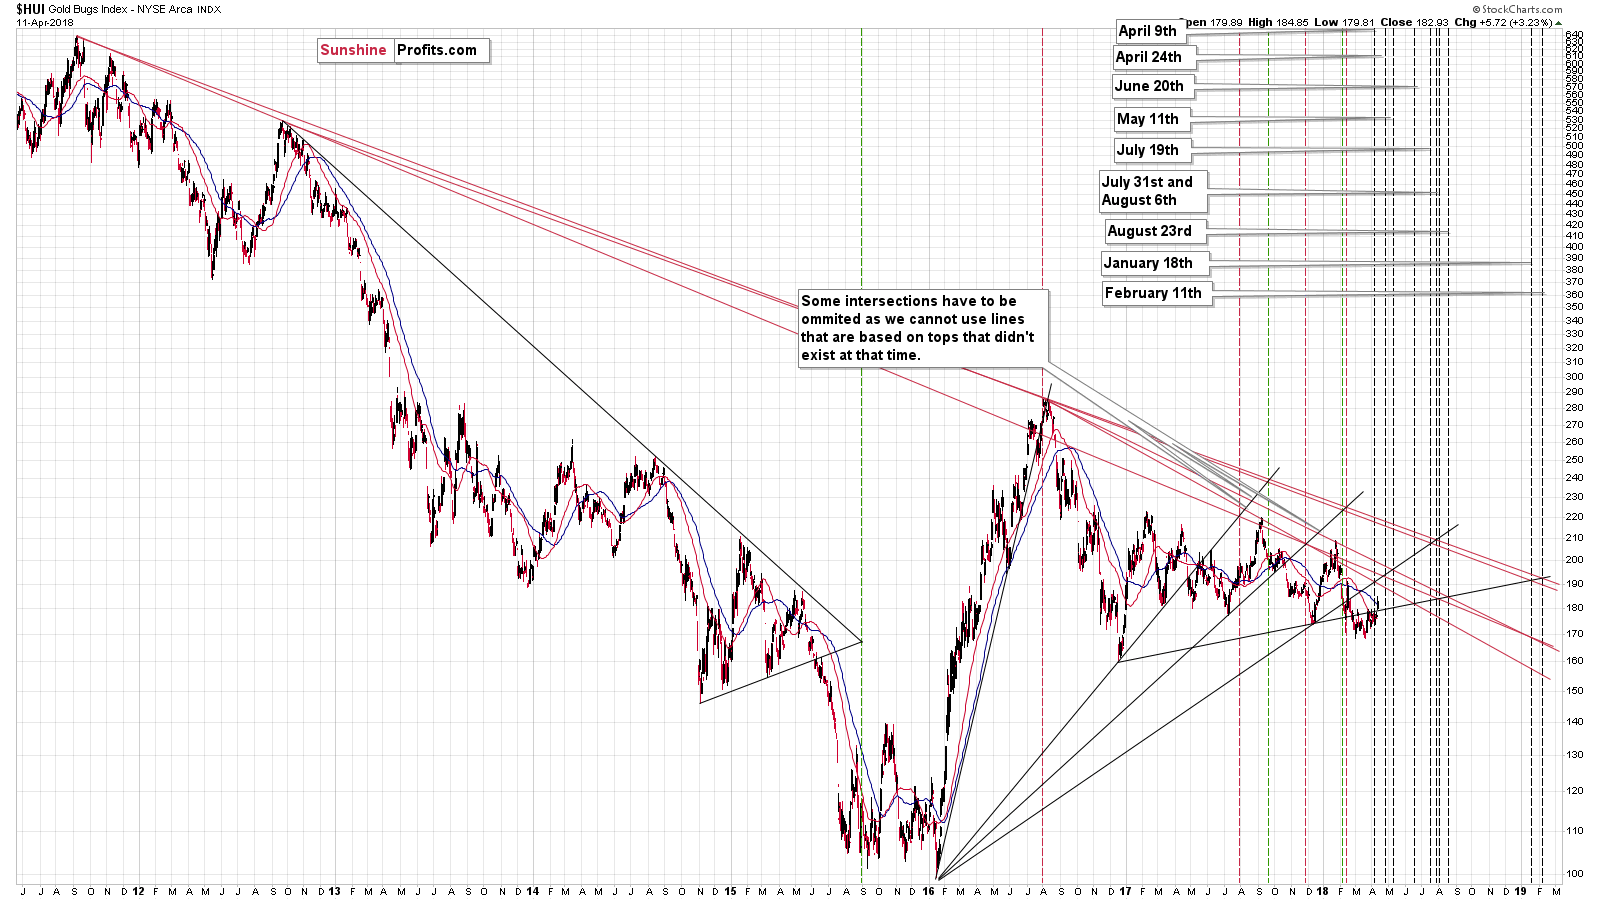
There were actually two reversals in mining stocks – one to the upside that we saw earlier this week and one yesterday – both could be the result of the current triangle-apex-based reversal. Either way, the implications are now bearish.
The reversal in mining stocks was also accompanied by huge volume. Since the all 3 key parts of the precious metals market reversed at the same time and they were all accompanied by huge volume, the implications are very important.
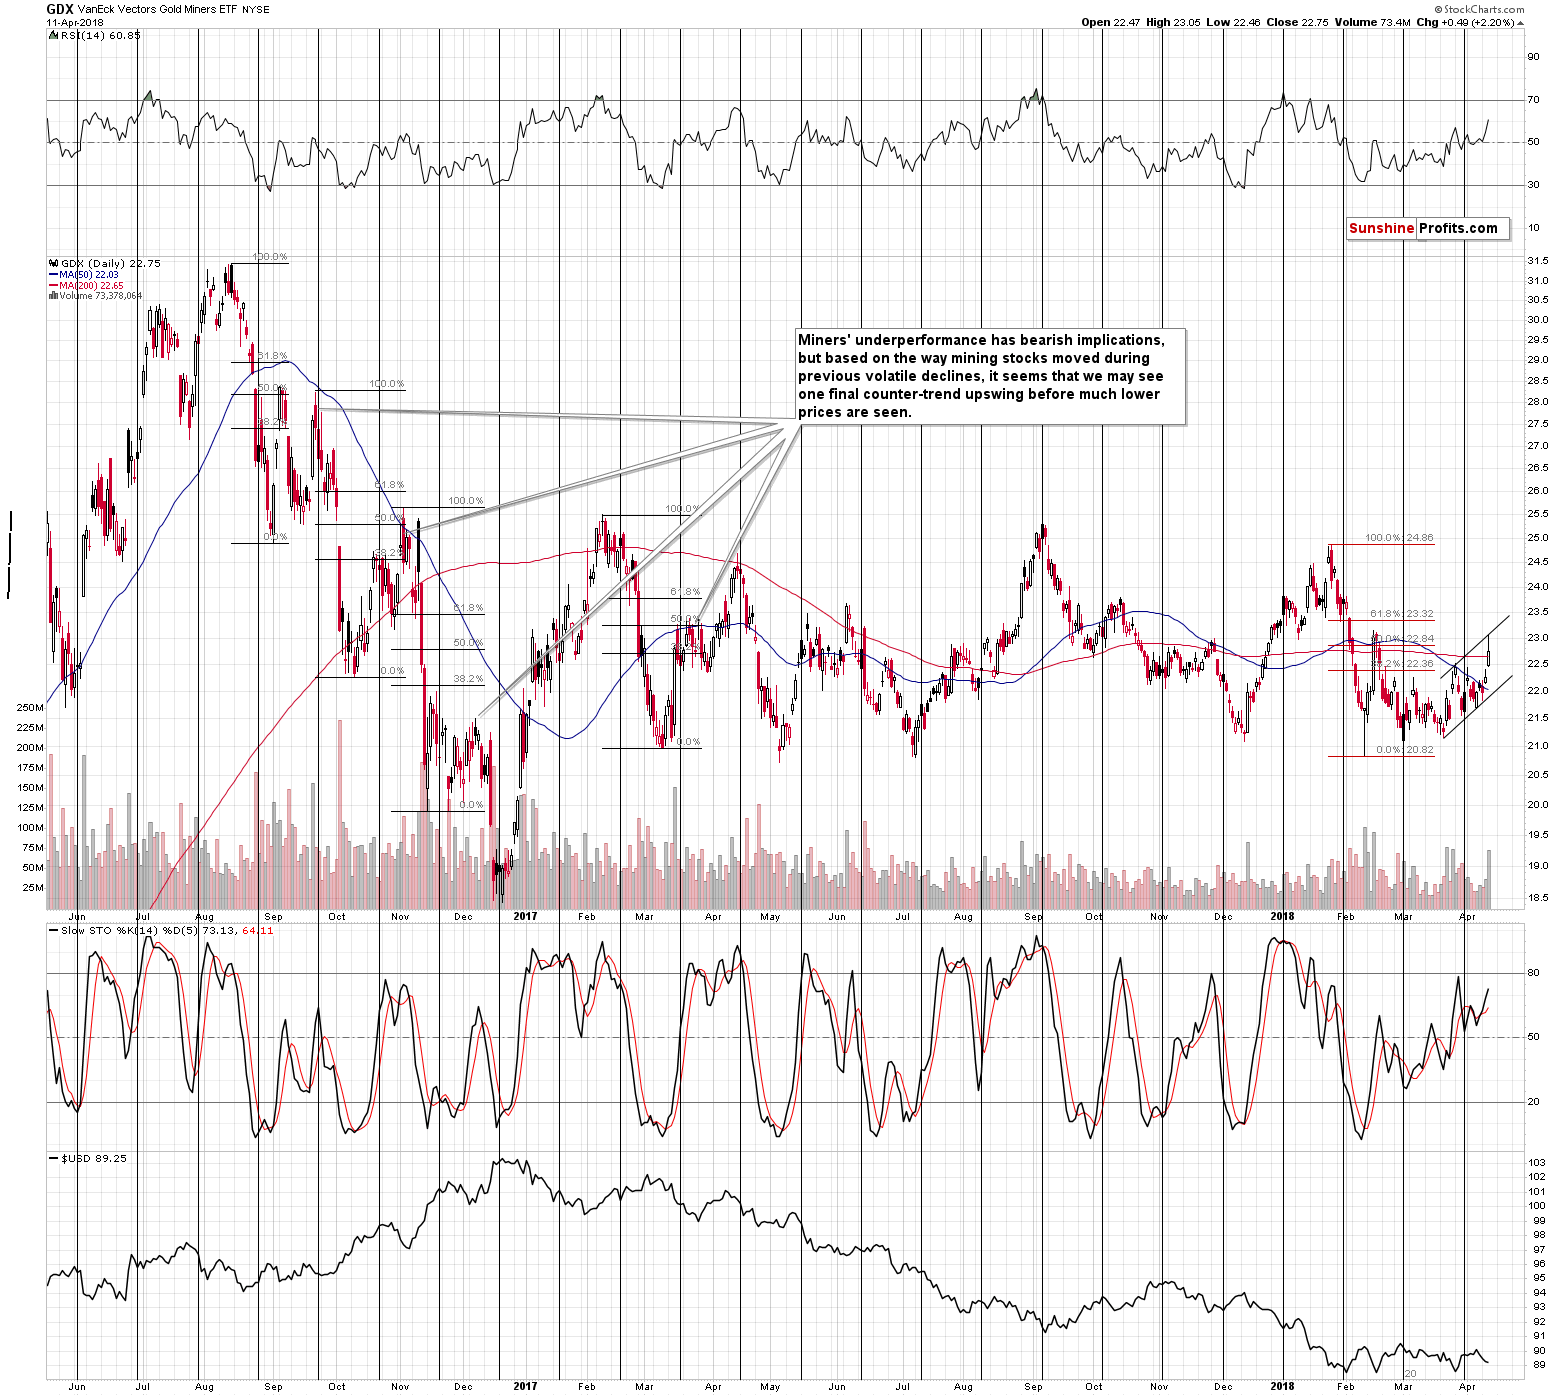
It’s interesting that GDX’s upswing was as big as the late-March rally. Miners tend to correct in the zigzag form and that’s what we saw in this case. Since this pattern is common during corrections, it’s even more likely that what we saw was just a correction within a downtrend, not a new uptrend.
Also, please note that many weeks ago, we wrote that mining stocks could rally once more to the previous local high (the mid-February 2018 high) and we left this description on the above chart as a reminder. It seems that yesterday’s rally was exactly that – the final comeback to the previous interim high before the slide can continue. Miners have not broken out of the previous bearish patterns – they are following them.
While we’re discussing the GDX ETF, we would like to remind you about the highly effective, but quiet signal that we saw recently.
Miner’s Quiet Signal
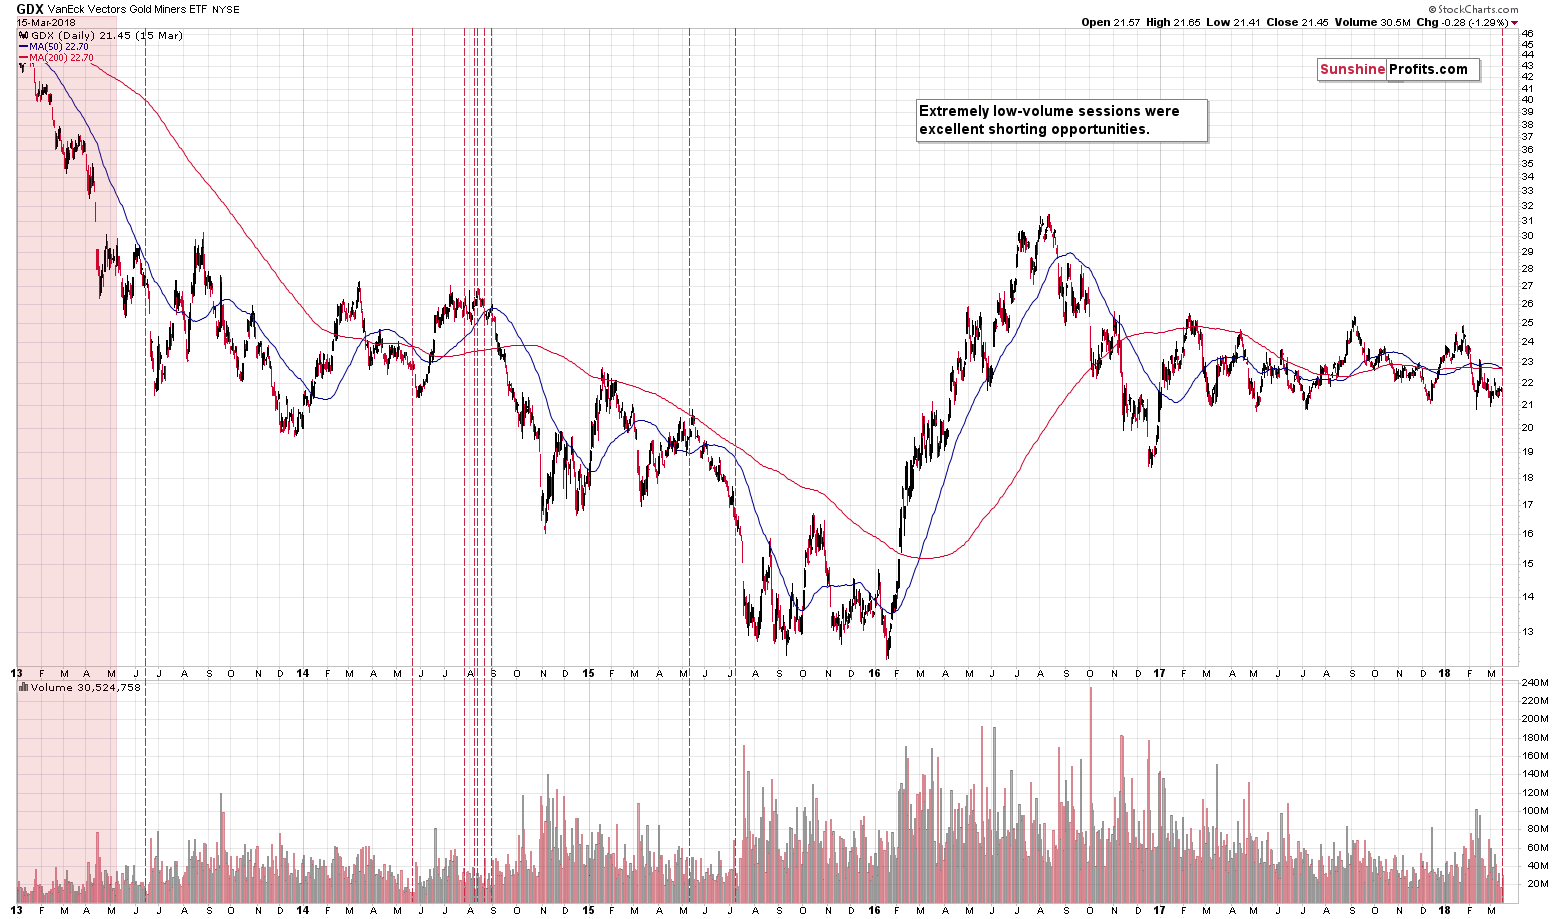
As we discussed in detail in the March 15 Alert, GDX’s volume was recently extremely low – lowest in years. The implications were and still are very bearish for the medium term. You might be wondering if the recent very short-term upswing invalidated the bearish implications of this signal.
Not at all.
In most cases the extremely low volume readings were followed by a decline immediately, but in the remaining cases we saw a small short-term upswing… and then a huge decline that was many times bigger than the preceding short-term upswing. Sooner or later, mining stocks always (at least in the past 5 years) declined in a profound manner. We saw a short-term upswing recently, which is also in tune with the past cases and the bearish implications remain intact.
Finally, we would like put the recent upswing into the big perspective. Also from this point of view, the rally is not a bullish deviation from a bearish pattern – it’s part of the pattern.
During the 2012 – 2013 decline, there was a corrective upswing, during which gold stocks corrected to about the 38.2% Fibonacci retracement level. We saw exactly the same thing yesterday. We marked the retracements in blue, so please see for yourself.
The short-term rally was therefore a natural part of the much bigger decline, not it’s end.
USD’s Verification
Before summarizing, we would like to provide you with a quick update on the USD Index. In yesterday’s alert, we wrote the following:
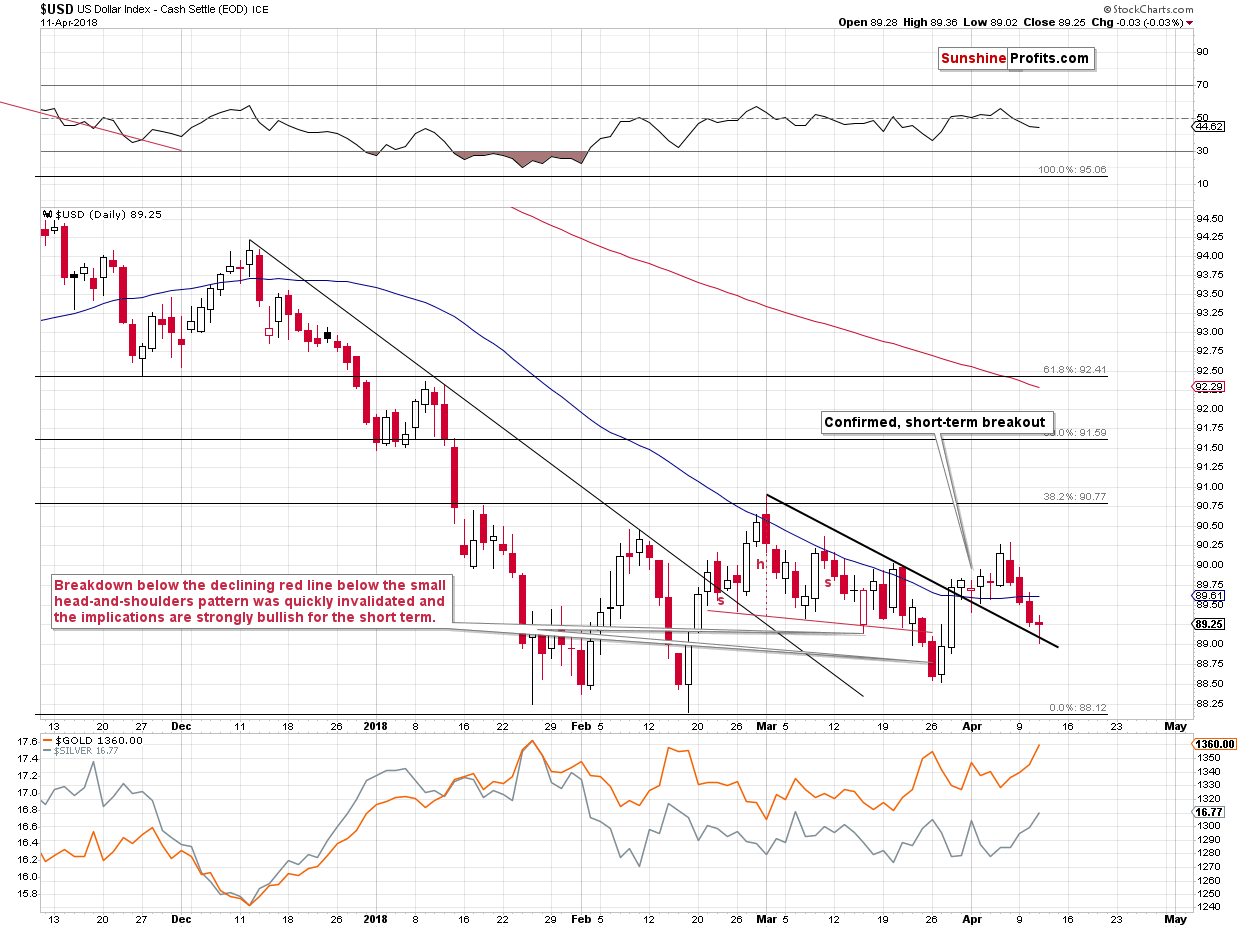
(…) the USD Index is practically at the declining support line, so it might be the case that the move higher in the EUR/USD and the move lower in the USDX is just a verification of the late-March breakout. The move back below the 50-day moving average along with sell signals from the indicators paint a bearish picture, but the mentioned support line could stop the decline.
Yesterday’s reversal was seen not only in the precious metals sector, but also in the USD Index. Interestingly, the USD Index reversed right after touching the declining support line. It seems that the late-March breakout was just verified. This bodes well for the USD Index’s medium-term future and the opposite is the case for the precious metals market.
Summary
Summing up, it seems that we have just seen a major reversal in the entire precious metals sector, which is confirmed not only by significant price movement, but also by huge volume levels. The fact that it happened during the triangle-apex-based reversal week makes it highly likely that yesterday’s reversal was the reversal that starts a big decline in the precious metals sector.
As always, we will keep you – our subscribers – informed.
To summarize:
Trading capital (supplementary part of the portfolio; our opinion): Full short positions (200% of the full position) in gold, silver and mining stocks are justified from the risk/reward perspective with the following stop-loss orders and initial target price levels:
- Gold: initial target price: $1,218; stop-loss: $1,382; initial target price for the DGLD ETN: $53.98; stop-loss for the DGLD ETN $37.68
- Silver: initial target price: $14.63; stop-loss: $17.33; initial target price for the DSLV ETN: $33.88; stop-loss for the DSLV ETN $21.48
- Mining stocks (price levels for the GDX ETF): initial target price: $19.22; stop-loss: $23.54; initial target price for the DUST ETF: $39.88; stop-loss for the DUST ETF $21.46
In case one wants to bet on junior mining stocks' prices (we do not suggest doing so – we think senior mining stocks are more predictable in the case of short-term trades – if one wants to do it anyway, we provide the details), here are the stop-loss details and initial target prices:
- GDXJ ETF: initial target price: $27.82; stop-loss: $36.14
- JDST ETF: initial target price: $94.88 stop-loss: $41.86
Long-term capital (core part of the portfolio; our opinion): No positions (in other words: cash)
Insurance capital (core part of the portfolio; our opinion): Full position
Important Details for New Subscribers
Whether you already subscribed or not, we encourage you to find out how to make the most of our alerts and read our replies to the most common alert-and-gold-trading-related-questions.
Please note that the in the trading section we describe the situation for the day that the alert is posted. In other words, it we are writing about a speculative position, it means that it is up-to-date on the day it was posted. We are also featuring the initial target prices, so that you can decide whether keeping a position on a given day is something that is in tune with your approach (some moves are too small for medium-term traders and some might appear too big for day-traders).
Plus, you might want to read why our stop-loss orders are usually relatively far from the current price.
Please note that a full position doesn’t mean using all of the capital for a given trade. You will find details on our thoughts on gold portfolio structuring in the Key Insights section on our website.
As a reminder – “initial target price” means exactly that – an “initial” one, it’s not a price level at which we suggest closing positions. If this becomes the case (like it did in the previous trade) we will refer to these levels as levels of exit orders (exactly as we’ve done previously). Stop-loss levels, however, are naturally not “initial”, but something that, in our opinion, might be entered as an order.
Since it is impossible to synchronize target prices and stop-loss levels for all the ETFs and ETNs with the main markets that we provide these levels for (gold, silver and mining stocks – the GDX ETF), the stop-loss levels and target prices for other ETNs and ETF (among other: UGLD, DGLD, USLV, DSLV, NUGT, DUST, JNUG, JDST) are provided as supplementary, and not as “final”. This means that if a stop-loss or a target level is reached for any of the “additional instruments” (DGLD for instance), but not for the “main instrument” (gold in this case), we will view positions in both gold and DGLD as still open and the stop-loss for DGLD would have to be moved lower. On the other hand, if gold moves to a stop-loss level but DGLD doesn’t, then we will view both positions (in gold and DGLD) as closed. In other words, since it’s not possible to be 100% certain that each related instrument moves to a given level when the underlying instrument does, we can’t provide levels that would be binding. The levels that we do provide are our best estimate of the levels that will correspond to the levels in the underlying assets, but it will be the underlying assets that one will need to focus on regarding the signs pointing to closing a given position or keeping it open. We might adjust the levels in the “additional instruments” without adjusting the levels in the “main instruments”, which will simply mean that we have improved our estimation of these levels, not that we changed our outlook on the markets. We are already working on a tool that would update these levels on a daily basis for the most popular ETFs, ETNs and individual mining stocks.
Our preferred ways to invest in and to trade gold along with the reasoning can be found in the how to buy gold section. Additionally, our preferred ETFs and ETNs can be found in our Gold & Silver ETF Ranking.
As a reminder, Gold & Silver Trading Alerts are posted before or on each trading day (we usually post them before the opening bell, but we don't promise doing that each day). If there's anything urgent, we will send you an additional small alert before posting the main one.
=====
Latest Free Trading Alerts:
Everyone focuses now on the chemical attack in Syria. Meanwhile, the most important turnover in the world remains mostly unnoticed. But we’re on guard. Let’s read our analysis of the key revolution of 2018 and find out the implications for the gold market.
Coup d'État That May Shake the World
Stocks almost broke above their short-term consolidation on Tuesday, but investors' sentiment worsened again and bears took the lead on Wednesday. So, which direction is next? Stocks are expected to open higher today, but will we see another attempt at breaking above their over two-week-long trading range? There are some potentially positive news releases coming, but will they outweigh negative ones?
Earnings Season, Godsend for Bulls
=====
Hand-picked precious-metals-related links:
PRECIOUS-Gold falls from 11-week high on stronger dollar, profit-taking
=====
In other news:
China says it will fight back if U.S. escalates trade spat
Surging Libor, Once a Red Flag, Is Now a Cash Machine for Banks
Barclays to Shut $1.2 Billion of ETNs, But Do Holders Know?
People want homes, jobs, a future: no wonder they distrust capitalism now
=====
Thank you.
Sincerely,
Przemyslaw Radomski, CFA
Founder, Editor-in-chief, Gold & Silver Fund Manager
Gold & Silver Trading Alerts
Forex Trading Alerts
Oil Investment Updates
Oil Trading Alerts

