

Briefly: In our opinion, full (150% of the regular size of the position) speculative short positions in gold, silver and mining stocks are justified from the risk/reward perspective at the moment of publishing this alert.
The USD Index moved lower yesterday and gold reacted in the normal way. It rallied and silver followed gold’s lead. But not mining stocks. After a brief upswing, they reversed and ended the session much lower, establishing the second lowest close of 2018. Why did the miners decline, if the price of their product and source of revenue – gold – moved up in value? One could blame it on a tide that sinks all the boats – a declining general stock market, but… The S&P 500 actually moved slightly higher yesterday.
Let’s start today’s analysis with what started the previous paragraph – the USD Index (chart courtesy of http://stockcharts.com).
USD’s Outlook
In short, our yesterday’s comments on the short- and long-term charts remain up-to-date:
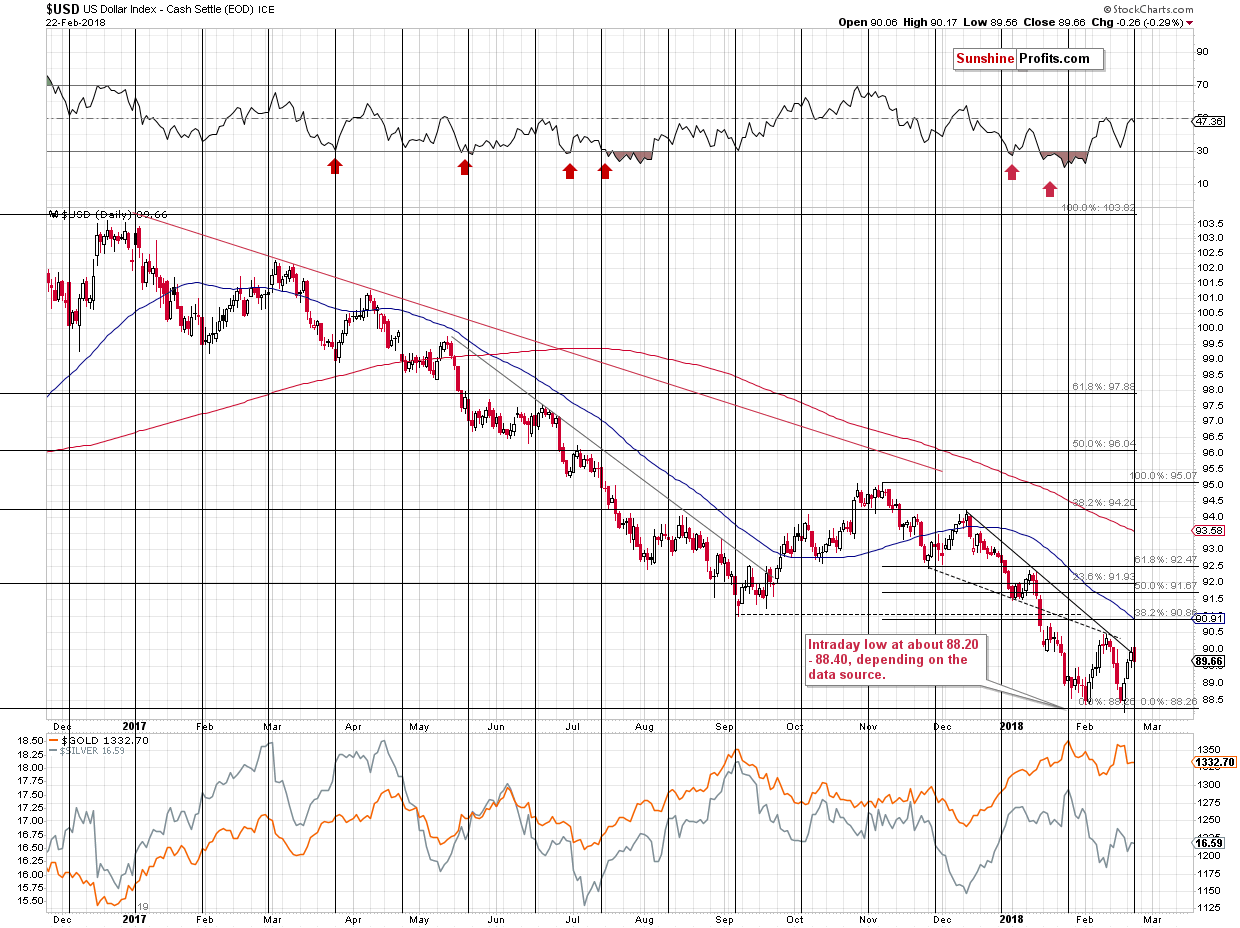
During Friday’s trading, the USD Index moved very insignificantly below the previous 2018 low and rallied back up, invalidating almost all breakdowns below important support levels. The remaining breakdown was invalidated yesterday in a clear way, so the outlook improved further.
The chart above shows how significant the mentioned support levels actually are. Key tops and key Fibonacci retracements based on the key price extremes. Each of them is important and their combination is even more important. The same goes for the invalidation of breakdowns – the implications are bullish.
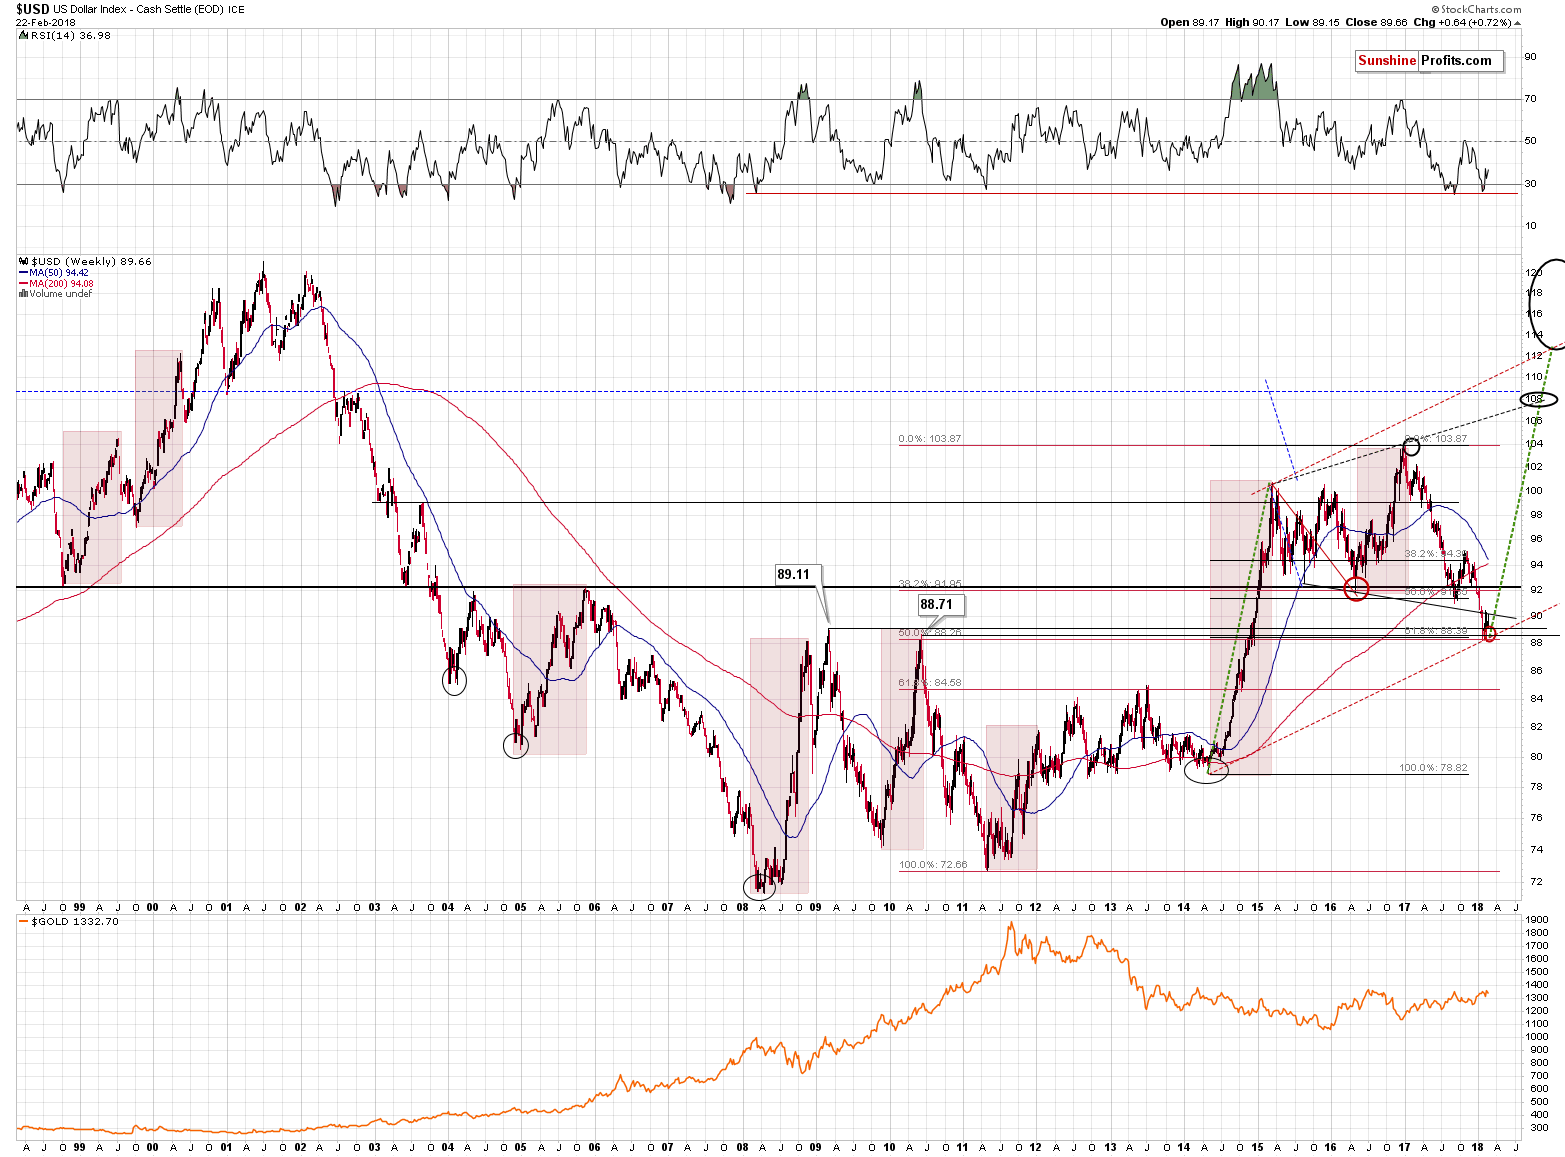
Please note that earlier this year the USD Index broke below the declining support / resistance line based on the mid-2015 and 2016 lows and this breakdown was verified recently. This is a bearish technical development, however, the combination of the 2009 and 2010 tops along with 2 major retracements based on major extremes (marked in red and black on the above chart) is much stronger than the mentioned declining line. The reason is that the mid-2015 and 2016 lows are less prominent than the 2009 and 2010 tops and the line based on the former is not strengthened by key Fibonacci retracements, while the latter is.
Consequently, the invalidation of breakdowns below the key, long-term support levels is far more important than the declining shorter-term line. That’s why, all in all, the outlook is bullish, but not bearish. At the moment of writing these words, the USD Index is trading at 89.82, so it’s very close to the mentioned line – it could even be the case that USD breaks decisively above 90 (the mentioned line is currently a bit above 90) later today. Actually, we hope that the 90 level doesn’t give up without a fight, but we expect that whether it happens shortly or in a week or so, the decisive breakout above 90 will be seen followed by a bigger rally.
Let’s take a look at the mentioned line in greater detail.
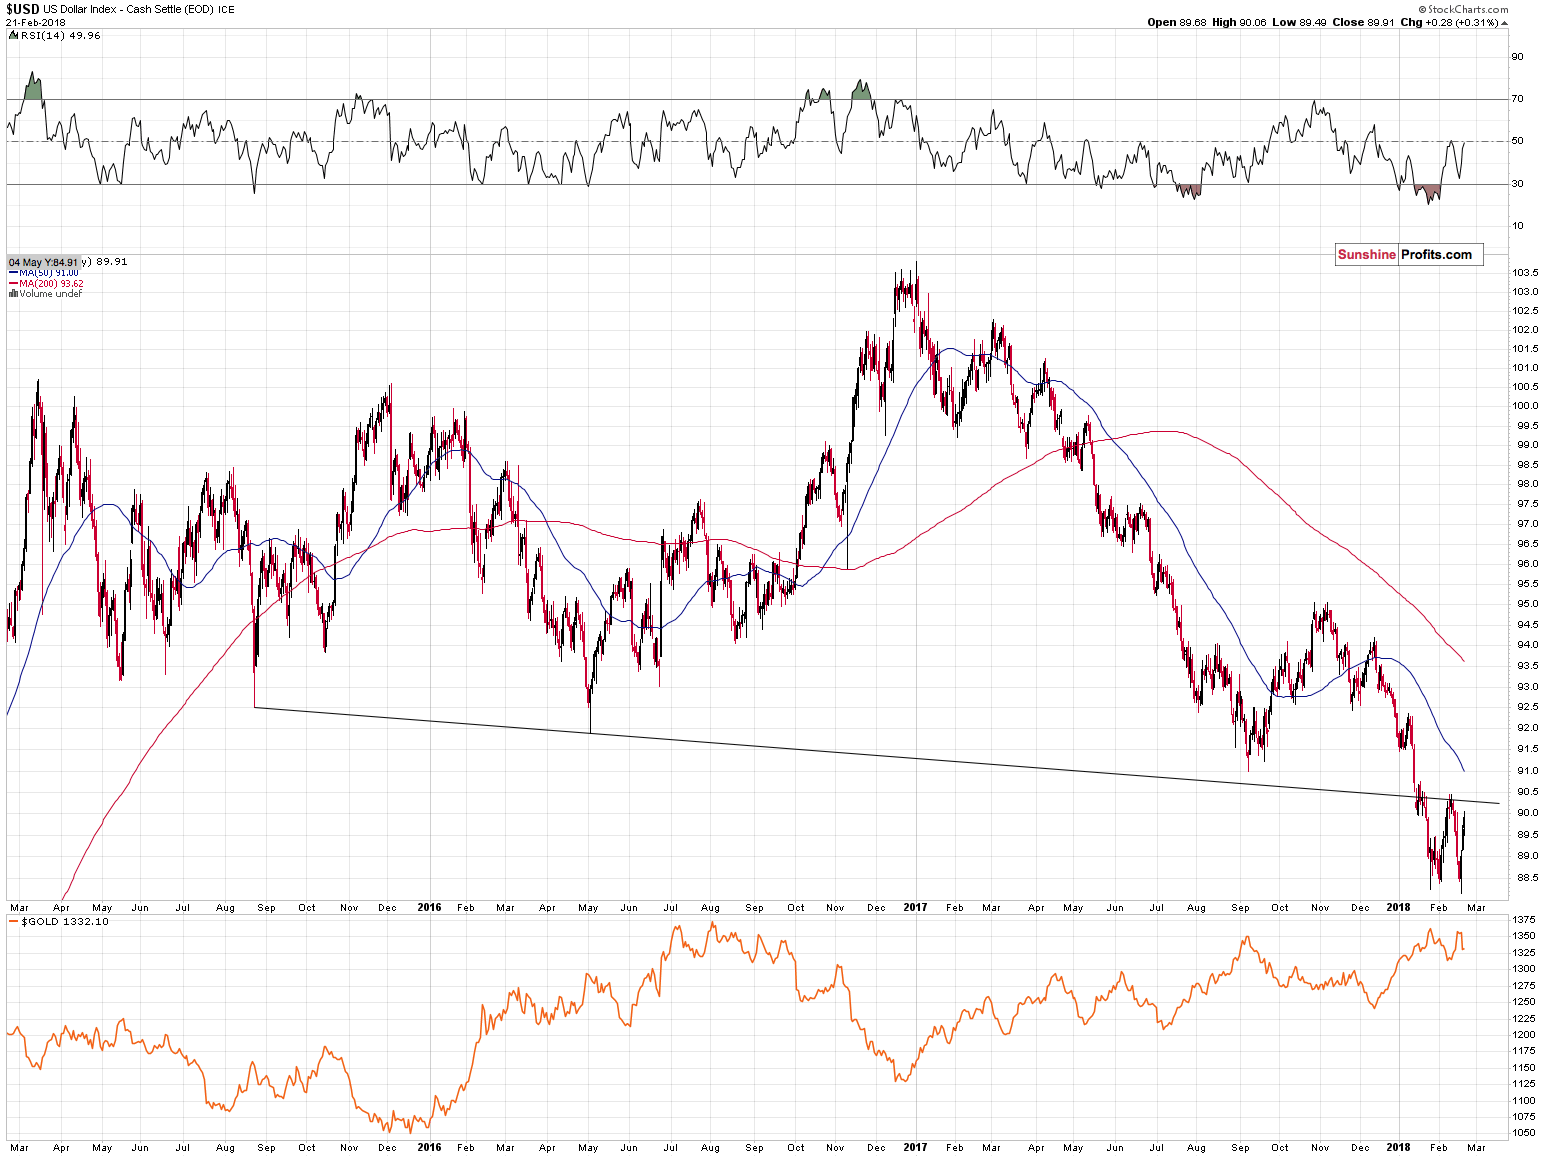
To be more precise: the declining support / resistance line is currently at about 90.20. Today’s pre-market high according to finance.yahoo.com is 90.24 and the current price at the moment of writing these words is 90.05. The USD Index is now fighting for a breakout. Still, if we see one, we won’t view the outlook as dramatically improved until the breakout is verified – preferably by a close above the previous February 2018 high (90.45).
There was already a failed attempt to move above this line, so we are skeptical toward a small breakout above it. After all, if the previous small breakout was followed by invalidation several days ago, it becomes unclear if the next breakout will be successful. We might see another small move lower or we might see a breakout right away. The latter is more probable, but based on the previous failed breakout, we wouldn’t dismiss something similar to it just yet. A confirmed breakout above 90.5 (approximation of the mentioned 90.45) will be a very good sign that the breakout above the support/resistance line is going to hold and that the final bottom is definitely in for the USD Index.
The mentioned support / resistance line is not willing to give up without a fight and this may be a blessing for us. If the USD Index moves to 89.11 or so (the highest of the nearby long-term support levels), we might see yet another very bearish confirmation, which would make the overall outlook for the short term even more bearish. In consequence, we might increase the speculative short position even further. Again, that is a big “if” at this moment and we’ll keep monitoring the market and report to you accordingly.
Gold, Silver and their Ratio
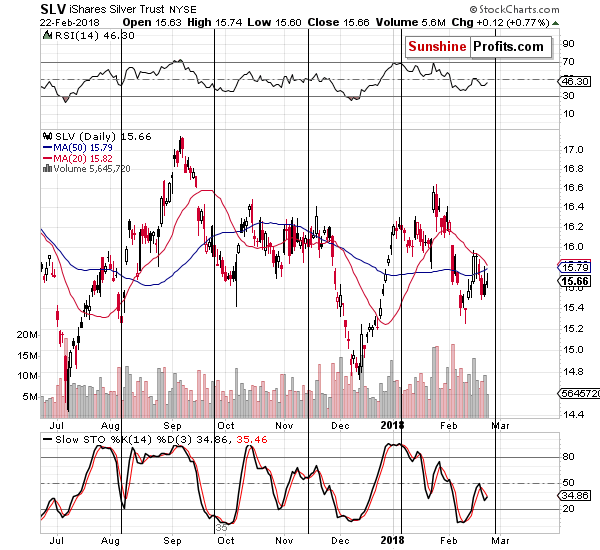
SLV moved once again attempted to rally above the moving averages and once again it failed. On Wednesday, SLV managed to move above the 50-day moving average and during yesterday’s trading, it didn’t even manage to do that. Yesterday’s small upswing took place on low volume, which makes the overall impact of the entire session rather bearish.
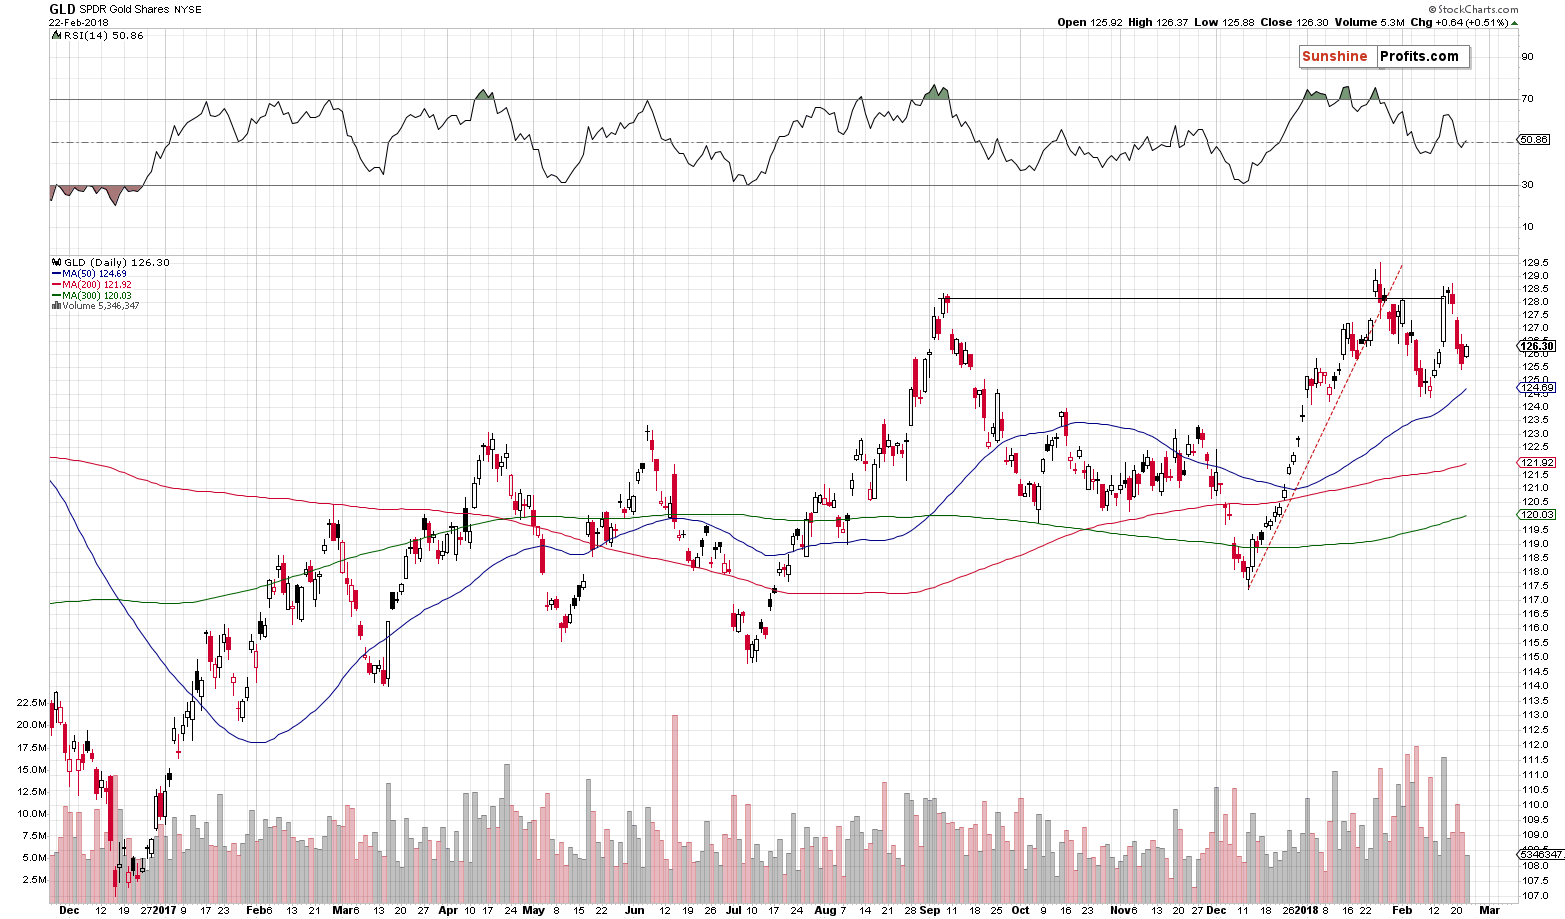
GLD moved higher and this upswing was also accompanied by low volume. This means that the upswing was most likely a breather during a decline, not the start of a new upleg. Still, GLD’s reaction was quite natural given the daily move lower in the USD Index. We can’t say the same about the mining stocks performance relative to virtually any other market. Before we move the above, we would like to zoom out and give you a quick update on the ratio between the two key precious metals.
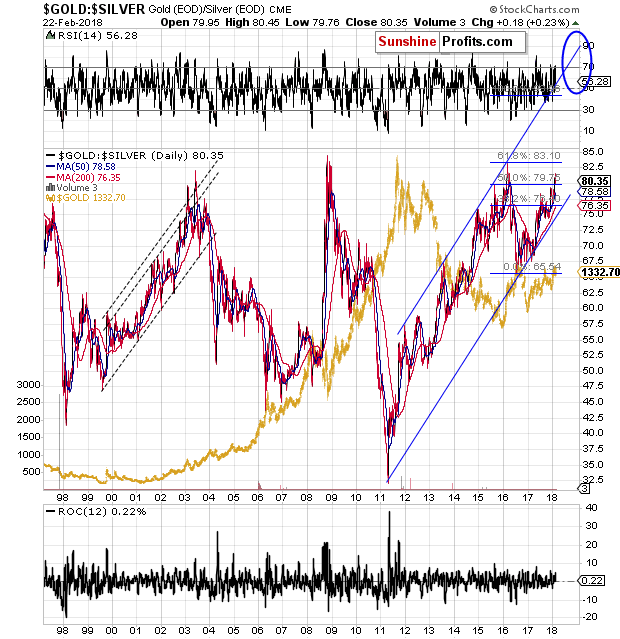
In the previous alerts and articles we explained that the ratio was likely to rally well above the previous highs of the past decades and we provided our argumentation for it. Since we wrote our previous analysis, quite a lot has happened and it has become obvious that the bottoming time for gold (and topping time for the ratio) will be delayed, but this hasn’t changed anything regarding the price levels that they are both likely to reach. You can read the analysis here.
Making a long story short, the “final highs” that seem to be a key resistance level on the above chart, really aren’t so final.
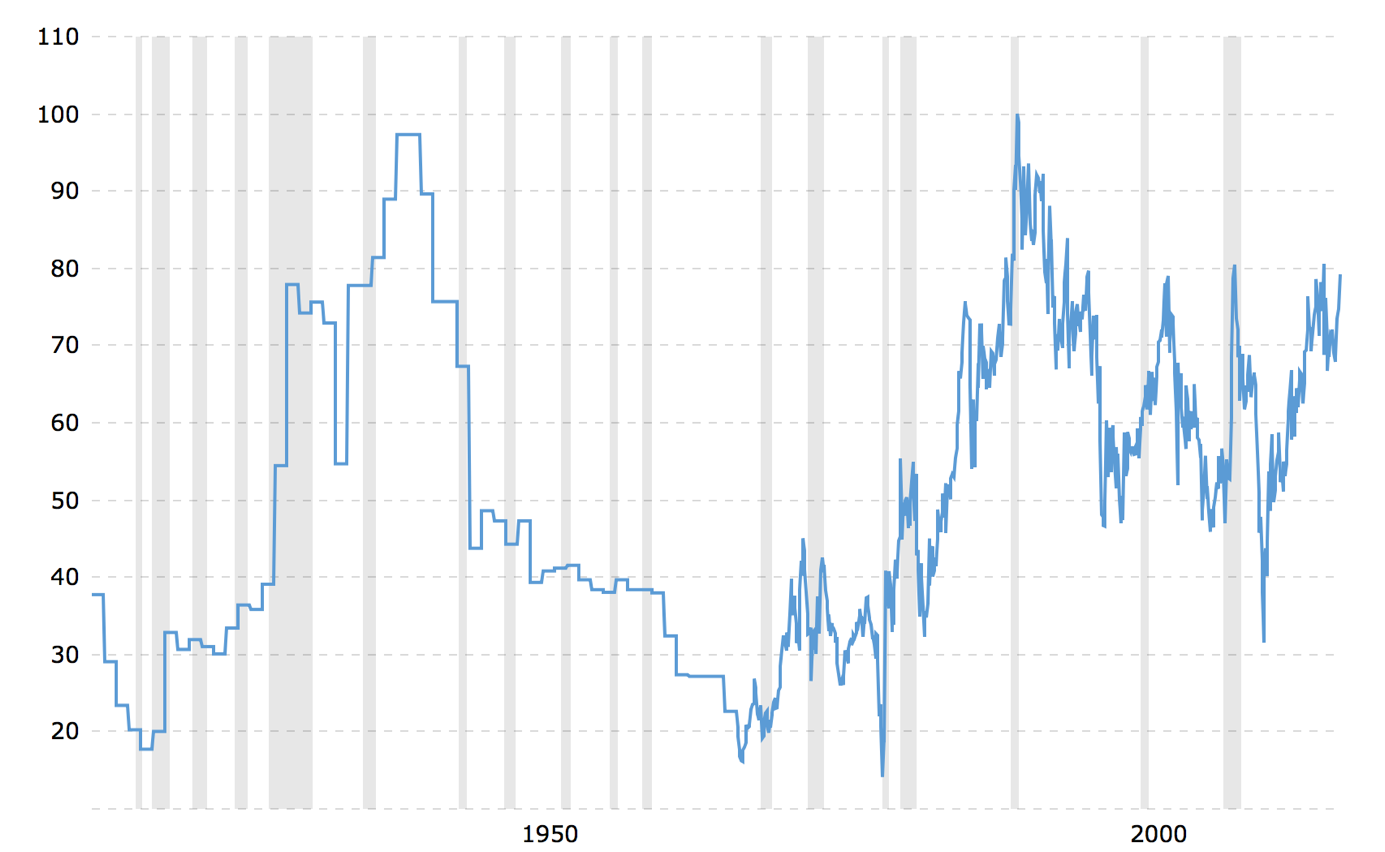
The true long-term resistance is higher – approximately at the 100 level.
Now, the gold to silver ratio is approaching the previous highs, in line with what we wrote previously. If things continue to develop in this direction – and it certainly appears to be the likely outcome – we could see a breakout shortly. The above would serve as a major bearish confirmation for the precious metals market.
When that happens, you’ll probably read somewhere that the ratio is extremely overbought and that it has to go lower – keeping the above chart in mind will help you immediately mark such comments as false. The truth is that something like that has already happened before (twice) and the next target is approximately 100.
Underperformance of Mining Stocks Is Back
The USD declined, gold and silver moved higher and the general stock market closed a bit higher as well. Gold stocks should have rallied.
Gold stocks declined. And they declined very visibly.
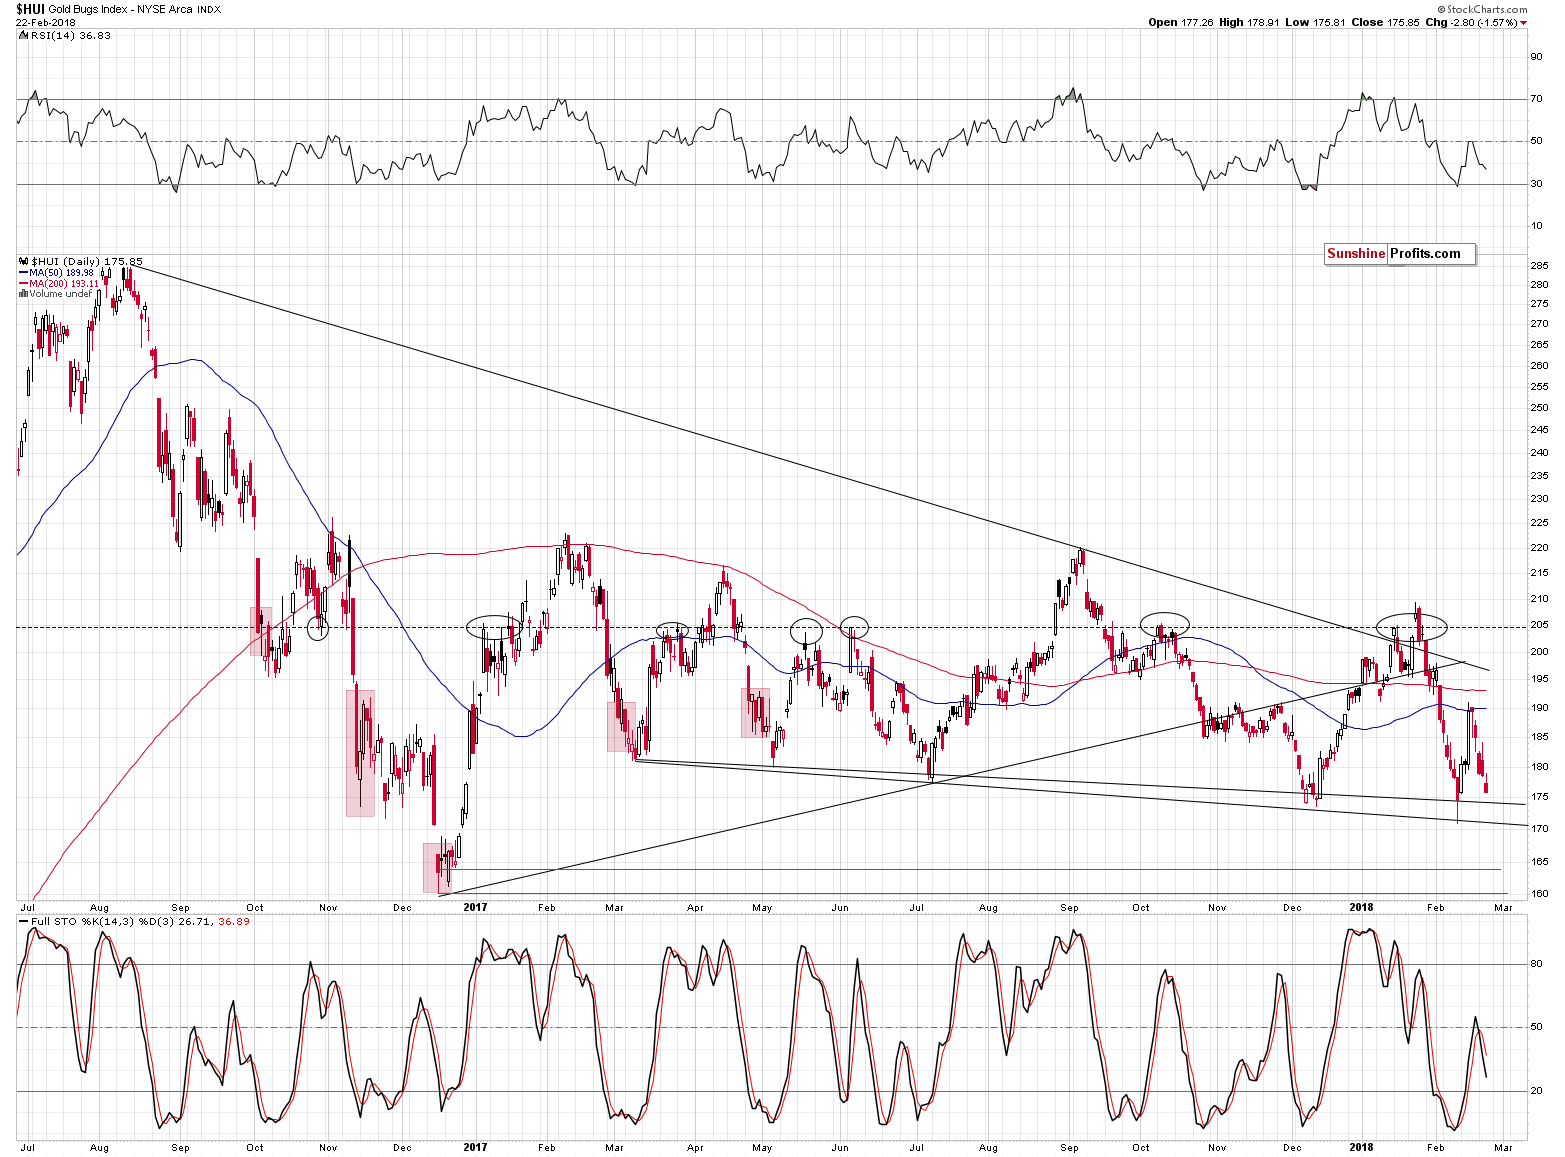
The HUI Index moved more than 1.5% lower on the day when gold rallied, which is very significant. We recently commented on the ways in which one can measure gold miners’ under- and outperformance. We wrote the following:
Firstly, you can look at the percentage change on each day. This will not detect any subtle out- and underperformance cases, but it's enough for the big ones. For instance, if gold is up by $4 or so and gold stocks are down 1% - it's clear that the mining stocks are underperforming on that day. If the case is not that obvious, we look at what was the usual way in which miners recently performed relative to gold. Did it change and how significantly? If gold's rallies used to be magnified 2x during a certain rally, but now it quickly declined to 1.5x, the 1x, then 0.5x and then to just 0.1x - it's a clear case of underperformance and a bearish signal.
It's kind of funny, because what we saw yesterday was even more prominent than what we provided as a rather extreme example of underperformance. Gold was up over $6 and miners were down over 1.5%. The implications are clearly bearish here.
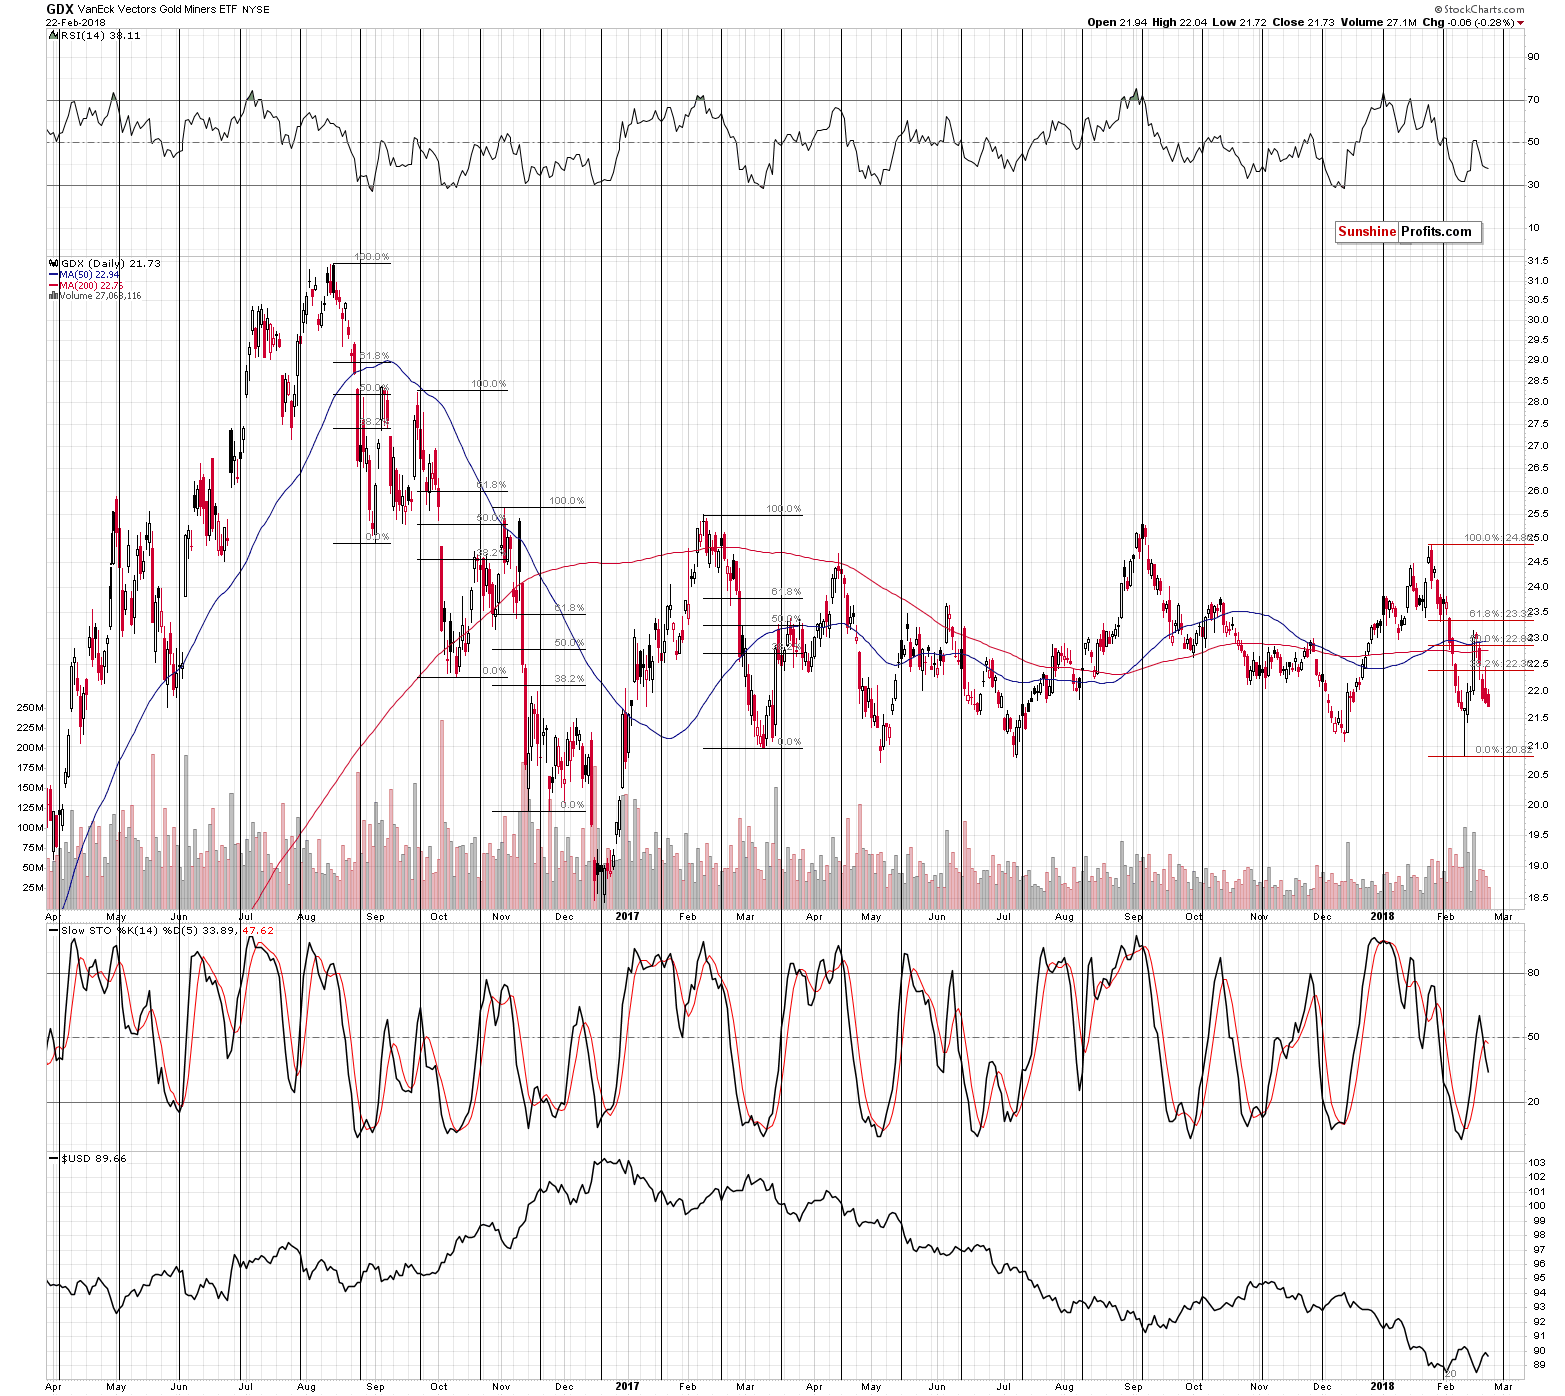
The fact that gold stocks are only a bit above the lowest close of the year only adds to the bearishness here. The same goes for the sell signal from the Stochastic indicator.
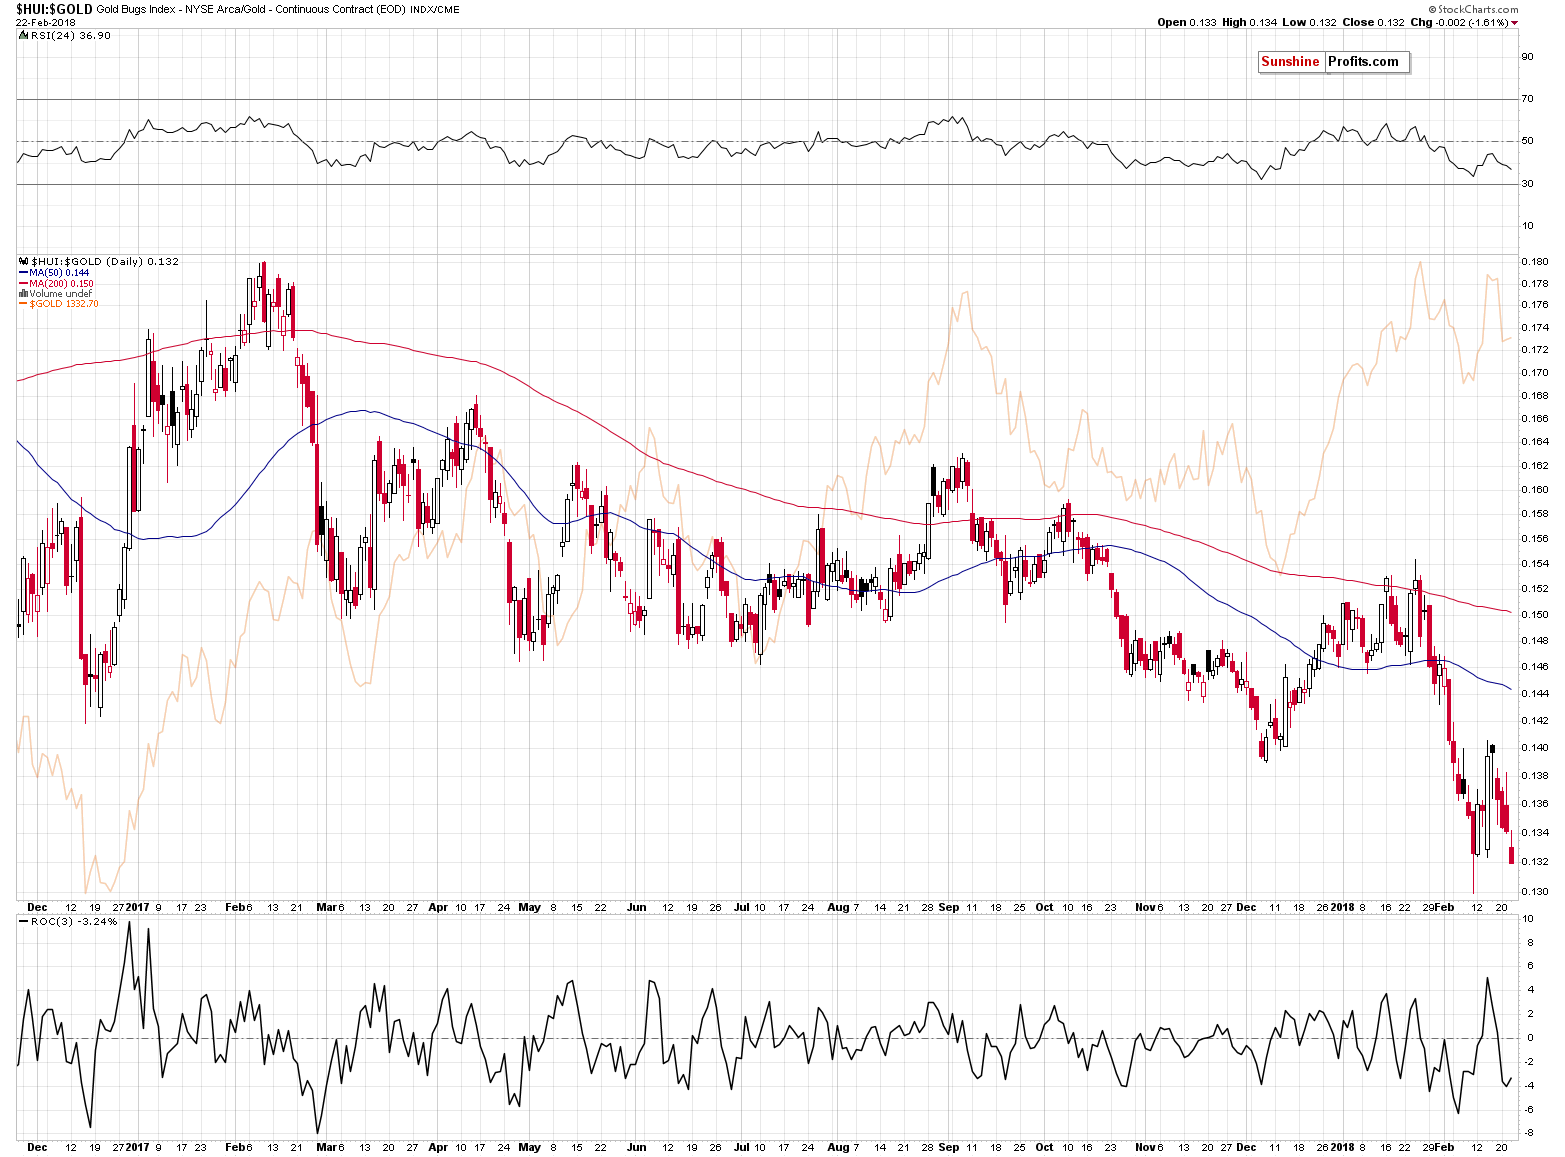
In terms of the gold to HUI Index ratio, we already saw a breakdown to new lows. The recent rally proved to have been just a verification of the breakdown below the 2016 and 2017 lows. With this breakdown confirmed and a new breakdown below the 2018 low, the road is open to much bigger declines.
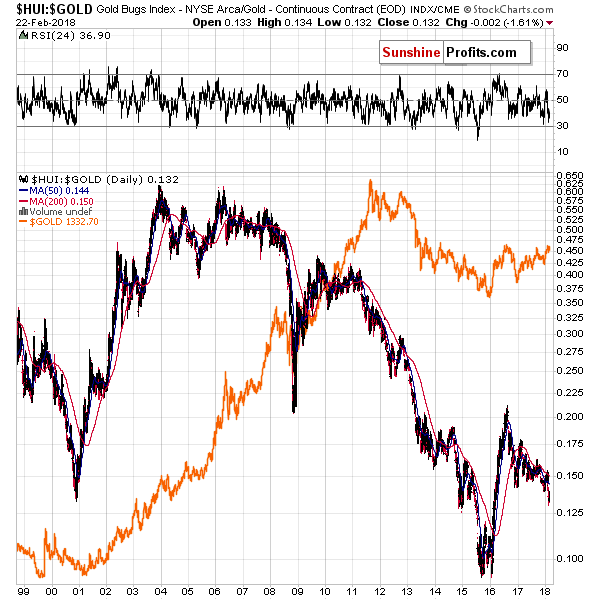
Those, who are bullish on gold probably will not want to believe this, but the next reasonable support is all the way down at the 2015 and 2016 lows. This means mining stocks underperforming gold for weeks are not only not extreme. Conversely, in light of the confirmed breakdown, it’s likely to become the new normal for the precious metal sector – possibly for several months.
Surely, there will be very short-term deviations from the above rule, but the overall trend seems quite clear for the following months.
However, on a short-term basis, the above doesn’t rule out another move higher in the entire precious metals sector as in the previous similarly volatile declines there was more than one corrective upswing. The history doesn’t have to repeat to the letter here, but it’s certainly possible.
If the USD Index continues to trade back and forth below the 90.20 level, or we even see a bigger decline to 89.11 or so, gold, silver and mining stocks could rally. In fact, that would be the ideal scenario if silver outperforms gold and miners lag during such rally. We hope to see something like that as that would serve as an opportunity to increase the size of our short position even further, but if PMs decline right away and bring us immediate profits, it won’t be that bad either.
Summary
Summing up, the top in gold, silver and mining stocks is most likely in and yesterday’s extreme underperformance of mining stocks confirms it along with silver’s significant outperformance, which we saw on Wednesday. Moreover, since the USD Index just invalidated breakdowns below its key support levels, it’s likely to rally, which is likely to contribute to lower precious metals prices in the coming weeks.
As always, we will keep you – our subscribers – informed.
To summarize:
Trading capital (supplementary part of the portfolio; our opinion): Full short positions (150% of the full position) in gold, silver and mining stocks are justified from the risk/reward perspective with the following stop-loss orders and initial target price levels:
- Gold: initial target price: $1,218; stop-loss: $1,382; initial target price for the DGLD ETN: $53.98; stop-loss for the DGLD ETN $37.68
- Silver: initial target price: $14.63; stop-loss: $17.82; initial target price for the DSLV ETN: $33.88; stop-loss for the DSLV ETN $20.88
- Mining stocks (price levels for the GDX ETF): initial target price: $19.22; stop-loss: $26.14; initial target price for the DUST ETF: $39.88; stop-loss for the DUST ETF $15.78
In case one wants to bet on junior mining stocks' prices (we do not suggest doing so – we think senior mining stocks are more predictable in the case of short-term trades – if one wants to do it anyway, we provide the details), here are the stop-loss details and initial target prices:
- GDXJ ETF: initial target price: $27.82; stop-loss: $38.22
- JDST ETF: initial target price: $94.88 stop-loss: $37.78
Long-term capital (core part of the portfolio; our opinion): No positions (in other words: cash)
Insurance capital (core part of the portfolio; our opinion): Full position
Important Details for New Subscribers
Whether you already subscribed or not, we encourage you to find out how to make the most of our alerts and read our replies to the most common alert-and-gold-trading-related-questions.
Please note that the in the trading section we describe the situation for the day that the alert is posted. In other words, it we are writing about a speculative position, it means that it is up-to-date on the day it was posted. We are also featuring the initial target prices, so that you can decide whether keeping a position on a given day is something that is in tune with your approach (some moves are too small for medium-term traders and some might appear too big for day-traders).
Plus, you might want to read why our stop-loss orders are usually relatively far from the current price.
Please note that a full position doesn’t mean using all of the capital for a given trade. You will find details on our thoughts on gold portfolio structuring in the Key Insights section on our website.
As a reminder – “initial target price” means exactly that – an “initial” one, it’s not a price level at which we suggest closing positions. If this becomes the case (like it did in the previous trade) we will refer to these levels as levels of exit orders (exactly as we’ve done previously). Stop-loss levels, however, are naturally not “initial”, but something that, in our opinion, might be entered as an order.
Since it is impossible to synchronize target prices and stop-loss levels for all the ETFs and ETNs with the main markets that we provide these levels for (gold, silver and mining stocks – the GDX ETF), the stop-loss levels and target prices for other ETNs and ETF (among other: UGLD, DGLD, USLV, DSLV, NUGT, DUST, JNUG, JDST) are provided as supplementary, and not as “final”. This means that if a stop-loss or a target level is reached for any of the “additional instruments” (DGLD for instance), but not for the “main instrument” (gold in this case), we will view positions in both gold and DGLD as still open and the stop-loss for DGLD would have to be moved lower. On the other hand, if gold moves to a stop-loss level but DGLD doesn’t, then we will view both positions (in gold and DGLD) as closed. In other words, since it’s not possible to be 100% certain that each related instrument moves to a given level when the underlying instrument does, we can’t provide levels that would be binding. The levels that we do provide are our best estimate of the levels that will correspond to the levels in the underlying assets, but it will be the underlying assets that one will need to focus on regarding the signs pointing to closing a given position or keeping it open. We might adjust the levels in the “additional instruments” without adjusting the levels in the “main instruments”, which will simply mean that we have improved our estimation of these levels, not that we changed our outlook on the markets. We are already working on a tool that would update these levels on a daily basis for the most popular ETFs, ETNs and individual mining stocks.
Our preferred ways to invest in and to trade gold along with the reasoning can be found in the how to buy gold section. Additionally, our preferred ETFs and ETNs can be found in our Gold & Silver ETF Ranking.
As a reminder, Gold & Silver Trading Alerts are posted before or on each trading day (we usually post them before the opening bell, but we don't promise doing that each day). If there's anything urgent, we will send you an additional small alert before posting the main one.
=====
Latest Free Trading Alerts:
The four eternal questions of life are as follows: Where did we come from? Why are we here? Where are we going? And are we in the gold bull or bear market? We invite you to read our today’s article about the historical secular cycles in the gold market and find out what do they imply for the future of the yellow metal.
=====
Hand-picked precious-metals-related links:
PRECIOUS-Gold heads for worst week since early Dec as dollar gains
Venezuela aims for crypto alchemy with new 'petro gold' token
=====
In other news:
Equity Investors Fleeing Wall Street Are Turning to Europe
VIX Funds Face Fresh Scrutiny From U.S. Regulators
=====
Thank you.
Sincerely,
Przemyslaw Radomski, CFA
Founder, Editor-in-chief, Gold & Silver Fund Manager
Gold & Silver Trading Alerts
Forex Trading Alerts
Oil Investment Updates
Oil Trading Alerts

