

Briefly: In our opinion, small (100% of the regular size of the position) speculative long positions in gold, silver and mining stocks are justified from the risk/reward perspective at the moment of publishing this alert.
Metals and miners soared on Wednesday, but nothing like that happened yesterday. The momentum seems to be gone and there are already voices that this means that the rally is over. But is this really the case? Surely, the chart that shows the one-day stagnation can’t provide any insight, right? Wrong. In today’s alert, we show you just how meaningful a pause could be.
Before jumping into the bigger charts, let’s keep in mind that we’ll see on the Stockcharts pictures, is likely a result of an error. Namely, there was no big turnaround on Wednesday and thus yesterday’s moves were indeed a pause (a small decline in the case of silver) and not anything else. To make it clear, we’re starting today’s alert with the intraday charts from Kitco.
Having said that, let’s move to the gold chart (chart courtesy of http://stockcharts.com).
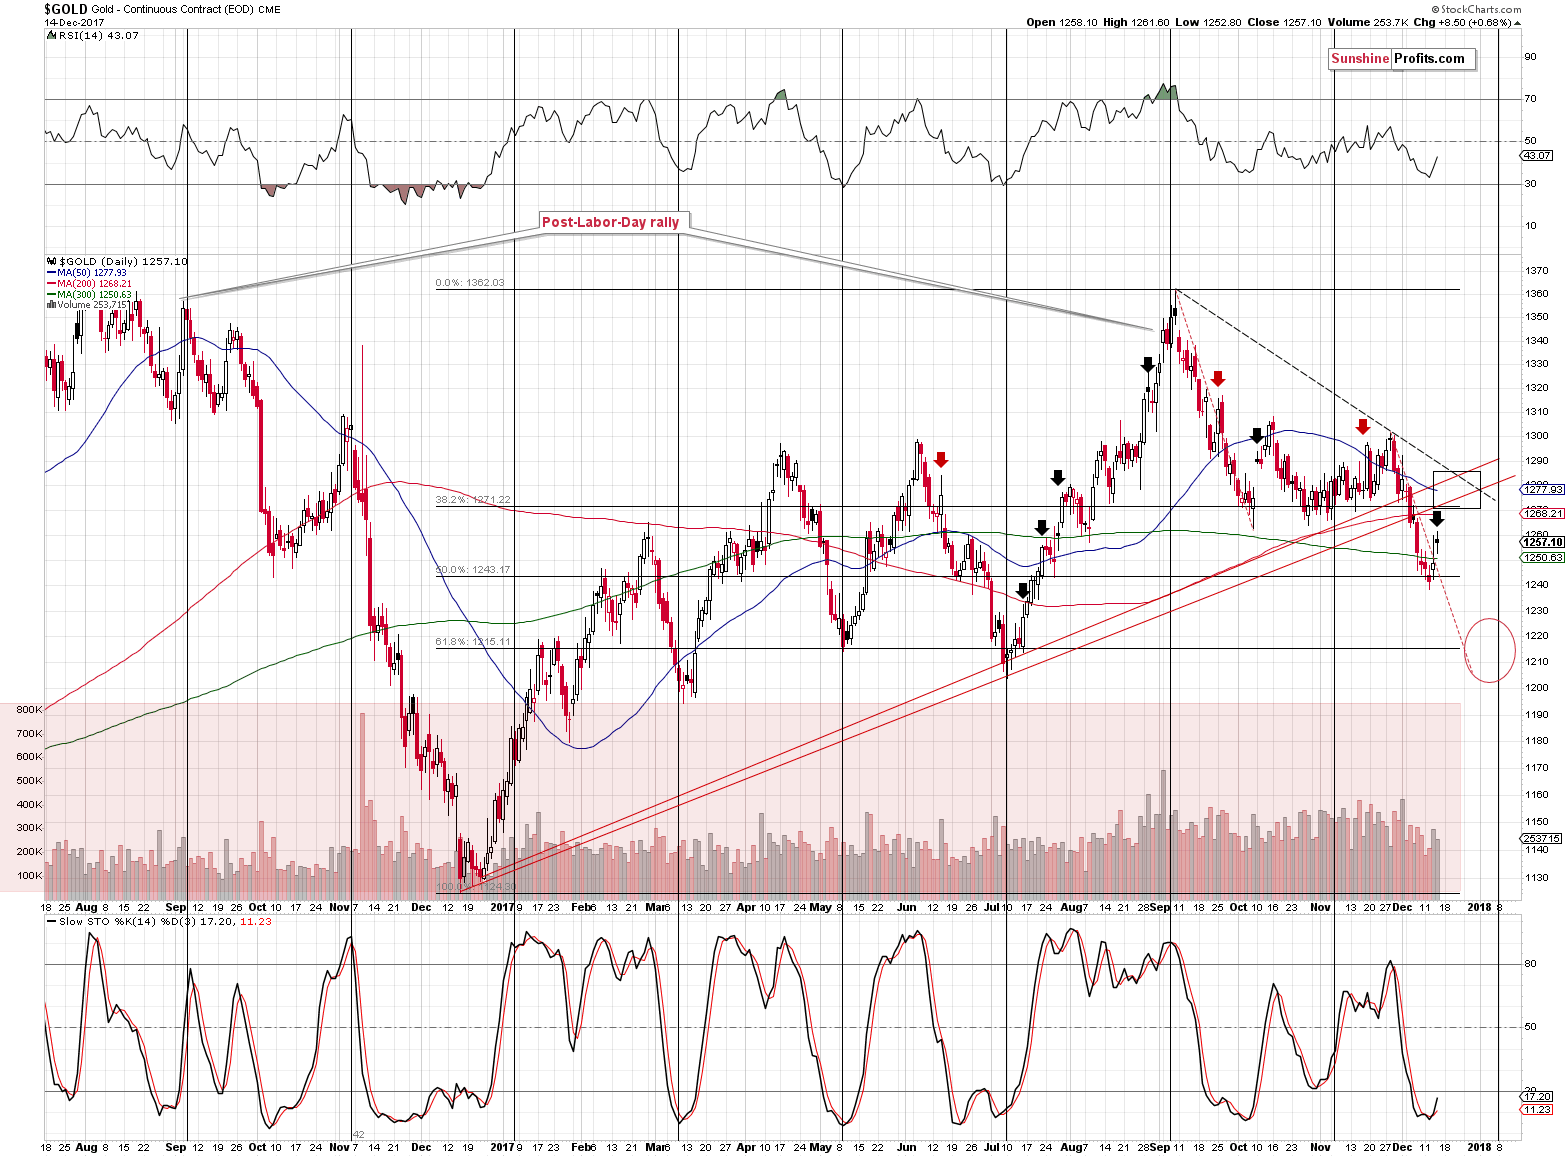
The pause may seem to be a non-event without implications. However, the pause by itself is also something – in particular, it’s the absence of a rally and the absence of a decline. Why would emphasizing that be important? Because when we saw volatile, one-day upswings in the past and they were immediately followed by a decline, it meant that the decline was about to continue and the previous day’s rally was just a blip on the radar screen. We marked such situations with red arrows on the above chart.
The key thing is what happened when a pause followed a daily volatile rally. The answer is straightforward – the rally continued either immediately or after a few days. In both cases, there was no big slide for several days. We marked those situations with black arrows.
Consequently, just because we haven’t seen big daily price changes in gold and silver, it doesn’t mean that there were no implications. In fact, in the current context, a pause by itself is a signal – a bullish one.
The buy signal from the Stochastic indicator serves as a short-term bullish confirmation.
In yesterday’s alert, we showed why a rally in gold stocks will not invalidate the analogy to the previous big slide. Today, we will do the same with the gold market.
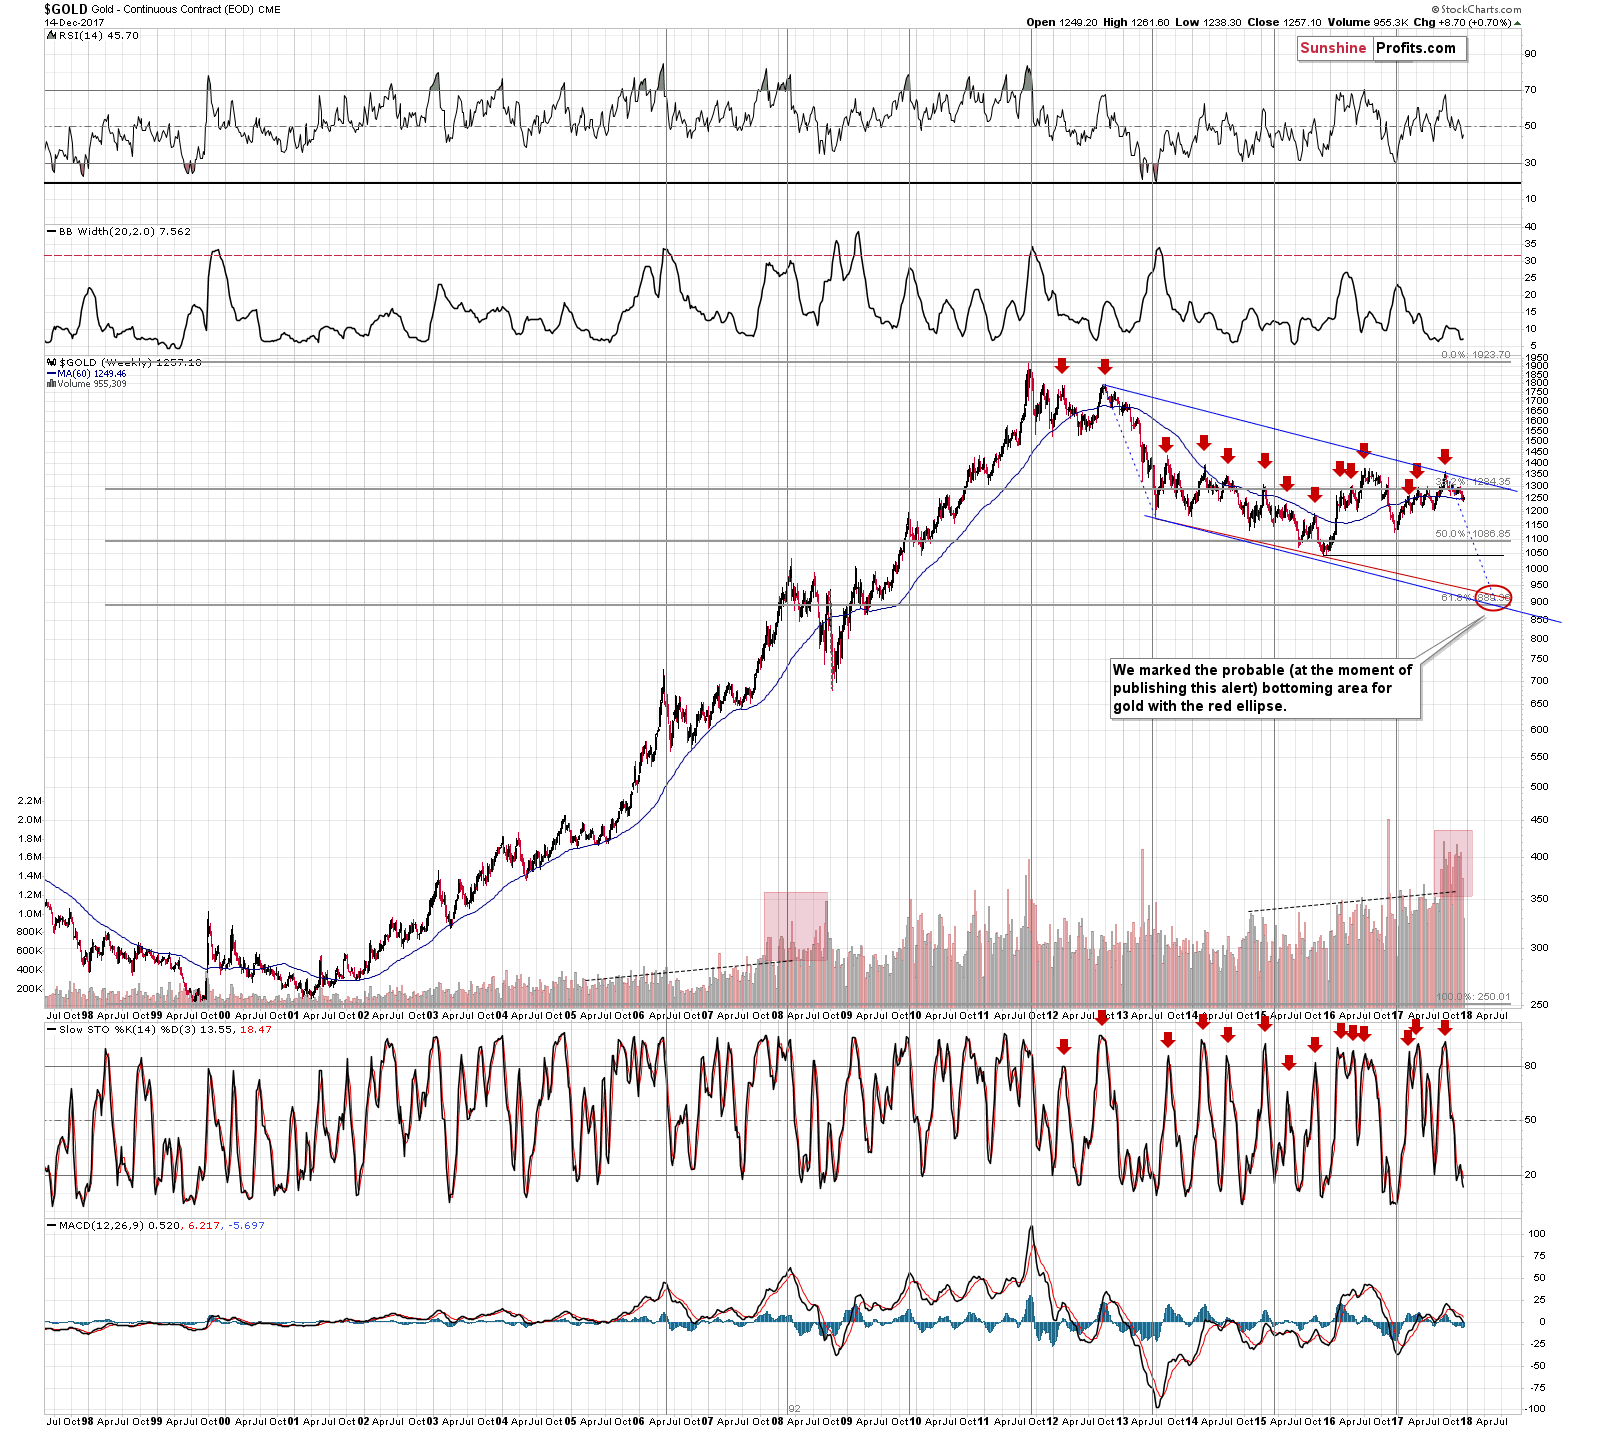
Well, we already explained it at the beginning of the week, but it seems that since the rally is indeed happening, a reminder would be useful. In Monday’s alert, we wrote the following about the above chart:
The thing that we would additionally like to point out on the above chart is that gold moved to (and closed the week below) the 60-week moving average. It had already moved close to this level in early October, but corrected shortly thereafter. Why do we mention this while discussing the long-term gold chart? Because on the above chart you can see something very similar in late 2012 and early 2013. Back then, gold’s final top was followed by a move to the 60-week MA, then we saw a correction, and then a move below the previous low and the 60-week MA. After that low we saw another corrective upswing that was a bit smaller than the previous one.
The implication here is that we could see even lower gold prices on a very short-term basis, then a correction that would not be very significant and then another big wave down. That’s in tune with what we’ve been expecting to see based on other factors, so the above simply serves as a confirmation.
In other words, a corrective upswing here is very much in tune with what took place about 5 years ago.
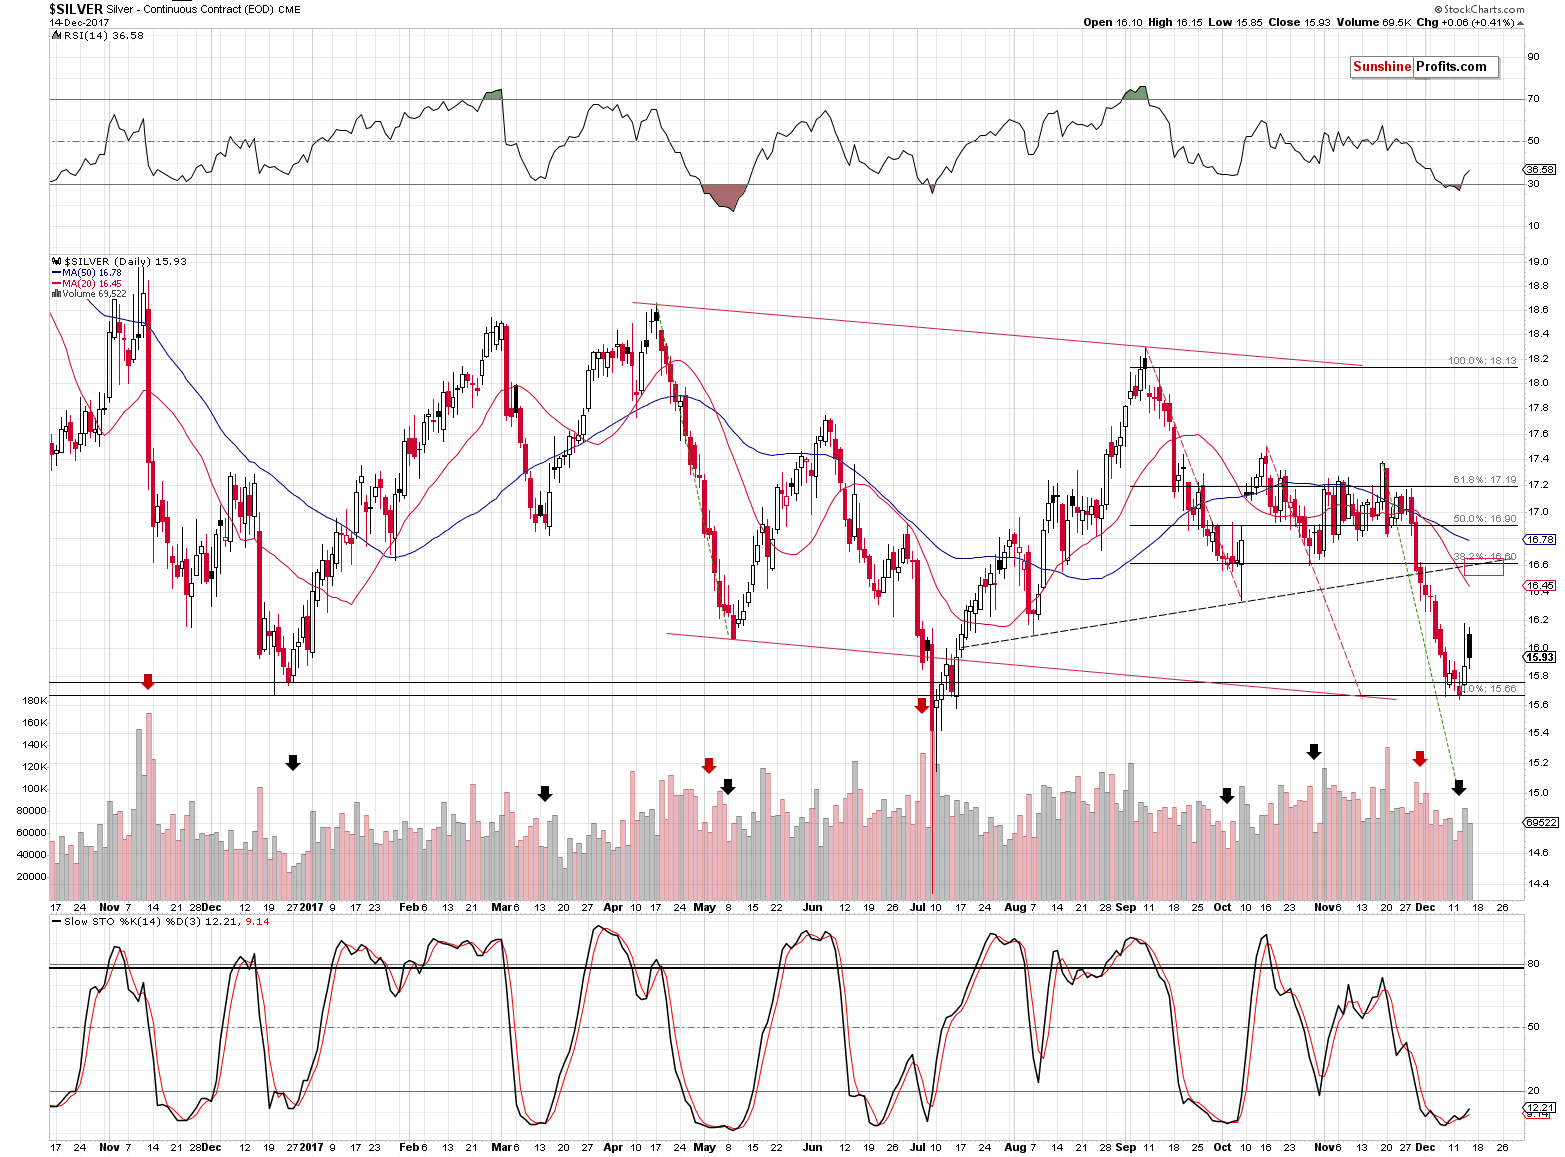
The white metal corrected a part of the Wednesday’s upswing yesterday, but there was no major invalidation. The analogy to the previous bottoms and pauses within rallies is not as clear as it is in the case of gold as silver’s intraday moves are more volatile in general, and it’s more difficult to decide which sessions are really volatile and which ones are rather normal.
Most importantly, however, we can say that silver is not outperforming gold on a short-term basis. This means that the rally is likely to continue and the short-term top is not yet in.
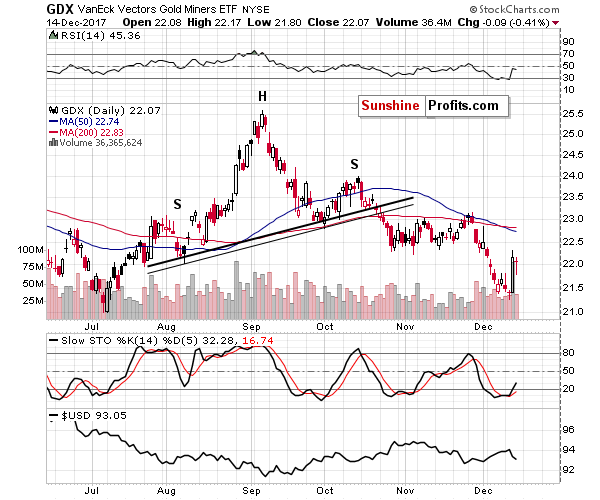
Mining stocks paused as well – there was no invalidation of the rally. To be precise, mining stocks attempted to move sharply lower in the first part of yesterday’s session, but the decline was soon reversed and GDX ended the day only 9 cents lower. The bullish implications of Wednesday’s huge-volume rally remain in place.
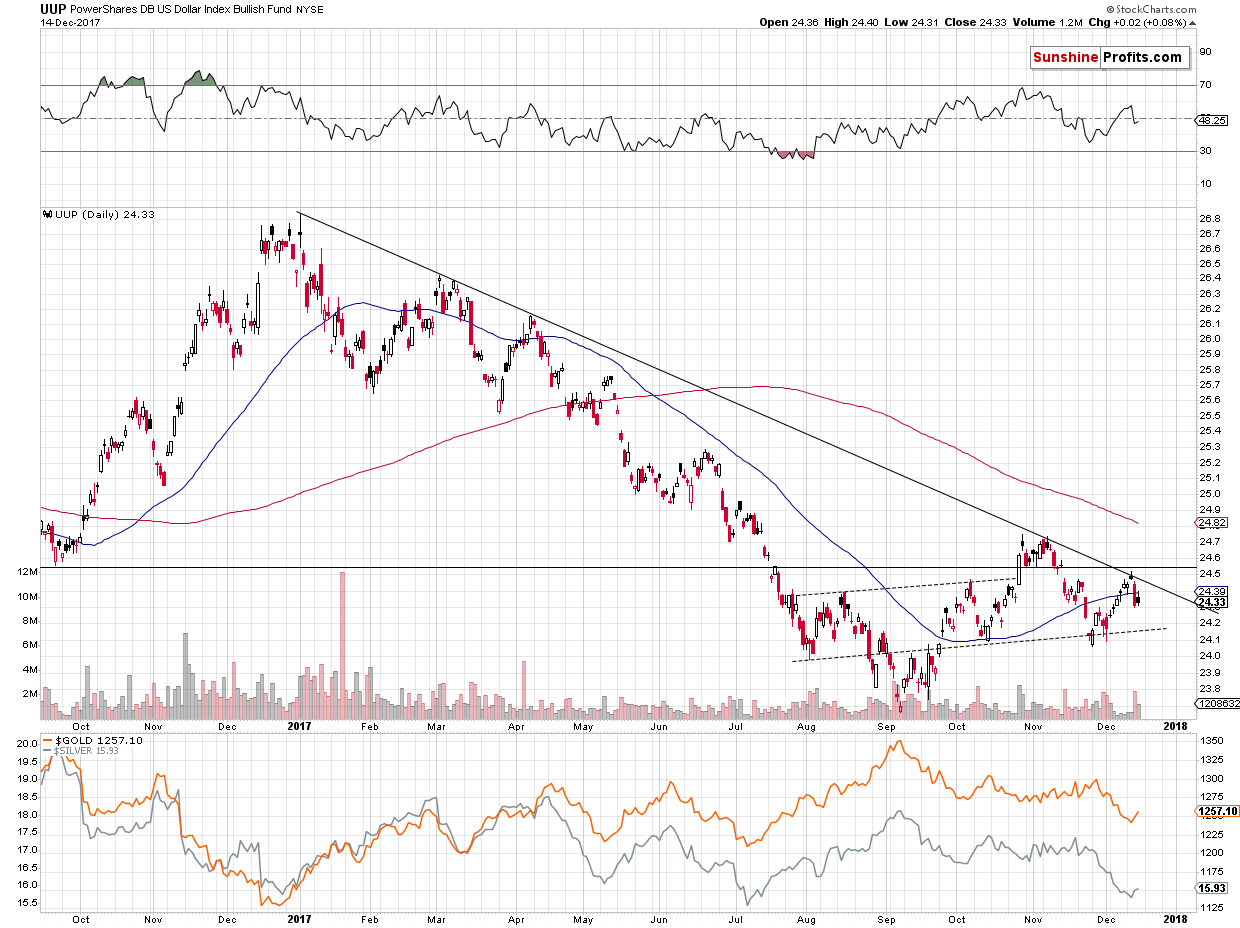
The USD Index chart on Stockcharts also seems to be incorrect (it shows a sizable daily decline yesterday), so we’ll use the UUP ETF (proxy for the USDX) chart instead. The USD declined on Wednesday and it paused yesterday. On a very short-term basis, it’s vulnerable to further weakness, but the support is not far – the October and November lows provide it.
A move to this level would create a head-and-shoulders pattern and it would likely result in multiple analysts pointing to an imminent breakdown in USD prices based on this formation.
Before that happens, please note that for the formation to have any implications, it needs to be completed. Consequently, without the confirmed breakdown below the neck level of the formation, there will be no bearish implications of the formation whatsoever. We discussed that in greater detail when an analogous formation was (almost) present in gold.
Even if it is confirmed, the implications will not be dramatic, because in the currency market, this formation is known to frequently provide fake signals, especially in the EUR:USD pair (which is the main component of the USD Index).
All in all, the USD Index could slide to the October or November lows but it’s not likely to break much below them. A decline of this extent is something that fits our targets for gold, silver and mining stocks, and confirms them.
Summing up, the medium-term outlook for the precious metals market didn’t change based on this and last week’s developments and it remains bearish, but the short-term outlook improved significantly. Yesterday’s pause in gold is not neutral - it serves as a bullish confirmation for the short term.
As always, we will keep you – our subscribers – informed.
To summarize:
Trading capital (supplementary part of the portfolio; our opinion): Long positions (100% of the full position) in gold, silver and mining stocks are justified from the risk/reward perspective with the following stop-loss orders and initial targets:
- Gold: initial target level: $1,279; stop-loss: $1,236; initial target level for the UGLD ETN: $10.58; stop-loss for the UGLD ETN $9.38
- Silver: initial target level: $16.48; stop-loss: $15.58; initial target level for the USLV ETN: $11.18; stop-loss for the USLV ETN $8.88
- Mining stocks (price levels for the GDX ETF): initial target level: $22.97; stop-loss: $21.08; initial target level for the NUGT ETF: $30.18; stop-loss for the NUGT ETF $23.78
In case one wants to bet on junior mining stocks' prices (we do not suggest doing so – we think senior mining stocks are more predictable in the case of short-term trades – if one wants to do it anyway, we provide the details), here are the stop-loss details and exit prices:
- GDXJ ETF: initial target level: $33.48; stop-loss: $29.78
- JNUG ETF: initial target level: $17.38; stop-loss: $11.78
Long-term capital (core part of the portfolio; our opinion): No positions (in other words: cash)
Insurance capital (core part of the portfolio; our opinion): Full position
Important Details for New Subscribers
Whether you already subscribed or not, we encourage you to find out how to make the most of our alerts and read our replies to the most common alert-and-gold-trading-related-questions.
Please note that the in the trading section we describe the situation for the day that the alert is posted. In other words, it we are writing about a speculative position, it means that it is up-to-date on the day it was posted. We are also featuring the initial target prices, so that you can decide whether keeping a position on a given day is something that is in tune with your approach (some moves are too small for medium-term traders and some might appear too big for day-traders).
Plus, you might want to read why our stop-loss orders are usually relatively far from the current price.
Please note that a full position doesn’t mean using all of the capital for a given trade. You will find details on our thoughts on gold portfolio structuring in the Key Insights section on our website.
As a reminder – “initial target price” means exactly that – an “initial” one, it’s not a price level at which we suggest closing positions. If this becomes the case (like it did in the previous trade) we will refer to these levels as levels of exit orders (exactly as we’ve done previously). Stop-loss levels, however, are naturally not “initial”, but something that, in our opinion, might be entered as an order.
Since it is impossible to synchronize target prices and stop-loss levels for all the ETFs and ETNs with the main markets that we provide these levels for (gold, silver and mining stocks – the GDX ETF), the stop-loss levels and target prices for other ETNs and ETF (among other: UGLD, DGLD, USLV, DSLV, NUGT, DUST, JNUG, JDST) are provided as supplementary, and not as “final”. This means that if a stop-loss or a target level is reached for any of the “additional instruments” (DGLD for instance), but not for the “main instrument” (gold in this case), we will view positions in both gold and DGLD as still open and the stop-loss for DGLD would have to be moved lower. On the other hand, if gold moves to a stop-loss level but DGLD doesn’t, then we will view both positions (in gold and DGLD) as closed. In other words, since it’s not possible to be 100% certain that each related instrument moves to a given level when the underlying instrument does, we can’t provide levels that would be binding. The levels that we do provide are our best estimate of the levels that will correspond to the levels in the underlying assets, but it will be the underlying assets that one will need to focus on regarding the signs pointing to closing a given position or keeping it open. We might adjust the levels in the “additional instruments” without adjusting the levels in the “main instruments”, which will simply mean that we have improved our estimation of these levels, not that we changed our outlook on the markets. We are already working on a tool that would update these levels on a daily basis for the most popular ETFs, ETNs and individual mining stocks.
Our preferred ways to invest in and to trade gold along with the reasoning can be found in the how to buy gold section. Additionally, our preferred ETFs and ETNs can be found in our Gold & Silver ETF Ranking.
As a reminder, Gold & Silver Trading Alerts are posted before or on each trading day (we usually post them before the opening bell, but we don't promise doing that each day). If there's anything urgent, we will send you an additional small alert before posting the main one.
=====
Latest Free Trading Alerts:
Gold's Upside Target for December 2017
In our Monday’s analysis, we emphasized that a lot changed from the short-term point of view, even though price changes in gold and silver were small. On Tuesday, we argued that closing our short position on Tuesday had been justified. Mining stocks soared by over 3% making yesterday’s session the biggest daily rally since August. A lot has changed indeed. Will the rally continue for much longer?
=====
Hand-picked precious-metals-related links:
Gold edges up as dollar slips on U.S. tax bill worries
Crude Oil Prices Struggle, Gold May Return to the Offensive
=====
In other news:
EU Leaders Agree To Extend Ukraine-Related Sanctions For Six Months
China Is Still Building on Disputed Islands in the South China Sea
=====
Thank you.
Sincerely,
Przemyslaw Radomski, CFA
Founder, Editor-in-chief, Gold & Silver Fund Manager
Gold & Silver Trading Alerts
Forex Trading Alerts
Oil Investment Updates
Oil Trading Alerts

