

Last week, we received quite a few messages in which readers asked about the long-term reverse head-and-shoulders pattern in gold and related ratios. In today’s alert we discuss this in greater detail.
Let’s jump right into the gold chart (charts courtesy of http://stockcharts.com).
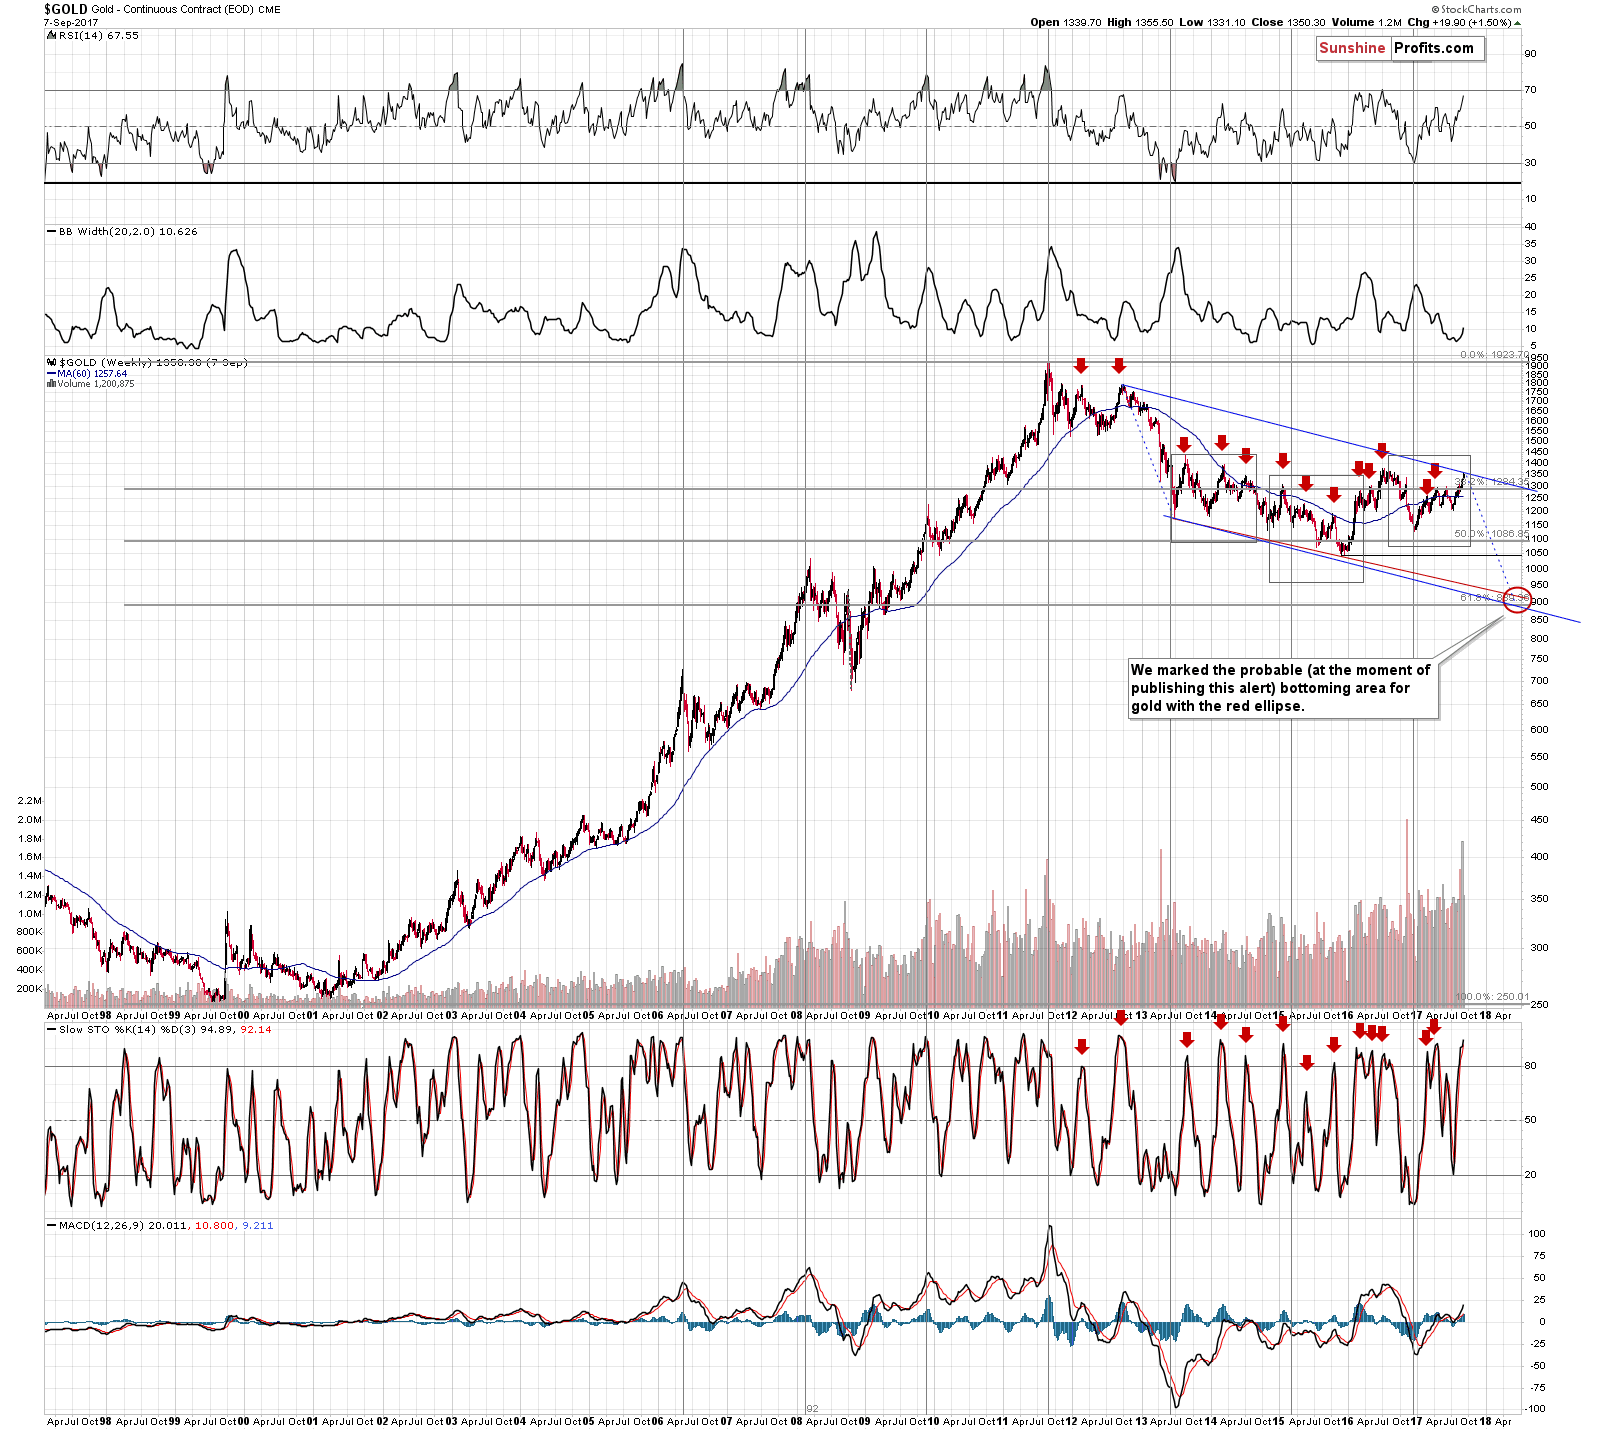
The shape of the head and shoulders may not be evident on the chart, so we marked it with grey rectangles (one for the head and two for the shoulders). Generally, there are several characteristics regarding the reverse head and shoulders pattern that either make it reliable or rather insignificant. We’ll discuss the less important ones first.
The pattern should be characterized by U-shaped bottoms, it should be symmetric and it should be confirmed by volume. Neither of the above bottoms (head or shoulders) are U-shaped. Is the pattern symmetrical? Somewhat – the distance between the head and each of the shoulders is rather similar, but the head itself is not symmetric.
The volume should generally decline until bottoming along with the price in the right shoulder, with small upswings along with the price (in the final part of the left shoulder and the head). The volume should increase significantly only after the right-shoulder bottom. This is not what we can observe on the above gold chart. The volume was more or less steady between the first half of 2013 and the final part of 2015, with a visible uptick in Q3-Q4 of 2014 – not during a rally in gold, but during a decline in its price. The volume increased in 2016 and it’s been steady since that time except for what we saw two weeks ago. The volume picked up significantly in the second part of the head and it didn’t really decline before the right-shoulder bottom was formed – the volume spiked shortly beforehand and then it declined, but it was simply a seasonal issue (end of the year).
So far, the things that should confirm the reverse head and shoulders pattern in gold, suggest otherwise. Having said that, let’s move on to the key issue.
Even if the above confirmations did indeed confirm the pattern instead of invalidating it, there would be no bullish implications for gold at this time. Why? Because there is no pattern to speak of – yet. In the case of the neck level based on the daily closing prices and the recent closes, there was no breakout above the neck level of the pattern.
The whole point of a pattern is that it has implications once it is completed and that’s not the case with the discussed reverse head and shoulders pattern in gold. If there were any meaningful implications of a given pattern before it was completed, then the part of this pattern would be a different pattern that would have a different name. For instance, a head-and-1.5-shoulders pattern or something more fancy. Either way, since the incomplete reverse H&S pattern is not known to be any pattern by itself, it does not have any implications – at least at this time.
If the pattern was completed, then the previously discussed confirmations (or more precisely, invalidations) would come into play and they would make the strength of the signal rather weak. Still, for now, there are no implications thereof as the pattern simply does not exist yet.
The times ahead appear to be anything but boring and it seems to be the perfect time to stay updated on the latest developments on the precious metals market. Great way to proceed is to sign up for our daily Gold & Silver Trading Alerts. You can proceed using this link.
Thank you.
Sincerely,
Przemyslaw Radomski, CFA
Founder, Editor-in-chief, Gold & Silver Fund Manager
Gold & Silver Trading Alerts
Forex Trading Alerts
Oil Investment Updates
Oil Trading Alerts
