

Briefly: in our opinion, full (250% of the regular size of the position) speculative short position in gold, silver, and mining stocks is justified from the risk/reward perspective at the moment of publishing this Alert.
Gold hasn't had much success moving higher yesterday. Its breakout above the neckline of the previously completed head-and-shoulders pattern is close to being invalidated. Will that invalidation happen prior to or shortly after the Friday's options expiry? In assessing the short-term outlook, we also look at the gold miners-to-gold ratio dynamics. Will they lead both metals on their upcoming move?
Let's start with gold. Right then, we'll follow up with silver.
Gold and Silver Are Treading Water
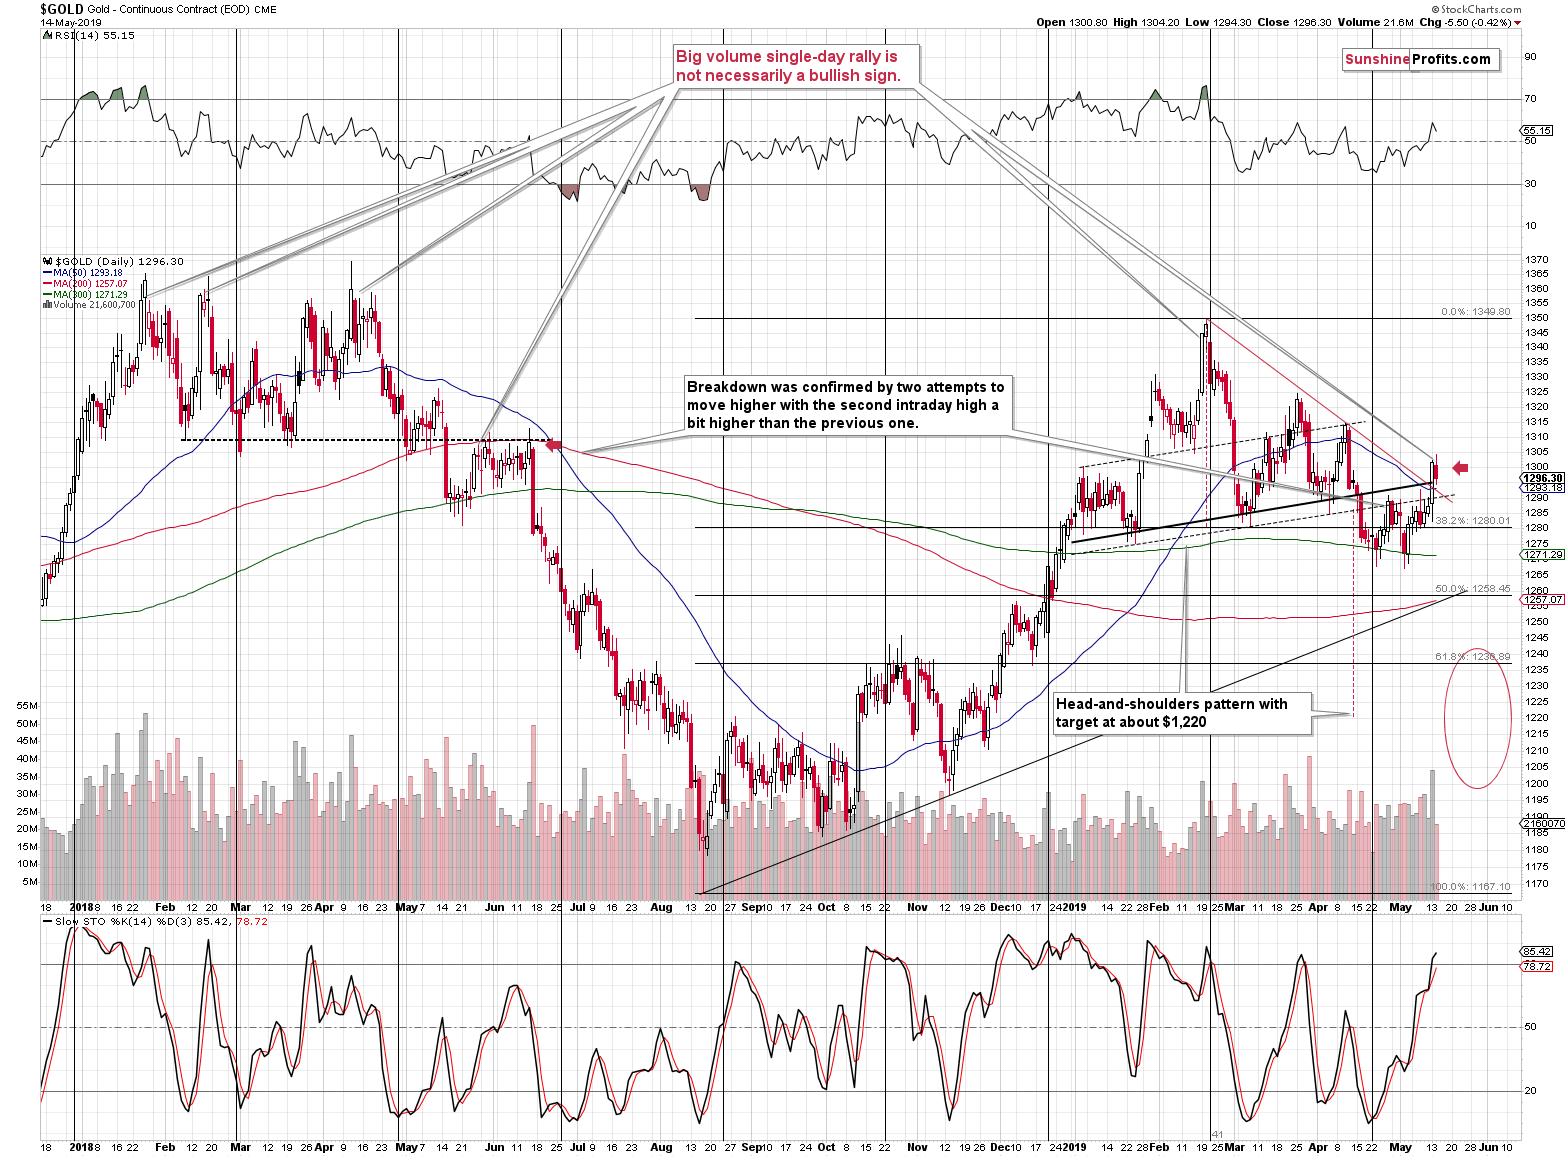
The yellow precious metal moved somewhat higher initially only to decline before the end of the session. Yesterday, we described two price levels that are important from the short-term point of view along with the reasons we expected gold to move back below them either this week or early in the next week. It seems that quoting yesterday's comments will be useful, as they remain up-to-date:
The yellow metal moved higher and closed the day above the $1,300 level, but at the moment of writing these words, gold's continuous futures (that's what the above chart represents) is trading at $1,299, so this milestone was invalidated. However, in order to for the above chart to become fully bearish once again, gold should decline not only below $1,295 (the neck level of the head-and-shoulders pattern), but also below $1,293, which is the declining red resistance line that was broken yesterday. Price moves are usually confirmed within the next 2 days after the breakout or breakdown, so today's and tomorrow's closing prices will be important. Will gold invalidate yesterday's rally by that time?
It seems quite likely and even if it doesn't manage to do that by that time, it's likely to head south within a week anyway. That's particularly likely given the following two factors:
- The big-volume daily rallies were quite often seen at the final part of the rally and right before the turnaround. In fact, all major tops of 2018 and 2019 formed in this way. At times, there was one or two more (smaller) daily rally / rallies thereafter and at times, the slide followed right away but the overall tendency remained intact. Big-volume rallies in gold that we see after a calmer rally is not something very bullish as the technical-analysis-101 books would have one believe. Gold market reacts in its own way and what was saw yesterday looks like an indication of a top.
- We have a short-term triangle-vertex-based reversal just around the corner. The declining red resistance line crosses the neck level of the H&S pattern (black, dashed line) tomorrow.
Moreover, the last 2 times the Stochastic moved above the 80 level, we saw a local top shortly. One of them was the final top of the 2018-2019 upswing.
Let's keep in mind that these are only the short-term factors pointing to lower prices. There are also multiple medium-term bearish confirmations that we are not discussing today, but that we have discussed in the previous days and weeks.
Gold closed a few dollars lower, but not yet below the above-mentioned price levels. The neck level of the head and shoulders pattern is still at $1,295, while the declining support/resistance line is now at $1,292. The latter is now a dollar lower, as is its, well, declining. Yesterday's closing price was $1,296.30 and at the moment of writing these words, gold is trading at $1,295.70. Gold is therefore very close to invalidating the recent breakouts and starting another wave down.
The above-mentioned (in point 1) huge-volume rallies right before all major tops of 2018 and 2019 were followed by either an immediate decline (1 case), a daily pause (2 cases), and then a decline, or two days of pause and then a decline (1 case). Consequently, if this case is similar to the previous ones - and it seems that it is - we might see a decline right away, or we might see it tomorrow. Now, let's keep in mind that options expire on Friday, so it will also be quite normal for the decline to be delayed until that time.
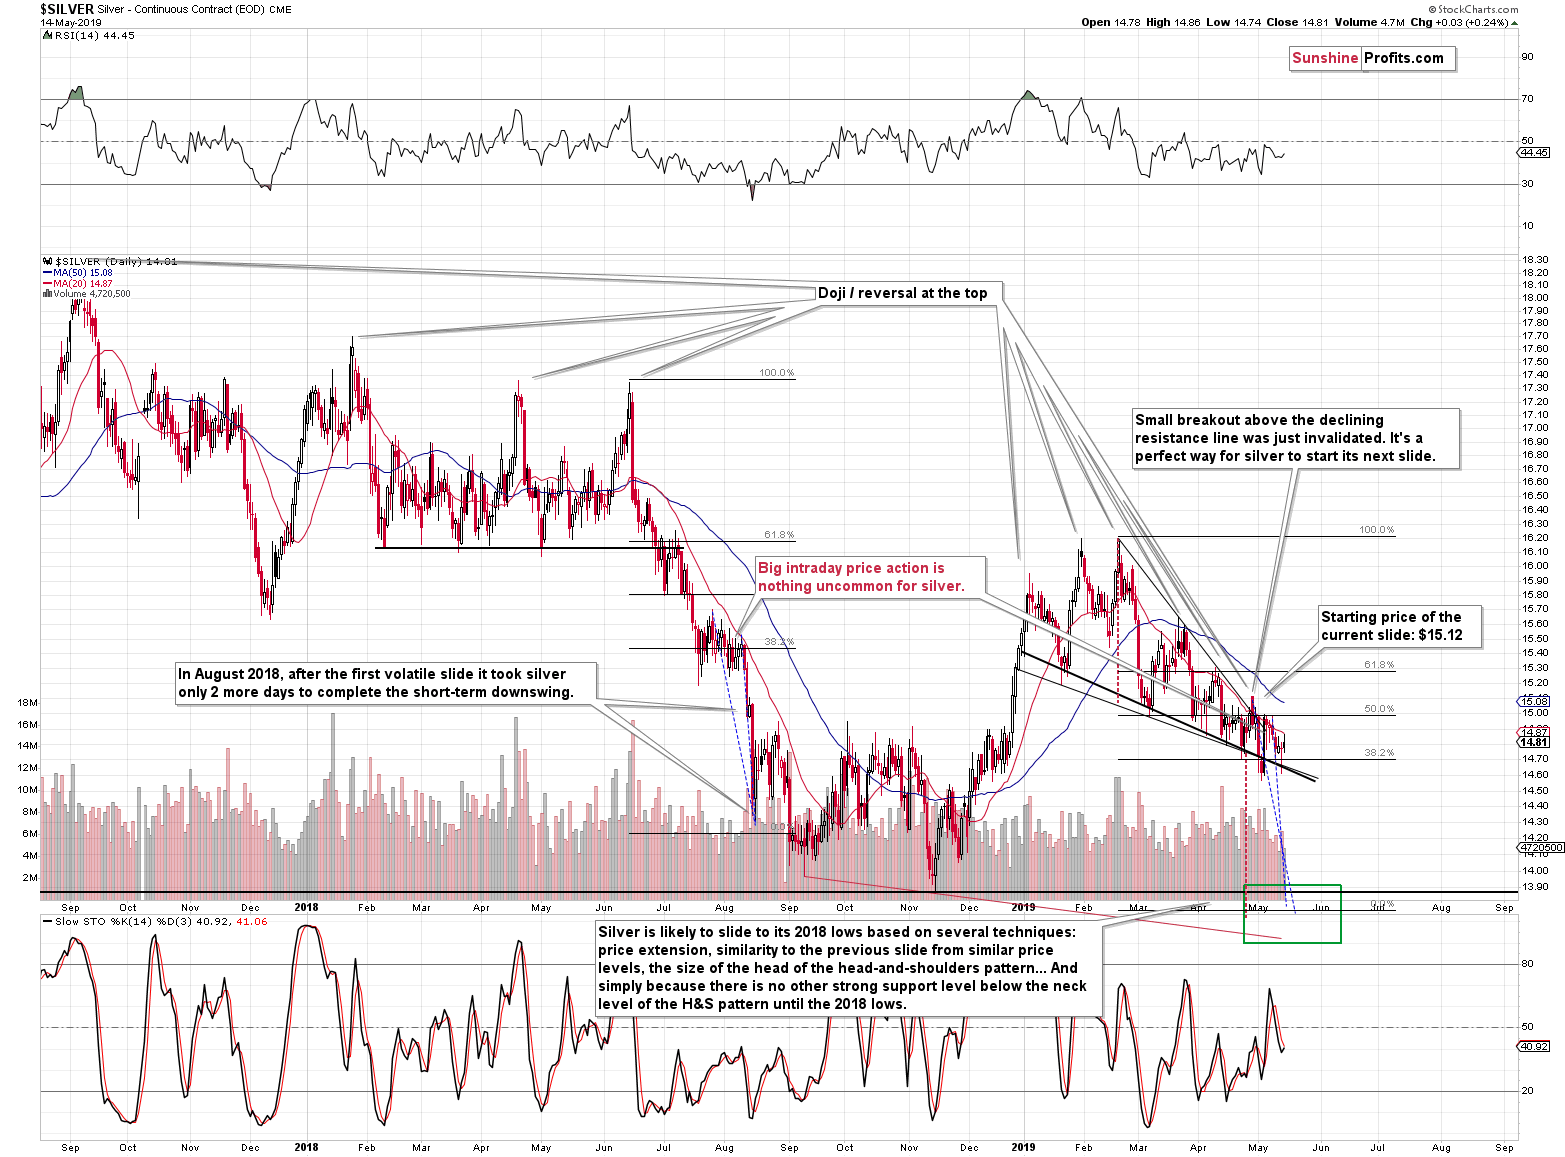
Silver hasn't done much yesterday. It moved higher intraday but ended just 3 cents higher. It was almost a mirror image of what silver had done on Monday - it had moved lower first and then came back up.
Overall, this means that what we wrote previously about silver simply remains intact and so does our downside target level:
Silver's back and forth movement with lower highs makes the current moment very similar to what we saw in early August 2018. We wrote about it previously, but that was before a large part of the recent back-and-forth trading. The situation was similar previously, and it continues to be similar, but in a bit different way.
We have previously used the highest and final tops of the consolidation in order to measure the size of the following decline (blue dashed lines). We then applied these declines to the analogous recent tops. Now, because we saw more back-and-forth trading, we have new - and more appropriate - tops to "attach" those previous price moves to. By doing so, we get a more coherent target for the upcoming price slide than we have had before.
Previously, both declines pointed to the bottom between $13.90 and $14. Now, they suggest a move to about $13.75. As a reminder, our take-profit level for this trade is set at $13.81 based also on other factors, so the above is great news as it increases the chance that our target will be reached shortly before the next important turnaround.
So, while it may be surprising, we have slightly more bearish and visibly more precise outlook for silver for the rest of the month.
Let's move to mining stocks.
Watching Out For the Head and Shoulders in the Miners
Our comments on mining stocks are quite similar to the comments on gold. Let's start by quoting yesterday's thoughts as the situation has barely changed and they remain up-to-date:
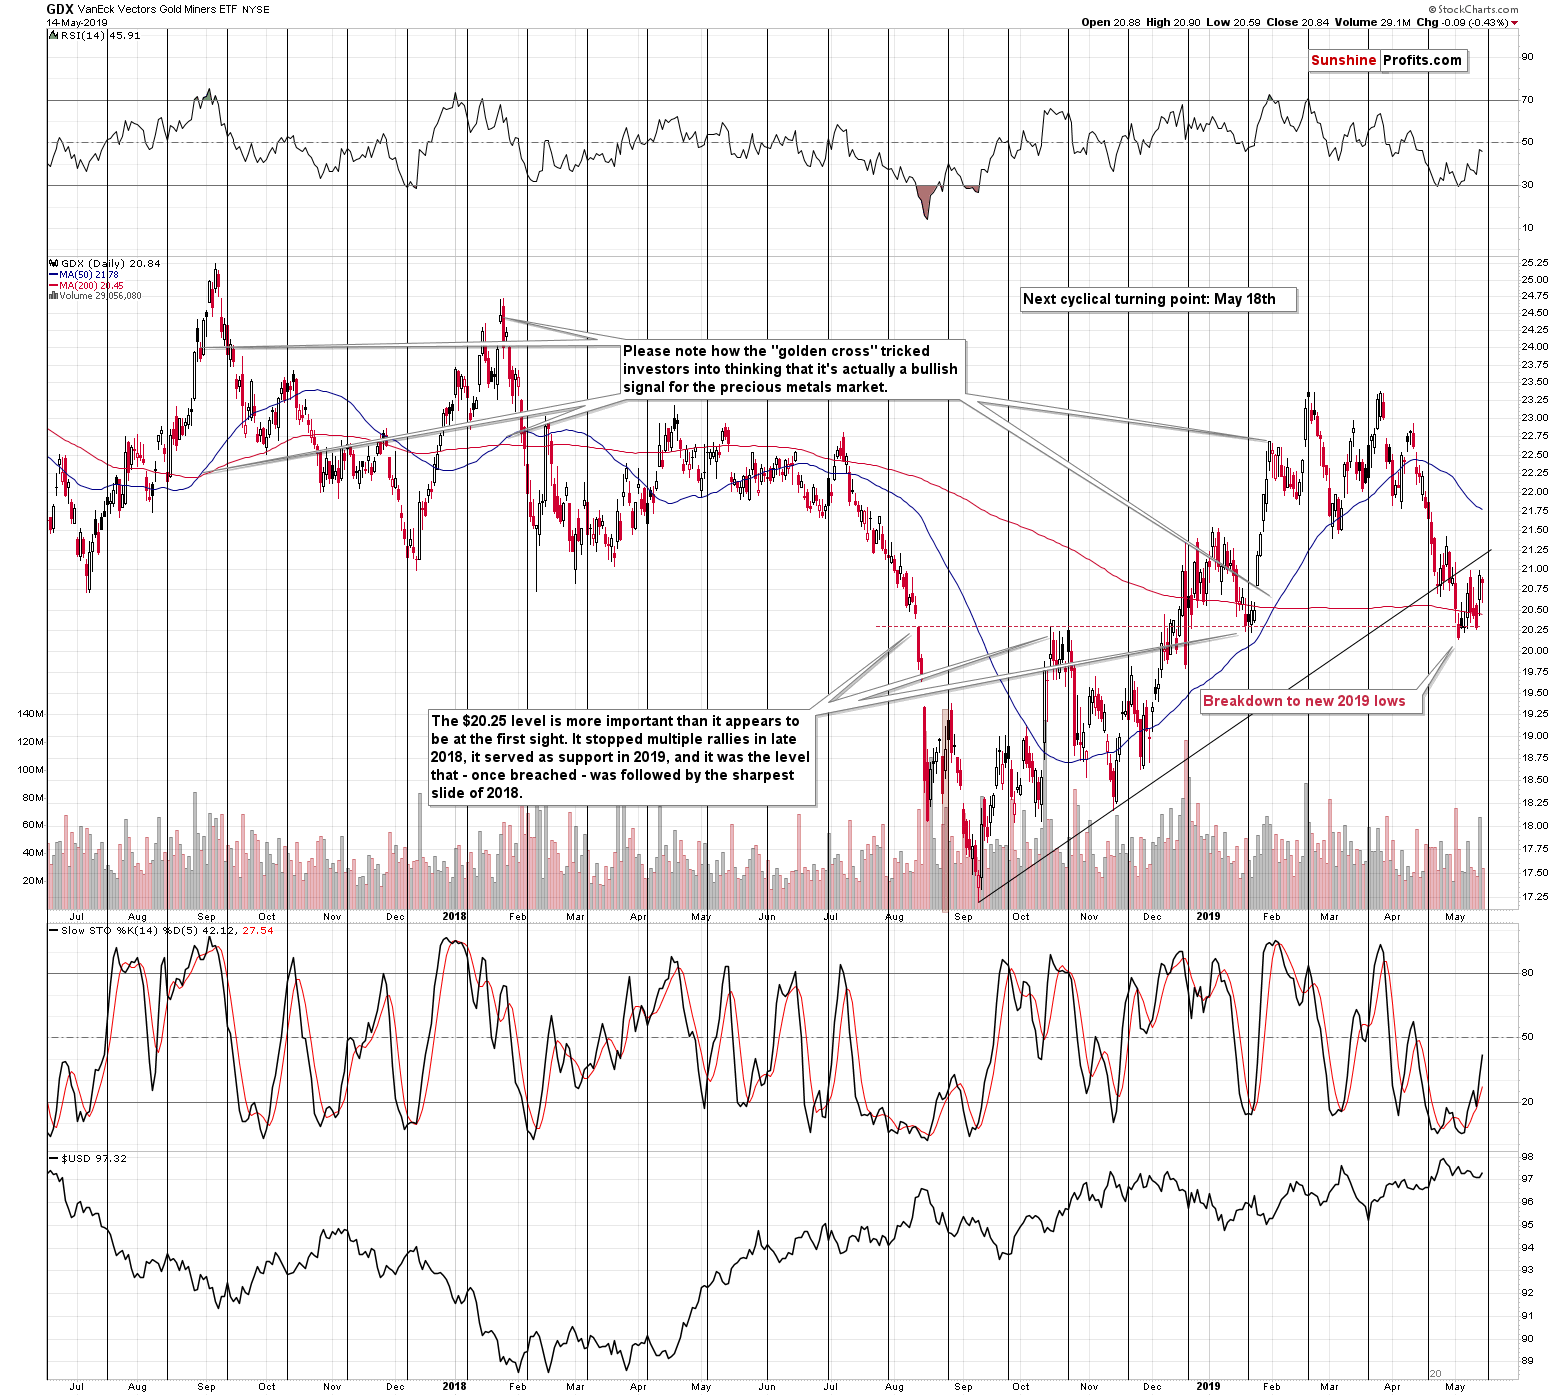
There is something very interesting on the GDX ETF chart. Namely, we saw a big-volume rally just ahead of the cyclical turning point. Does it look familiar? It should, because that's exactly what we saw in the second half of February, earlier this year. That was the day before the final top of the year. So, is a big-volume rally necessarily a bullish thing here? No.
In our May 8 Gold & Silver Trading Alert, we wrote that if the miners strength wasn't just a bluff, then the possible upside target (that would not change anything from the broader point of view) for the HUI Index was 162.5. To be clear, we wrote the following:
Gold stocks (at the very bottom on the above chart) might move to the late-April highs, the 38.2% Fibonacci retracement, or the early January highs, which would make the current upswing symmetrical to the early-January decline. As far as the latter is concerned, it might be likely (assuming that miners would move higher from here at all) as the miners have already proved to form such symmetrical patterns in the past. For instance, the early-November 2018 rally and top, was symmetrical to the early-October action. All the above points to approximately 162.5 as the possible upside target. "Possible" doesn't mean "likely", though.
There is one more thing that needs to be considered - the previously broken rising resistance line. It´s currently at about $21.25. Consequently, the analogous target for the GDX ETF, based on the above-mentioned symmetry, and the late-April high and the resistance line is the $21.25 - $21.50 area.
This is how high mining stocks might realistically go in the next few days before they turn south and decline with vengeance.
Please note that regardless of whether miners decline right away, or after another small move to the upside, the December - now price pattern will most likely become a one big bearish head-and-shoulders pattern. Based on the size of the head (the highest point is the February top of $23.70), the downside target will be about $17.40. This would be a perfect confirmation of the target that we had already established for this downswing.
All in all, the situation in the mining stocks didn't really improve. Yes, there might be some short-term strength here, but the enormous downside remains intact. The possible move higher seems too small to justify adjusting the trading position for the sake of it.
Today, we would like to add a few words on the shapes of the previous tops. Please note that it usually takes a few days for the top in miners to form. The three major tops of 2019: the February top, the March top, and the April top all took place over 3 or 4 days. The October 2018 top took even more. The July 2018 top took - again - 4 days. The January 2018 top - 3 days. The September 2017 top - 4 days.
What we see right now is not a top that's as major as the previous ones... yet. If the profound decline follows from these levels, it will become such and since the latter is likely, it should be normal for one to expect this top to be formed over 3-4 days. If we count the early May upswing as a part of the top, then it might already be completed. But, if we look at this week's news-based rally alone, we have seen only 2 days of the topping action. This means that one or two daily closes close to the current price level should not be surprising.
In fact, we might even get a move slightly higher and this might even take place while gold declines.
Looking for Guidance to the Miners-to-Gold Ratio
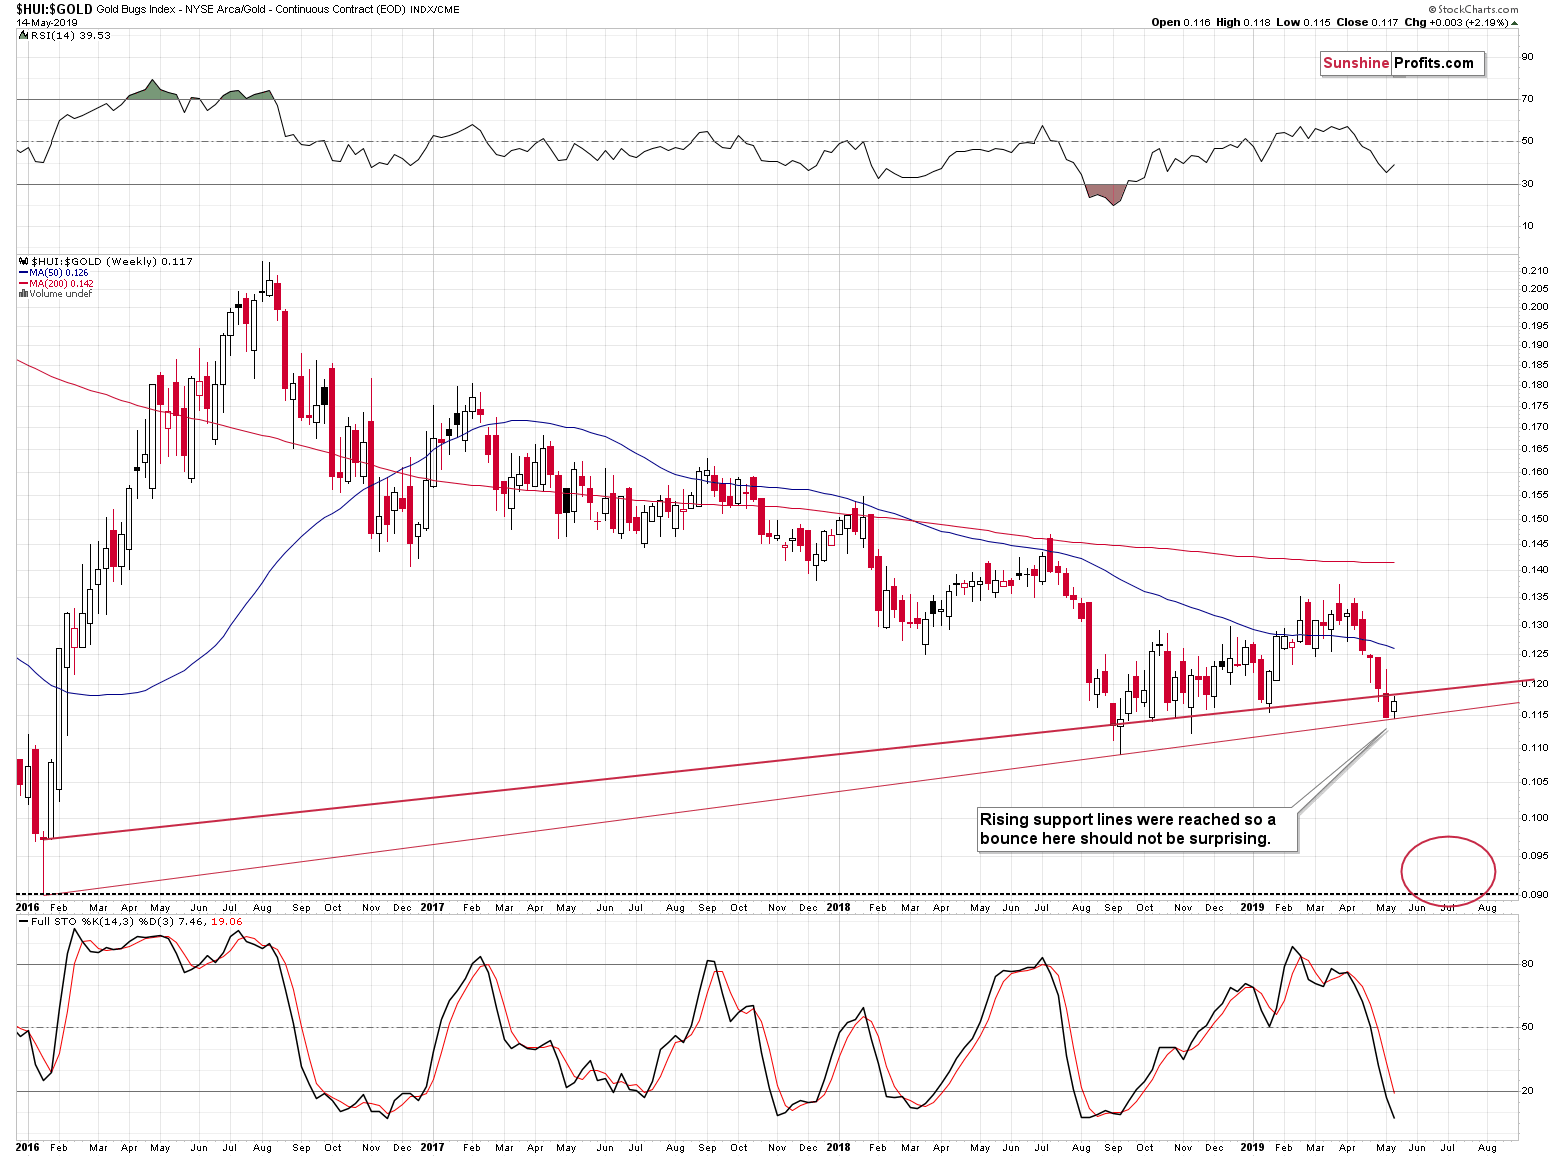
The gold stocks to gold ratio moved sharply lower recently and it reached its rising support line. This means that a bounce here would not be surprising. Naturally, the HUI to gold ratio might slide lower right away, to its 2016 bottom, as there is very little support below the 2018 lows. However, based on the current support line, it's definitely not inevitable that it would do so in the next 2 weeks.
So, what does it mean? It means that if miners show some relative strength soon and perhaps refuse to slide while gold invalidates its earlier breakouts, it will most likely not be a sign of true strength. It will much more likely be just a breather within a much longer episode of miners' underperformance.
Summary
Summing up, at first sight, it may seem a lot has changed based on Monday's rally in gold and mining stocks. That's not the case, however. The breakout in gold is not confirmed and is similar to rallies that took place right before the most important tops of 2018 and 2019. The triangle-vertex-based reversal in gold is just around the corner, and the same goes for the cyclical turning point in the mining stocks. Plus, options expire on Friday. It doesn't seem that this news-driven rally will be able to do much more than delay the big decline by just a few more days. We might see the decline resume right away, but we might also see it resume on Friday or early next week. The much more important thing is the likelihood that the big decline is coming anyway than whether it starts now or in a few days. The potential profits on the slide are huge and definitely worth waiting a few extra days. Consequently, we think that keeping the short positions intact is justified from the risk to reward point of view.
To summarize:
Trading capital (supplementary part of the portfolio; our opinion): Full short position (250% of the full position) in gold, silver, and mining stocks is justified from the risk/reward perspective with the following stop-loss orders and exit profit-take price levels:
- Gold: profit-take exit price: $1,241; stop-loss: $1,357; initial target price for the DGLD ETN: $51.87; stop-loss for the DGLD ETN $39.87
- Silver: profit-take exit price: $13.81; stop-loss: $15.72; initial target price for the DSLV ETN: $39.38; stop-loss for the DSLV ETN $26.97
- Mining stocks (price levels for the GDX ETF): profit-take exit price: $17.61; stop-loss: $24.17; initial target price for the DUST ETF: $34.28; stop-loss for the DUST ETF $15.47
In case one wants to bet on junior mining stocks' prices (we do not suggest doing so - we think senior mining stocks are more predictable in the case of short-term trades - if one wants to do it anyway, we provide the details), here are the stop-loss details and target prices:
- GDXJ ETF: profit-take exit price: $24.71; stop-loss: $35.67
- JDST ETF: profit-take exit price: $78.21 stop-loss: $30.97
Long-term capital (core part of the portfolio; our opinion): No positions (in other words: cash)
Insurance capital (core part of the portfolio; our opinion): Full position
Whether you already subscribed or not, we encourage you to find out how to make the most of our alerts and read our replies to the most common alert-and-gold-trading-related-questions.
Please note that the in the trading section we describe the situation for the day that the alert is posted. In other words, it we are writing about a speculative position, it means that it is up-to-date on the day it was posted. We are also featuring the initial target prices, so that you can decide whether keeping a position on a given day is something that is in tune with your approach (some moves are too small for medium-term traders and some might appear too big for day-traders).
Plus, you might want to read why our stop-loss orders are usually relatively far from the current price.
Please note that a full position doesn't mean using all of the capital for a given trade. You will find details on our thoughts on gold portfolio structuring in the Key Insights section on our website.
As a reminder - "initial target price" means exactly that - an "initial" one, it's not a price level at which we suggest closing positions. If this becomes the case (like it did in the previous trade) we will refer to these levels as levels of exit orders (exactly as we've done previously). Stop-loss levels, however, are naturally not "initial", but something that, in our opinion, might be entered as an order.
Since it is impossible to synchronize target prices and stop-loss levels for all the ETFs and ETNs with the main markets that we provide these levels for (gold, silver and mining stocks - the GDX ETF), the stop-loss levels and target prices for other ETNs and ETF (among other: UGLD, DGLD, USLV, DSLV, NUGT, DUST, JNUG, JDST) are provided as supplementary, and not as "final". This means that if a stop-loss or a target level is reached for any of the "additional instruments" (DGLD for instance), but not for the "main instrument" (gold in this case), we will view positions in both gold and DGLD as still open and the stop-loss for DGLD would have to be moved lower. On the other hand, if gold moves to a stop-loss level but DGLD doesn't, then we will view both positions (in gold and DGLD) as closed. In other words, since it's not possible to be 100% certain that each related instrument moves to a given level when the underlying instrument does, we can't provide levels that would be binding. The levels that we do provide are our best estimate of the levels that will correspond to the levels in the underlying assets, but it will be the underlying assets that one will need to focus on regarding the signs pointing to closing a given position or keeping it open. We might adjust the levels in the "additional instruments" without adjusting the levels in the "main instruments", which will simply mean that we have improved our estimation of these levels, not that we changed our outlook on the markets. We are already working on a tool that would update these levels on a daily basis for the most popular ETFs, ETNs and individual mining stocks.
Our preferred ways to invest in and to trade gold along with the reasoning can be found in the how to buy gold section. Additionally, our preferred ETFs and ETNs can be found in our Gold & Silver ETF Ranking.
As a reminder, Gold & Silver Trading Alerts are posted before or on each trading day (we usually post them before the opening bell, but we don't promise doing that each day). If there's anything urgent, we will send you an additional small alert before posting the main one.
=====
Latest Free Trading Alerts:
We have seen a pretty sharp oil reversal yesterday. The U.S. session sent oil bulls packing. Not giving up, they're attempting a comeback today. Geopolitical news to their rescue: the drone attacks on key Saudi pipelines. Emboldened by this tailwind, do the oil bulls stand a chance of reversing the tide of recent declines?
Oil Bulls Attempt to Repair Yesterday's Damage
=====
Thank you.
Sincerely,
Przemyslaw Radomski, CFA
Editor-in-chief, Gold & Silver Fund Manager

