

Briefly: in our opinion, full (250% of the regular size of the position) speculative short position in gold, silver, and mining stocks are justified from the risk/reward perspective at the moment of publishing this Alert. We are moving the stop-loss level for the GDX ETF a bit higher as price is relatively close to it and the outlook remains intact.
Overall, nothing really happened on the precious metals market yesterday but still, one part of this "nothing" deserves special attention. It's the mining stocks' outperformance of gold. That's usually a sign of strength, which means that the above could indicate further gains. Then again, we just saw a powerful and clear reversal in gold and silver, while the USD Index seems to have bottomed. So... will the precious metals move lower as the reversals suggest or will they rally again as the miners just suggested?
The former seems much more likely. We have previously discussed that a small move higher in the miners could be seen and that it would take them slightly above the very strong, long-term resistance line in the XAU Index.
Miners at the Resistance
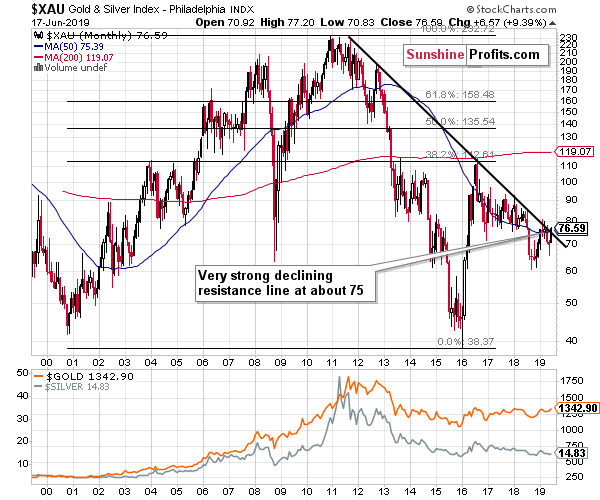
We wrote that a move above this line is possible, but it's highly unlikely that it would be significant or sustainable. Conversely, it's very likely that we will see a reversal and a big decline shortly after the small breakout is invalidated - in line with what we saw earlier this year.
As a reminder, the more important tops are used to create a given line, the more important it is from the technical point of view. Also, the more of the tops are used, the stronger the line becomes. The above-mentioned resistance line is based on five important tops and an additional confirmation of its strength in the form of XAU's inability to hold above it earlier this year. These five tops are:
- the late 2011 top
- the mid-2012 top
- the 2016 top
- the early 2018 top
- the mid-2018 top
All of them are very important and there's quite a few of them - usually the resistance lines are created based on just two extremes, and this time we have five of them. The implication is that this line is very unlikely to be broken, especially given the massive reversals in gold and silver that we saw recently.
So why did the miners move higher yesterday despite these reversals?
That's indeed the key question to ask today. The reply may appear strange not only to those who have become interested in the precious metals market recently, but also to those, who have been in it for longer.
It is generally known that the mining stocks stop reacting to gold's movement before the move is reversed. Miners' usual outperformance wanes before tops, and the miners' dramatic decline becomes less dramatic or even stops altogether before gold bottoms.
However, what investors usually miss, is that in case of the really major turnarounds, there is also one additional stage of miners' relative performance. It's the part when miners fake the comeback of their regular strength. That's exactly how the early-2016 rally in the mining stocks started - with mining stocks' underperformance. Gold didn't make a new low in January 2016, but the HUI Index did. Of course, one swallow doesn't make a summer, and one exception from the rule is not enough to change the rule. The point is, however, that it was not the only exception - this phenomenon is actually quite common in case of major reversals. Please take a look at the chart below for details.
Spotlight on Miners Faking the Moves
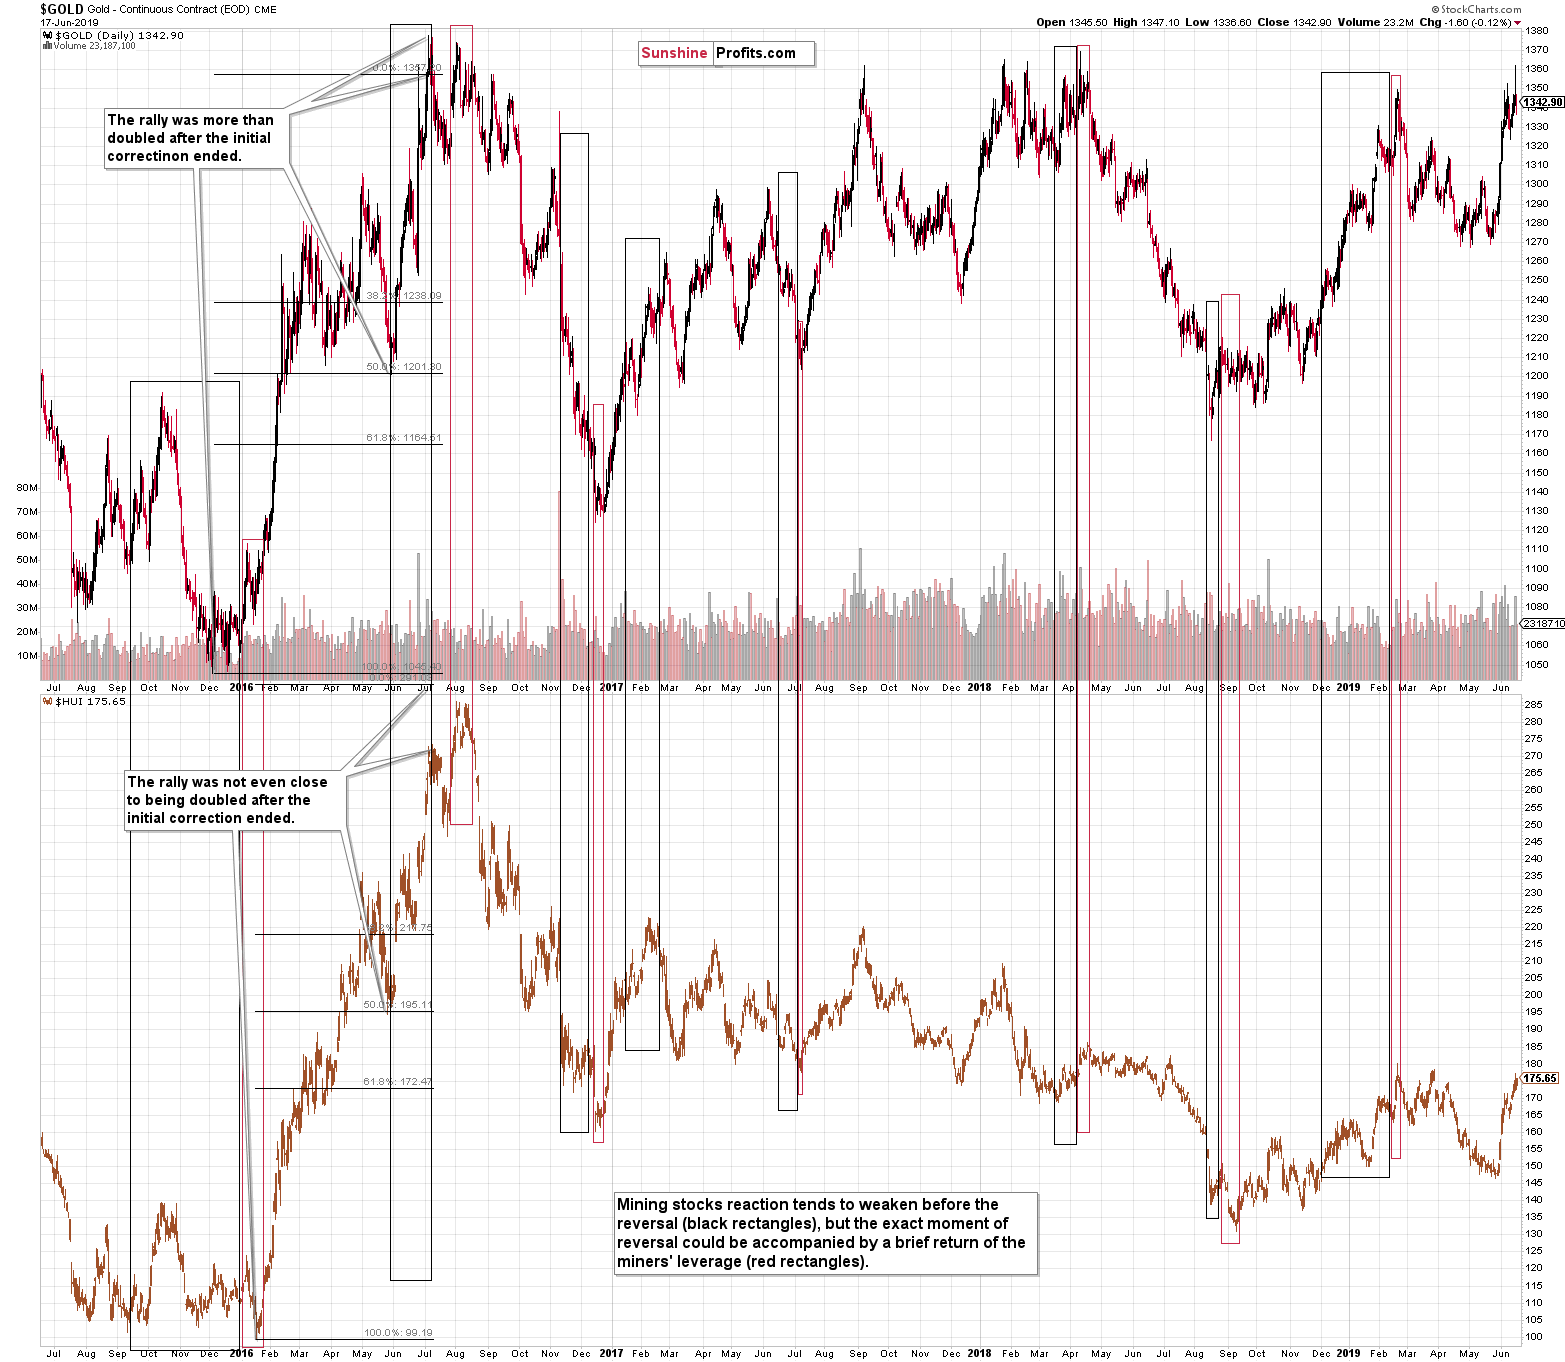
The early-2016 case is the most prominent one, but there were quite a few in the following months and years as well. Even the very end of the 2016 rally was accompanied by a small show of miners' strength.
The black rectangles mark the times when miners' reaction to gold's movement became weaker, and the red rectangles mark the cases when the strength was back right before the final reversal.
What does it mean? It means that if we are looking at a major top right now, this temporary strength in the mining stocks is very normal - it's not a game-changer, or a reason to ignore the huge reversals in gold and silver that we just saw.
Are we looking at a major top right now? Gold reversed in a profound manner after reaching the resistance line based on the previous major tops and silver's intraday reversal was very volatile. Gold miners reached their previous yearly highs. That's exactly what a major top should look like.
Before summarizing, let's take a look at the USD Index.
The USD Index Trend Is Higher
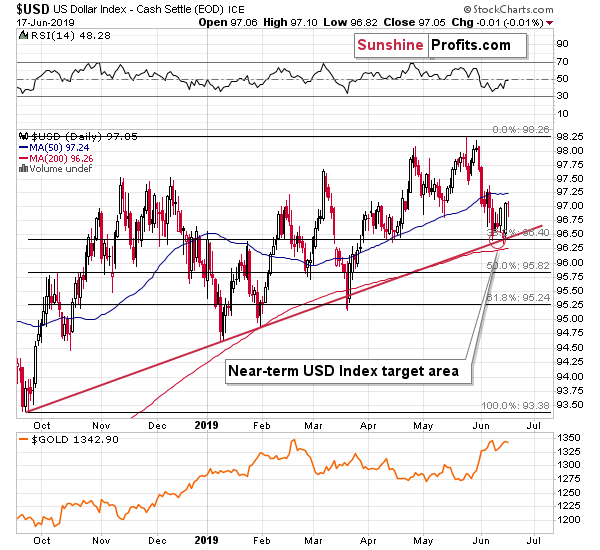
The USD Index bottomed in our target area as it seems to have absorbed the bearish news and is now ready to resume its previous trend - which is up. Our Friday's comments on the news-USD dynamics remain up-to-date:
All the above-mentioned chaotic news were U.S.-centered. It was Iran that was accused of being involved in the attack on the tanker, but who suggested that? The Bloomberg news story's title explains it: "U.S. Says Video Shows Iran Was Involved in an Attack on Tanker". Theoretically anyone can claim anything about any damaged ship. Why did the "American officials release images they said show that Iran was involved in an attack on an oil tanker"? What's the common denominator among all the above?
It's the U.S. dollar. What did the U.S. currency do during - and most importantly - before the 2003 invasion of Iraq (the tensions rose gradually before the war)? The USD Index declined severely. In fact, it was the biggest multi-year decline of the recent history. On a side note, it turned out that there were no weapons of mass destruction found in Iraq, despite the supposed "solid proof" to the contrary. Doesn't the just-released "proof" of Iran's involvement look at least a bit suspicious?
President Trump likely doesn't want any wars - he said so many times - but he knows that words and threats can sometimes do a lot on their own. If a simple tweet can change a lot and move the markets, then a simple accusation that people will associate with "war with Iran" could do even more and cause the USD to decline without any military intervention whatsoever.
The problem is that in 2002 and 2003, the USD was after a powerful rally and significantly overvalued. This time, the technical and - especially - fundamental situation appears quite different. The U.S. dollar may be a bad (fiat) currency, but it's still best house in a bad neighborhood. Europe has quite a lot of structural problems and the Japanese money-printing machine is almost overheating. Which country has actually been raising interest rates and not only talking about it? The U.S.
The market can be tricked on a short- or medium-term basis, but in the long run, the market forces always win. We have already reached the point when surprising news is not something that triggers really big declines in the USD. The amount of people that wants to get into the USD Index at lower prices is growing, while the amount of people that takes the surprising news at its face value is declining. The result is weaker reaction to the downside.
The interesting fact is that because USD appears to be the fiat currency of choice, it acts as a safe haven for many investors. Sure, gold is the real hard currency, but since we live in the fiat world, many people simply prefer the world reserve currency backed by the world's most powerful economy and military. This means that in case of the geopolitical turmoil, especially if it's not directly related to the U.S. - like the just-released "story" about Iran, we could actually see increased demand for the U.S. dollar. The plan to lower the USD value may simply not work this time.
How could this be resolved? The Powers That Be will know that they can't keep the USD low for long, so they would do as much as they can to actually take advantage of it. They - or the companies they "are in association with" - would take aggressive bets on higher USD values before the major breakout. As they would no longer be trying to suppress the price, the rally following the breakout should be very significant.
This means that the decline in the precious metals should be very significant as well.
Today, we would like to show you something that seems to confirm our earlier interpretation of the recent news that all - accidentally? - should have resulted in lower USD values. President Trump keeps attacking the Fed for strong dollar and higher interest rates. And how is the USD Index responding? It keeps moving higher despite periodic corrections (and we keep profiting on various USD-related trades in our Forex Trading Alerts) - it's higher also today (about 0.15 so far) after yesterday's pause. As we wrote above - the plan to lower the USD values doesn't appear to be working. The markets seem to be learning to focus on what's really happening instead of putting great emphasis on easily reversible Twitter politics. Once the USD Index breaks above the 2019 highs, the fireworks should start.
Summary
Summing up, the combination of gold's reaching the very long-term resistance line, the immediate invalidation of the breakout to new 2019 highs, huge volume, proximity of the cyclical turning point, and RSI almost at the 70 level all suggest that the 2019 top for gold is in, and silver's price action clearly confirms it. Yesterday's strength in the mining stocks and today's Draghi-based upswing in gold seem temporary and don't change the overall outlook, which remains down.
We are moving the stop-loss level for the GDX ETF a bit higher as price is relatively close to it and the outlook remains intact.
As always, we'll keep you - our subscribers - informed.
To summarize:
Trading capital (supplementary part of the portfolio; our opinion): Full short position (250% of the full position) in gold, silver, and mining stocks is justified from the risk/reward perspective with the following stop-loss orders and exit profit-take price levels:
- Gold: profit-take exit price: $1,241; stop-loss: $1,382; initial target price for the DGLD ETN: $51.87; stop-loss for the DGLD ETN $38.67
- Silver: profit-take exit price: $13.81; stop-loss: $15.72; initial target price for the DSLV ETN: $39.38; stop-loss for the DSLV ETN $26.97
- Mining stocks (price levels for the GDX ETF): profit-take exit price: $17.61; stop-loss: $24.37; initial target price for the DUST ETF: $34.28; stop-loss for the DUST ETF $13.37
In case one wants to bet on junior mining stocks' prices (we do not suggest doing so - we think senior mining stocks are more predictable in the case of short-term trades - if one wants to do it anyway, we provide the details), here are the stop-loss details and target prices:
- GDXJ ETF: profit-take exit price: $24.71; stop-loss: $35.67
- JDST ETF: profit-take exit price: $78.21 stop-loss: $30.97
Long-term capital (core part of the portfolio; our opinion): No positions (in other words: cash)
Insurance capital (core part of the portfolio; our opinion): Full position
Whether you already subscribed or not, we encourage you to find out how to make the most of our alerts and read our replies to the most common alert-and-gold-trading-related-questions.
Please note that the in the trading section we describe the situation for the day that the alert is posted. In other words, it we are writing about a speculative position, it means that it is up-to-date on the day it was posted. We are also featuring the initial target prices, so that you can decide whether keeping a position on a given day is something that is in tune with your approach (some moves are too small for medium-term traders and some might appear too big for day-traders).
Plus, you might want to read why our stop-loss orders are usually relatively far from the current price.
Please note that a full position doesn't mean using all of the capital for a given trade. You will find details on our thoughts on gold portfolio structuring in the Key Insights section on our website.
As a reminder - "initial target price" means exactly that - an "initial" one, it's not a price level at which we suggest closing positions. If this becomes the case (like it did in the previous trade) we will refer to these levels as levels of exit orders (exactly as we've done previously). Stop-loss levels, however, are naturally not "initial", but something that, in our opinion, might be entered as an order.
Since it is impossible to synchronize target prices and stop-loss levels for all the ETFs and ETNs with the main markets that we provide these levels for (gold, silver and mining stocks - the GDX ETF), the stop-loss levels and target prices for other ETNs and ETF (among other: UGLD, DGLD, USLV, DSLV, NUGT, DUST, JNUG, JDST) are provided as supplementary, and not as "final". This means that if a stop-loss or a target level is reached for any of the "additional instruments" (DGLD for instance), but not for the "main instrument" (gold in this case), we will view positions in both gold and DGLD as still open and the stop-loss for DGLD would have to be moved lower. On the other hand, if gold moves to a stop-loss level but DGLD doesn't, then we will view both positions (in gold and DGLD) as closed. In other words, since it's not possible to be 100% certain that each related instrument moves to a given level when the underlying instrument does, we can't provide levels that would be binding. The levels that we do provide are our best estimate of the levels that will correspond to the levels in the underlying assets, but it will be the underlying assets that one will need to focus on regarding the signs pointing to closing a given position or keeping it open. We might adjust the levels in the "additional instruments" without adjusting the levels in the "main instruments", which will simply mean that we have improved our estimation of these levels, not that we changed our outlook on the markets. We are already working on a tool that would update these levels on a daily basis for the most popular ETFs, ETNs and individual mining stocks.
Our preferred ways to invest in and to trade gold along with the reasoning can be found in the how to buy gold section. Additionally, our preferred ETFs and ETNs can be found in our Gold & Silver ETF Ranking.
As a reminder, Gold & Silver Trading Alerts are posted before or on each trading day (we usually post them before the opening bell, but we don't promise doing that each day). If there's anything urgent, we will send you an additional small alert before posting the main one.
=====
Latest Free Trading Alerts:
Who wouldn't know the Spaghetti Western The Good, the Bad and the Ugly? In today's analysis, we have important pieces of economic data starring in the first two roles. Retail sales and industrial production rebounded in May, while the Empire State Index plummeted in June. How will these reports affect tomorrow's FOMC decision and the gold market?
Gold Awaits the FOMC as Economic Data Send Mixed Signals
Yesterday, we've heard the ECB President speak and tomorrow, it's the Fed's turn. What about the time in between? Well, the markets still move and it's our job to be positioned accordingly so as to profit from whatever is unfolding. And what kind of opportunities we've managed to catch! Good news, the ride is far from over. Let's take a look at the way things are shaping up. We'll then sharpen our battle plans accordingly. We even have a new candidate for opening a long position to tell you about!
Let's Gain Even More on the Sliding Euro and Pound
=====
Thank you.
Sincerely,
Przemyslaw Radomski, CFA
Editor-in-chief, Gold & Silver Fund Manager

