

Briefly: in our opinion, full (300% of the regular position size) speculative short positions in junior mining stocks are justified from the risk/reward point of view at the moment of publishing this Alert.
It’s Fed decision day! Will the rally in stocks continue? Will miners follow stocks higher or gold lower? Charts provide hints.
Let’s start with something that usually happens at this time of the month.
The USD Index tends to reverse its direction.
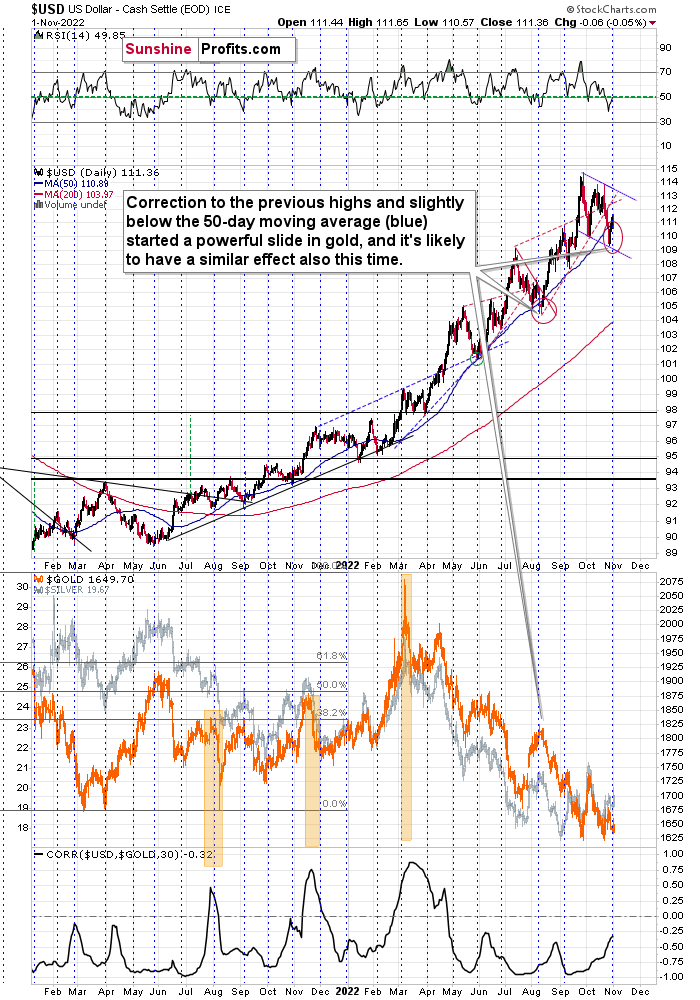
It seems that’s exactly what we saw recently. The USDX dipped below its 50-day moving average, and each time that happened since mid-2021, it meant that a bottom was in or just around the corner.
At the same time, the USDX moved to the lower border of the flag pattern and approximately to the previous (July) high.
This is all bullish, not just per se, but also because we saw something very similar in early August, earlier this year. What happened next? Well, not only did the USD Index rally, but gold fell like a stone in water.
The main difference this time is that gold (the lower part of the above chart) is not after a rally that’s as big as the July rally was. In other words, gold is now weaker, and the situation is now more bearish for gold than it was in early August.
During its most recent run-up, gold wasn’t even able to get back above the $1,700 level. It’s weak, and it’s all really, really bearish.
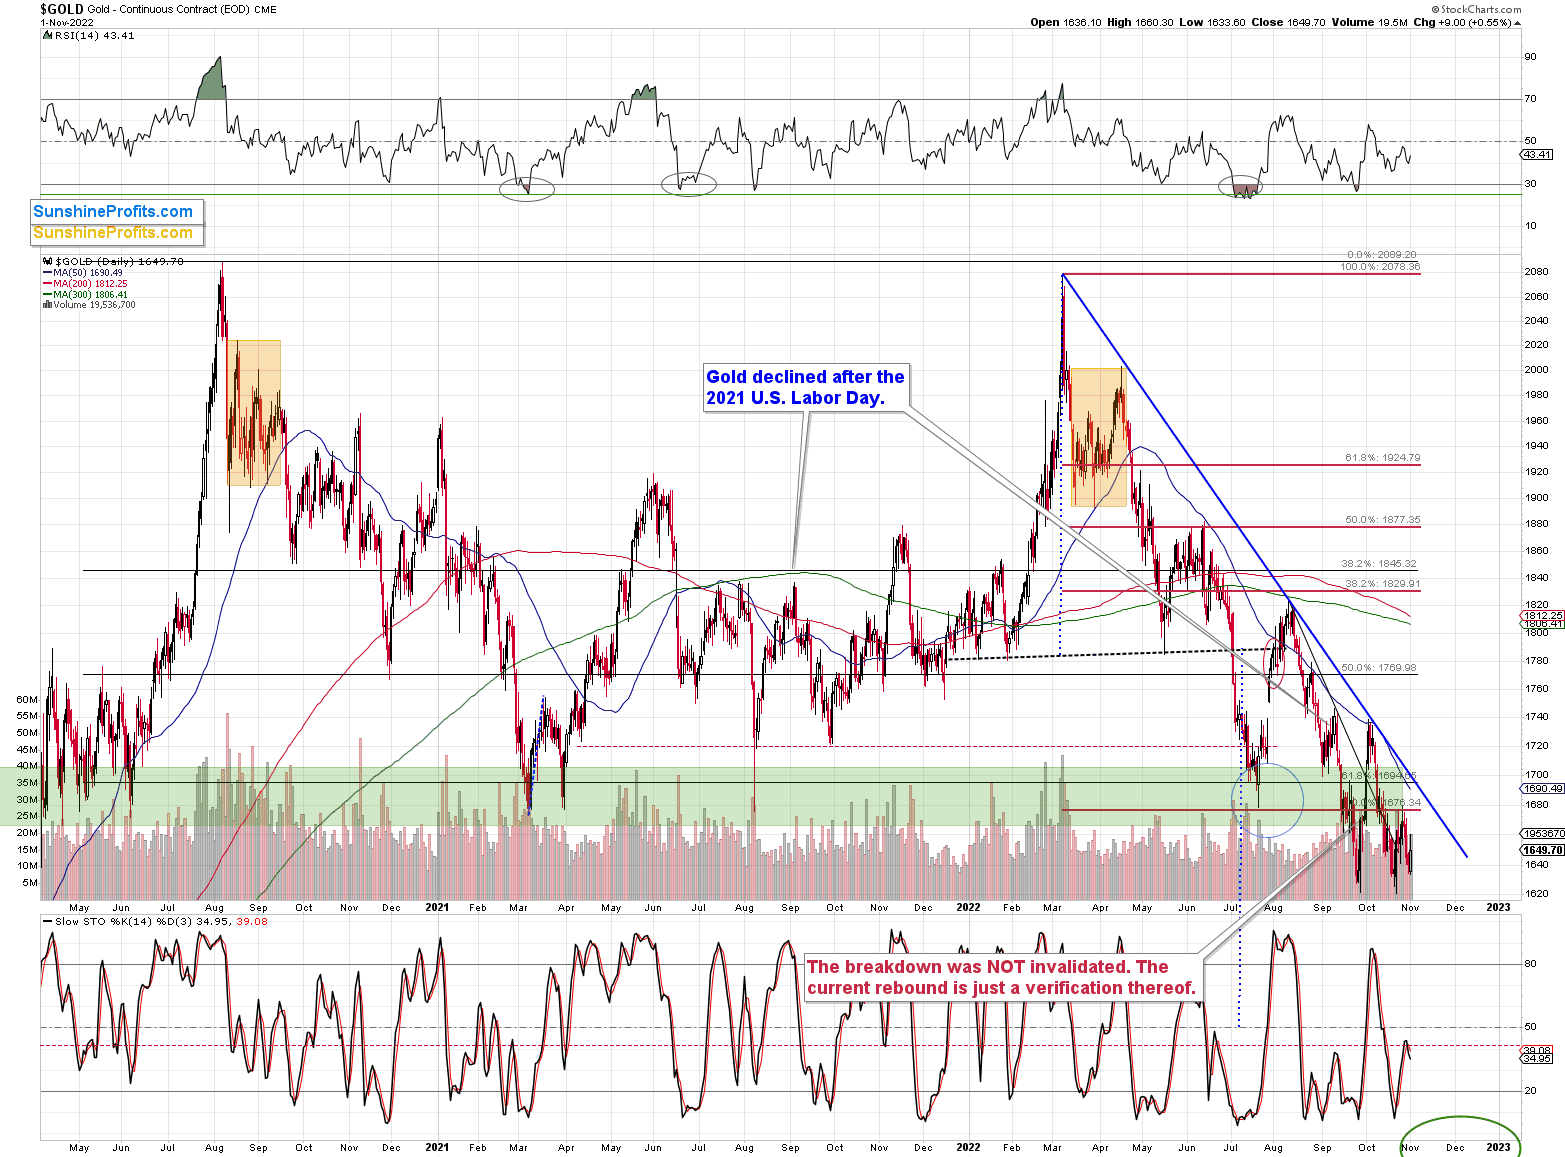
Instead of moving back above $1,700, gold verified its breakdown below this level, and we saw a fresh sell signal from the stochastic indicator. Yes, it’s a bearish combination of factors.
If it wasn’t enough, we just saw a major sell indication from the silver market.
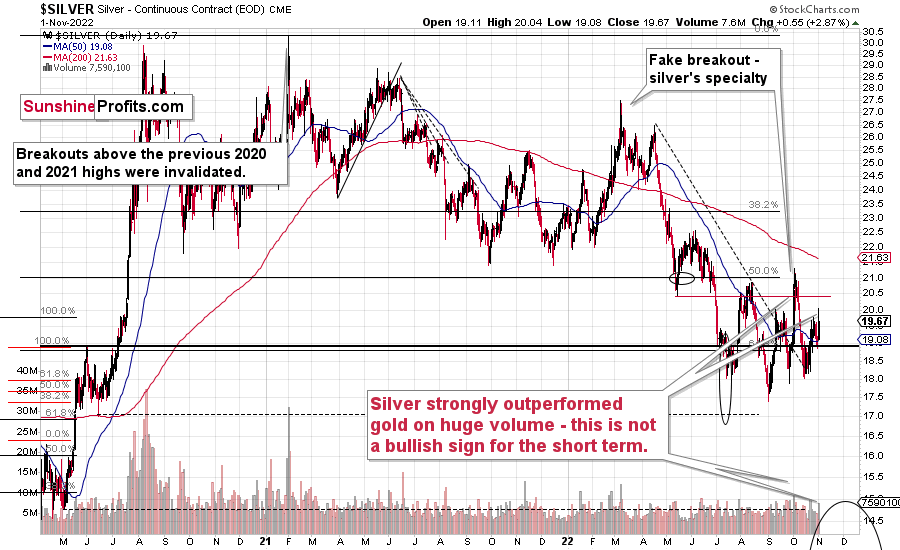
The signal comes from silver’s very short-term outperformance of gold. Whenever something like that happens (especially on strong volume) after a rally, it’s an indication that the rally is either over or about to be over. And yes, yesterday’s rally (and intraday reversal) took place on relatively strong volume.
Remember the fake early-October rally? That was yet another example of this technique in action.
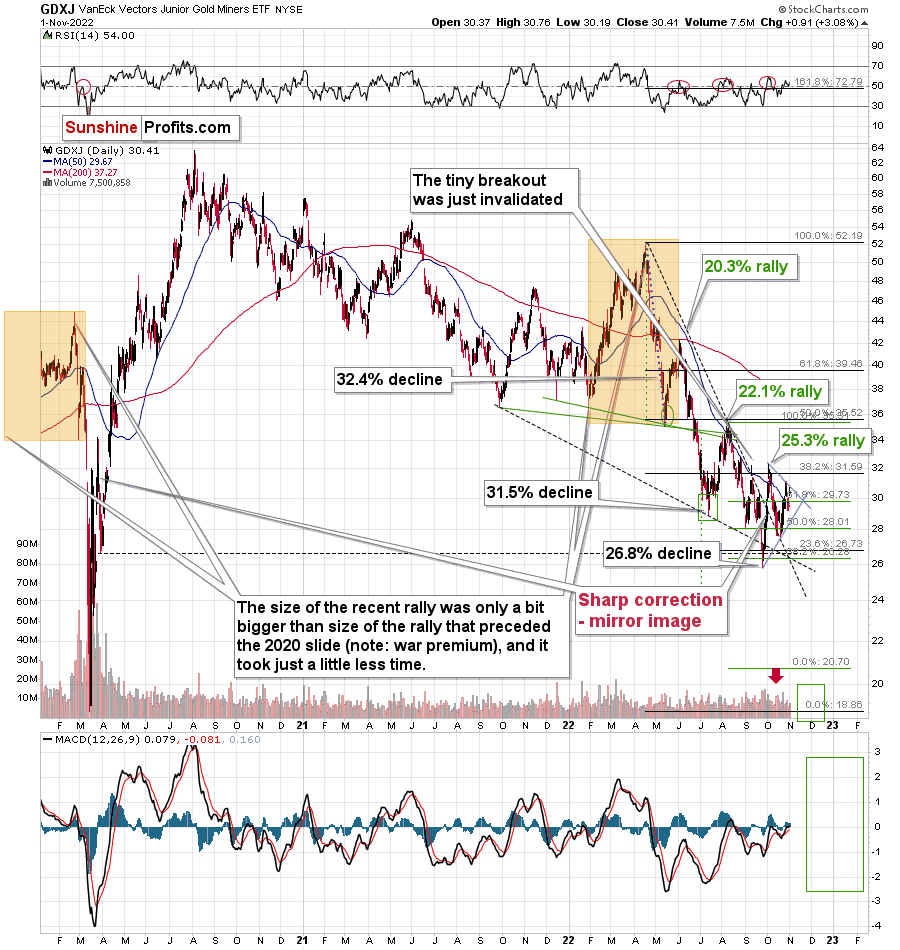
Junior miners moved a bit higher yesterday, but our short positions in them remain profitable nonetheless (and we keep the 100% profitability in the 2022 trades, at least as long as one uses the GDXJ).
Interestingly, the most recent short-term upswing materialized practically right at the vertex of the triangle, based on the two black, dashed support/resistance lines. The vertexes tend to mark reversals, and the most recent move was to the upside, which means that the implications are bearish here.
And now for the part that I get most questions about – the stock market.
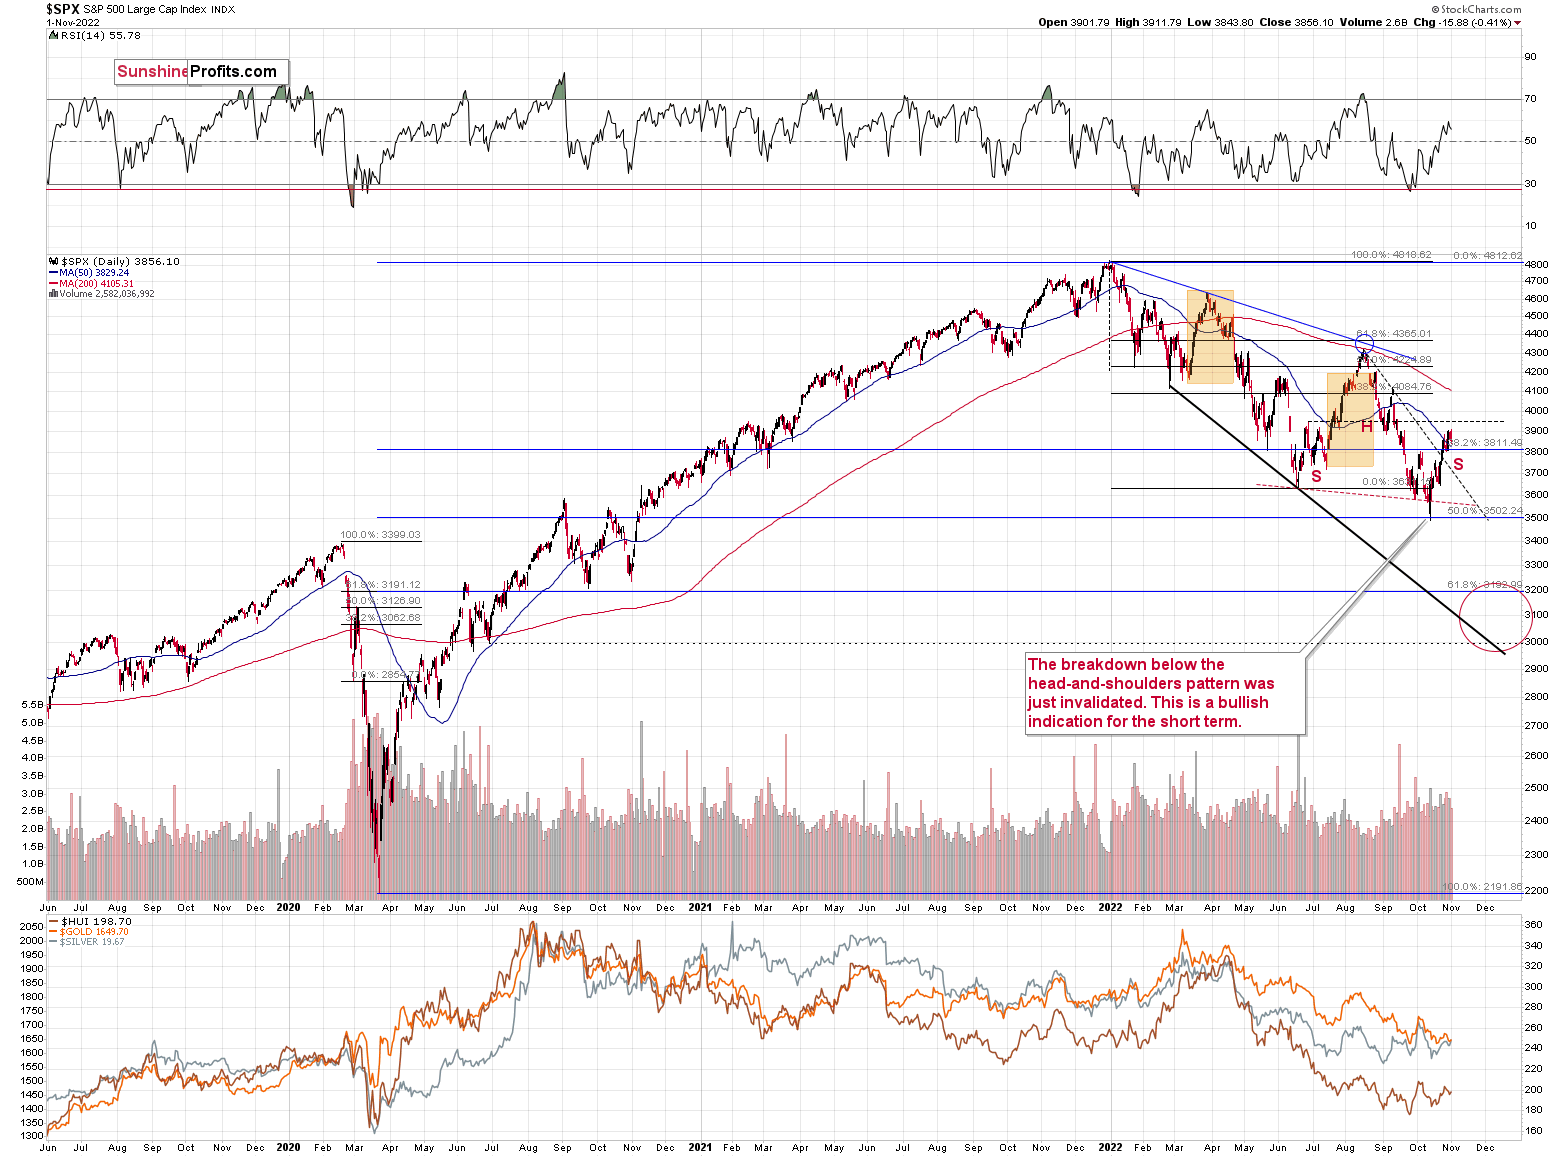
The S&P 500 recently rallied to new monthly highs, which caught investors’ eyes. However, as the index didn’t move above its June 2022 high, the head and shoulders formation could still be completed.
In the case of the S&P 500 index, there is a visible breakout above the declining dashed resistance line based on the August and September 2022 highs.
However, once we zoom in and focus on S&P 500 index futures, it becomes clear that the situation is much more bearish than it seems at first glance.
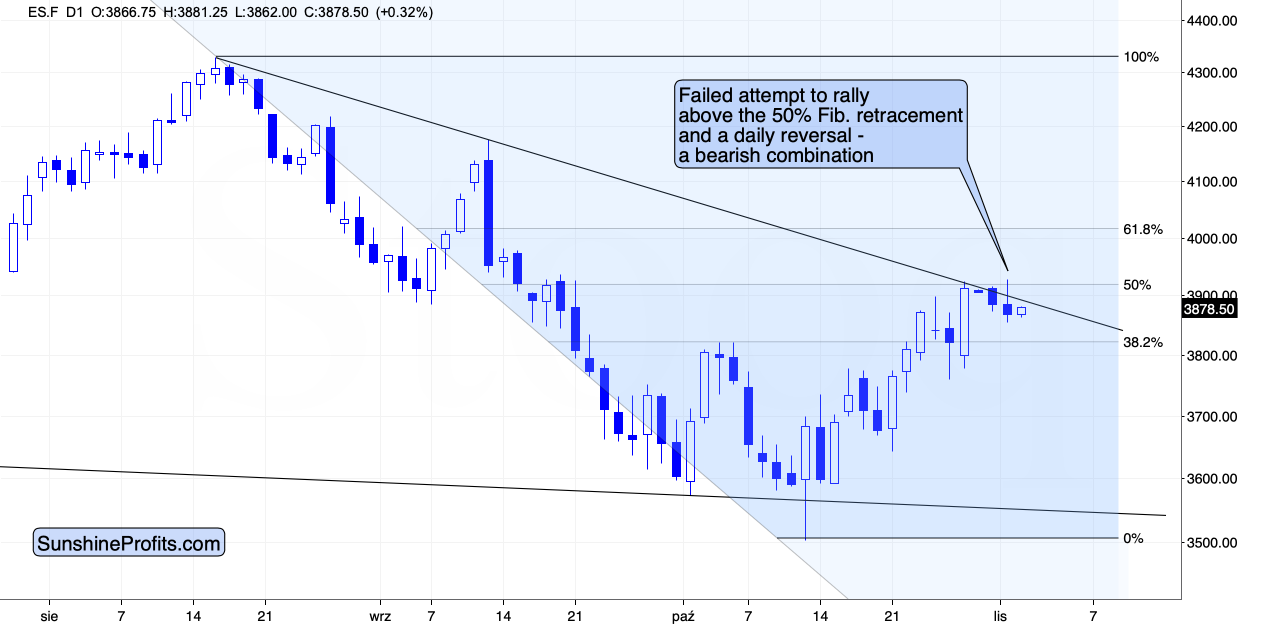
The index futures have longer trading hours than the index, so the above chart includes a broader data range. In many cases, the U.S. session would be key and overnight trading wouldn’t be that important, but in the case of the S&P 500 index futures, those trades are important as this extremely popular index/futures is being traded all over the world, and the sizes of those transactions are not minor.
In other words, paying attention to the S&P 500 index futures is a good idea.
The above chart shows that we just saw a failed attempt to break above the declining resistance line, the October highs, and the 50% Fibonacci retracement based on the August-October decline. This is a powerfully bearish combination.
On top of that, yesterday’s session took the form of a daily reversal.
And yes, this is all bearish news for the stock market.
This, in turn, means that the positive impact that the stock market had on the prices of mining stocks is likely to be reversed. This, plus the bearish implications of gold and silver charts, tells us that the very bearish outlook for mining stocks (especially junior mining stocks) remains up-to-date – at least for the next few weeks-months. In my view, they are likely to rally in the very long run, but not without a bigger decline first.
Having said that, let’s take a look at the market from a more fundamental point of view.
Powell’s Podium
It’s the FOMC’s time to shine, and anxious investors will be glued to Fed Chairman Jerome Powell’s press conference. Moreover, after the Bank of Canada (BoC) surprised the consensus with a 50 basis point rate hike on Oct. 26, concern has arisen that the Fed could follow suit. Likewise, if Powell strikes a conciliatory tone and provides dovish forward guidance, gold, silver, mining stocks and the S&P 500 could receive short-term support.
To explain, JPMorgan traders told clients on Oct. 31 that “we think the [S&P 500’s] risk/reward is to the upside” since “the market had every reason to retest [the] lows given the disappointment from megacap tech earnings and still moved higher.”
As a result, the team analyzed various FOMC scenarios that could see the S&P 500 rising as much as 12% and falling as much as 8%.
Please see below:
 Source: Bloomberg
Therefore, since JPMorgan's team said "we think" the S&P 500 will rally, the group is merely guessing. Furthermore, with four bullish scenarios and two bearish scenarios outlined, their 67% probability of a bullish outcome matches the four out of six (67%) times the S&P 500 rallied during the last six Fed meetings.
As such, while the magnitudes of their expected moves are larger, the S&P 500 often rises during Fed announcements, and JPMorgan's analysis is similar to the results from recent history.
In addition, hypothesizing about the short-term impact of Powell's words isn't worthwhile because it's unclear what he might say, and the market impact is also uncertain. So the critical point is that daily moves are largely inconsequential from a medium-term perspective, and choosing the right time horizon increases the accuracy of forecasts.
Please see below:
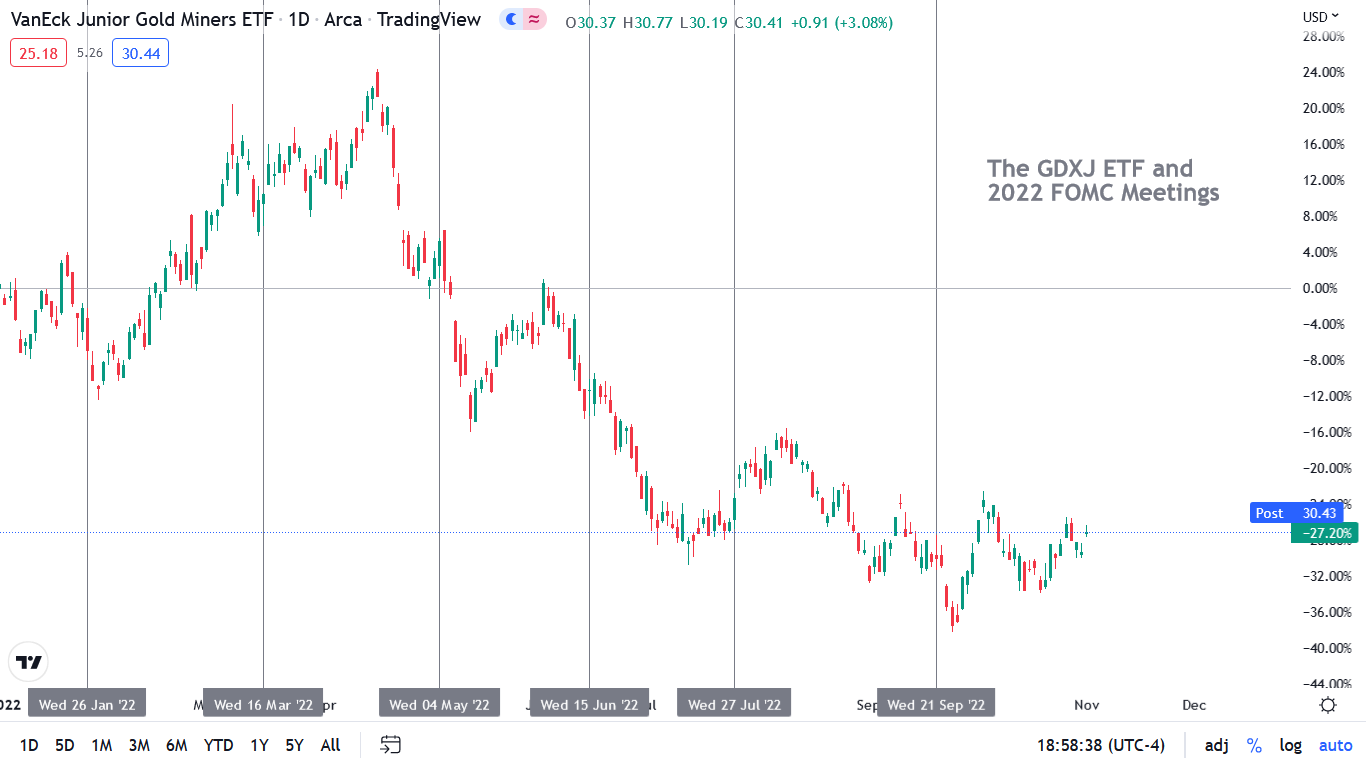
To explain, the candlestick chart above tracks the GDXJ ETF, while the horizontal gray lines depict FOMC meetings. As it stands, the GDXJ ETF has declined soon after four of the last (67%) six events, and the junior miners’ index is down by more than 25% in 2022; and while I’ve been bullish on Fed policy and bearish on the PMs for many months, nothing that Powell said (or didn’t say) during any of these meetings changed the GDXJ ETF’s medium-term technicals or fundamentals.
Also, please remember that the GDXJ ETF has sunk to new lows throughout 2022, and while Powell did his best to talk down the USD Index and risk rallies often followed, much of that dovish rhetoric occurred before he realized his error on inflation.
Thus, while leaning dovish today would only erode what little inflation progress has been realized, even if Powell does, history shows his words have no bearing on the GDXJ ETF’s medium-term path; and with the economic challenges that helped upend the junior miners’ index poised to persist, the lesson from 2021 and 2022 is that Powell can’t fix his inflation problem with hope and market-friendly comments.
Good News Is Bad News
While the bulls wish for depressing data and hope it will support a dovish pivot, a resilient U.S. labor market continues to dash those dreams; and while I warned for months that the U.S. economy was much more resilient than some portrayed, the pivot predictors’ lack of objectivity has been their downfall. To explain, I wrote on May 4:
While investors continue to pray for a dovish pivot, they’re likely in for a rude awakening. The U.S. labor market remains abnormally hot, and the latest PMI data shows that inflation is still accelerating. Moreover, while real yields have turned positive, they have done little to cool a U.S. economy that’s flooded with too much stimulus. As a result, with a hawkish Fed poised to push the U.S. 10-Year real yield even higher over the medium term, the PMs should suffer mightily as the drama unfolds.
Likewise, while the U.S. 10-Year real yield has soared to decade-plus highs, the employment backdrop continues to support more hawkish policy in the months ahead. For example, JOLTS job openings came in at 10.717 million on Nov. 1 and outperformed the consensus estimate of 10 million.
Please see below:
 Source: Investing.com
More importantly, the uprising means there are now 4.964 million more job openings in the U.S. than citizens unemployed.
Please see below:
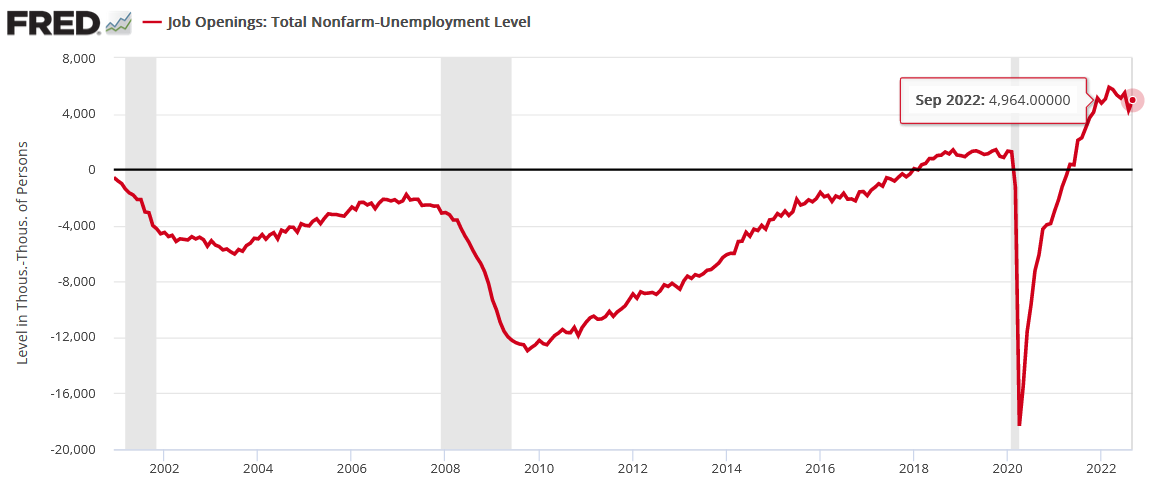
To explain, the red line above subtracts the number of unemployed U.S. citizens from the number of U.S. job openings. If you analyze the right side of the chart, you can see that there are many more jobs available than people looking for work, and the metric remains well above any pre-pandemic reading. So the Fed’s 2022 rate hikes have not done enough to cool labor demand or wage inflation.
To that point, the Institute for Supply Management (ISM) released its Manufacturing PMI on Nov. 1. The headline index decreased from 50.9 in September to 50.2 in October. However, the employment index increased. The report stated:
“ISM’s Employment Index registered 50 percent in October, 1.3 percentage points higher than the September reading of 48.7 percent. The index indicated employment was unchanged after contracting for one month.”
As such, with employment still uplifted, the demand destruction necessary to induce a pivot has yet to materialize.
As further evidence, S&P Global released its U.S. Manufacturing PMI on Nov. 1. The headline index decreased from 52 in September to 50.4 in October. Moreover, inflationary pressures were mixed, as “average cost burdens continued to rise at a historically elevated rate in October” but “resulted in the slowest rise in selling prices since February 2021.”
However, employment remained resilient.
Please see below:
 Source: S&P Global
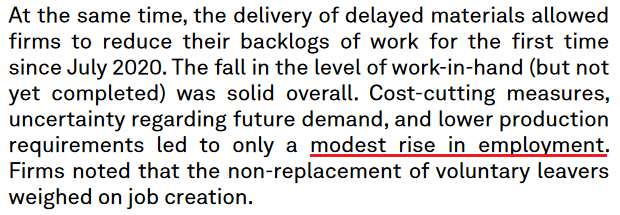
Now, I’m not insulating that the U.S. economy is firing on all cylinders. However, please remember that it’s all relative, and “a modest rise in employment” is bullish for the U.S. federal funds rate (FFR) because the Fed needs a higher unemployment rate to cool wage inflation.
Continuing the theme, the Dallas Fed released its Texas Manufacturing Outlook Survey on Oct. 31. For context, the data is less impactful than the ISM or S&P Global’s results because the former is a regional survey and the latter two are conducted nationwide. However, the employment implications are material. The report stated:
“Labor market measures continued to indicate robust employment growth, though workweeks are no longer lengthening. The employment index ticked up to 17.1, a reading significantly above its series average of 7.8. Twenty-six percent of firms noted net hiring, while 9 percent noted net layoffs.”
Likewise, the Dallas Fed’s Texas Service Sector Outlook Survey (released on Nov. 1) painted a similar portrait. An excerpt read:
“Labor market indicators suggested continued employment growth and longer workweeks in October. The employment index fell one point to 9.0, while the part-time employment index improved from 1.5 in September to 2.9 in October. The hours worked index moved up two points to 5.1.”
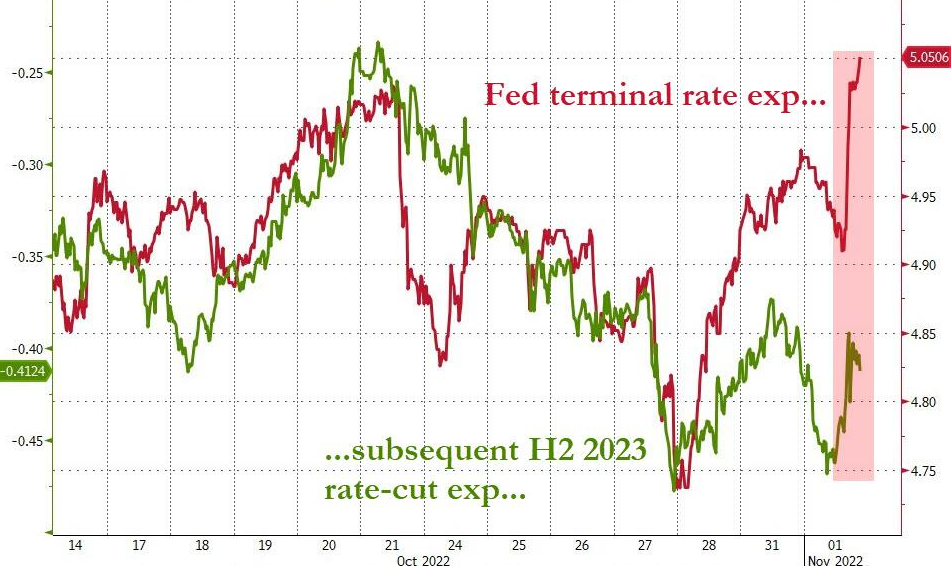
Thus, with employment demand still outweighing supply, nothing that Powell says today will change this. Moreover, since the imbalance is bullish for wage inflation, a higher FFR is needed to suppress demand further and reduce the competition for workers; and realizing this, investors rate hike expectations moved back toward reality on Nov. 1.
Please see below:
 Source: Bloomberg/ZeroHedge
To explain, the red line above tracks the peak FFR implied by the futures market, while the green line above tracks the inverted (down means up) number of rate cuts thereafter. If you analyze the right side of the chart, you can see that the red line surpassed 5% and hit a new 2022 high on Nov. 1. In addition, the green line’s ascent means investors are pricing in fewer rate cuts in the second half of 2022.
As a result, the data shows that the hawkish realities I warned about throughout 2021 and 2022 are far from resolved.
The Bottom Line
While Powell’s presser may determine the financial market’s next move, investors have shown a willingness to bid up prices after his speeches end. However, with the short-term optimism often evaporating soon after, countertrend rallies have not stopped the GDXJ ETF or the S&P 500 from hitting new lows in 2022. So, while volatility should be amplified, the daily noise is much more semblance than substance, and the medium-term outlook continues to unfold as expected.
In conclusion, the PMs rallied on Nov. 1, as the USD Index was roughly flat, and the U.S. 10-Year real yield rose slightly. However, with inflation still highly problematic and the U.S. labor market decelerating at a snail’s pace, further monetary policy tightening should weigh on the PMs over the next few months.
Overview of the Upcoming Part of the Decline
- It seems to me that the corrective upswing is over, and that the next big move lower is already underway.
- If we see a situation where miners slide in a meaningful and volatile way while silver doesn’t (it just declines moderately), I plan to – once again – switch from short positions in miners to short positions in silver. At this time, it’s too early to say at what price levels this could take place and if we get this kind of opportunity at all – perhaps with gold prices close to $1,500 - $1,550.
- I plan to switch from the short positions in junior mining stocks or silver (whichever I’ll have at that moment) to long positions in junior mining stocks when gold / mining stocks move to their 2020 lows (approximately). While I’m probably not going to write about it at this stage yet, this is when some investors might consider getting back in with their long-term investing capital (or perhaps 1/3 or 1/2 thereof).
- I plan to return to short positions in junior mining stocks after a rebound – and the rebound could take gold from about $1,450 to about $1,550, and it could take the GDXJ from about $20 to about $24.
- I plan to exit all remaining short positions once gold shows substantial strength relative to the USD Index while the latter is still rallying. This may be the case with gold prices close to $1,400 and GDXJ close to $15 . This moment (when gold performs very strongly against the rallying USD and miners are strong relative to gold after its substantial decline) is likely to be the best entry point for long-term investments, in my view. This can also happen with gold close to $1,400, but at the moment it’s too early to say with certainty.
- The above is based on the information available today, and it might change in the following days/weeks.
You will find my general overview of the outlook for gold on the chart below:
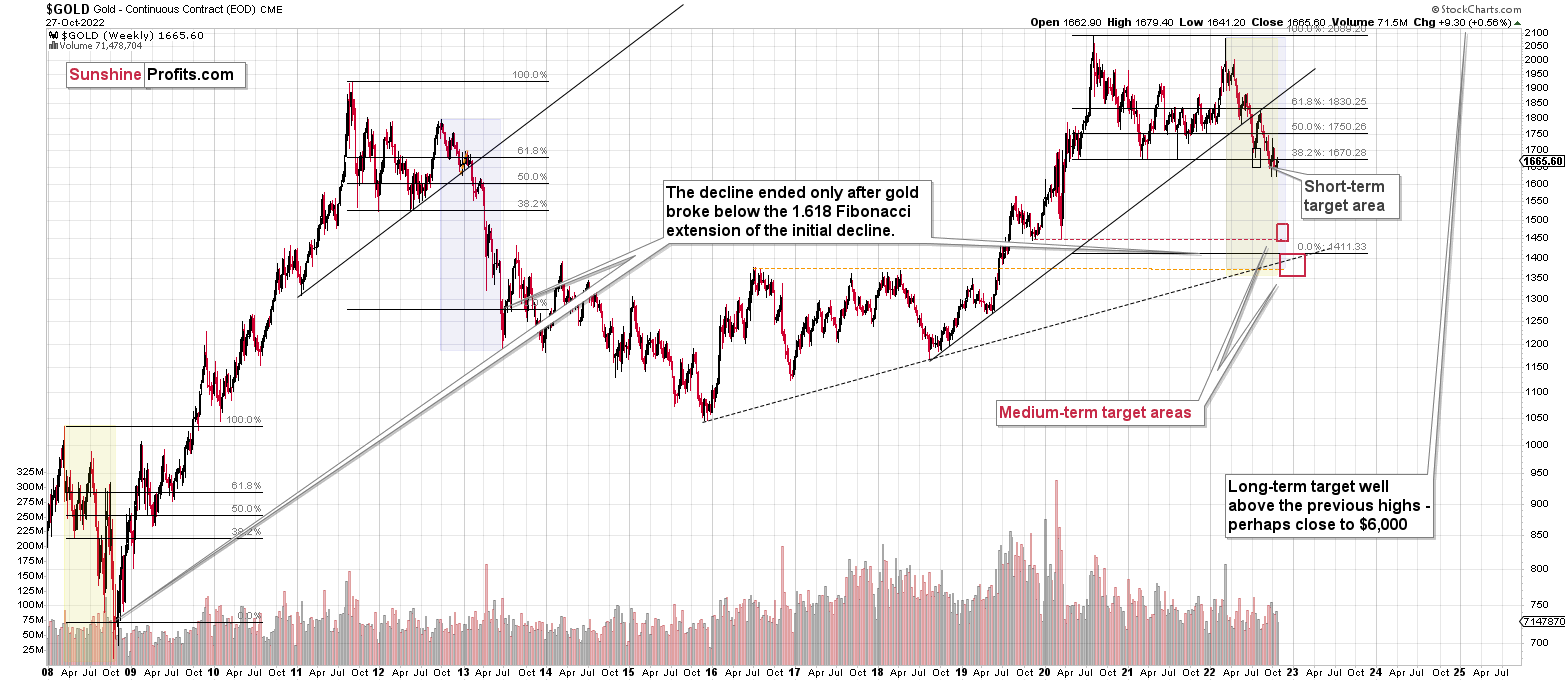
Please note that the above timing details are relatively broad and “for general overview only” – so that you know more or less what I think and how volatile I think the moves are likely to be – on an approximate basis. These time targets are not binding nor clear enough for me to think that they should be used for purchasing options, warrants, or similar instruments.
Summary
Summing up, it seems that the biggest part of the 2013-like decline is taking place right now, and – while I can’t make any promises regarding performance - it seems likely to me that our big profits are about to become huge, and then ridiculously big in the relatively near future.
As I have written before, the recent upswing didn’t change anything. While the mining stocks appeared “strong” recently, it seems to me that it’s just a reflection of the temporary (in my view) strength in the general stock market. And as stocks decline, mining stocks – and especially junior mining stocks – are likely to truly slide.
Things might happen very fast in the coming days, and if I plan to make any adjustments, I’ll keep you informed. Still, if the targets that I’m mentioning in the “Trading” part of the summary are reached, I think that profits should be taken off the table without an additional confirmation from me. I will probably get on the long side of the market at that time, but I’ll send a confirmation if I decide to do so.
After the final sell-off (that takes gold to about $1,350-$1,500), I expect the precious metals to rally significantly. The final part of the decline might take as little as 1-5 weeks, so it's important to stay alert to any changes.
As always, we'll keep you – our subscribers – informed.
To summarize:
Trading capital (supplementary part of the portfolio; our opinion): Full speculative short positions (300% of the full position) in junior mining stocks are justified from the risk to reward point of view with the following binding exit profit-take price levels:
Mining stocks (price levels for the GDXJ ETF): binding profit-take exit price: $20.32; stop-loss: none (the volatility is too big to justify a stop-loss order in case of this particular trade)
Alternatively, if one seeks leverage, we’re providing the binding profit-take levels for the JDST (2x leveraged). The binding profit-take level for the JDST: $27.87; stop-loss for the JDST: none (the volatility is too big to justify a SL order in case of this particular trade).
For-your-information targets (our opinion; we continue to think that mining stocks are the preferred way of taking advantage of the upcoming price move, but if for whatever reason one wants / has to use silver or gold for this trade, we are providing the details anyway.):
Silver futures downside profit-take exit price: $12.32
SLV profit-take exit price: $11.32
ZSL profit-take exit price: $74.87
Gold futures downside profit-take exit price: $1,504
HGD.TO – alternative (Canadian) 2x inverse leveraged gold stocks ETF – the upside profit-take exit price: $18.47
HZD.TO – alternative (Canadian) 2x inverse leveraged silver ETF – the upside profit-take exit price: $46.87
Long-term capital (core part of the portfolio; our opinion): No positions (in other words: cash)
Insurance capital (core part of the portfolio; our opinion): Full position
Whether you’ve already subscribed or not, we encourage you to find out how to make the most of our alerts and read our replies to the most common alert-and-gold-trading-related-questions.
Please note that we describe the situation for the day that the alert is posted in the trading section. In other words, if we are writing about a speculative position, it means that it is up-to-date on the day it was posted. We are also featuring the initial target prices to decide whether keeping a position on a given day is in tune with your approach (some moves are too small for medium-term traders, and some might appear too big for day-traders).
Additionally, you might want to read why our stop-loss orders are usually relatively far from the current price.
Please note that a full position doesn't mean using all of the capital for a given trade. You will find details on our thoughts on gold portfolio structuring in the Key Insights section on our website.
As a reminder - "initial target price" means exactly that - an "initial" one. It's not a price level at which we suggest closing positions. If this becomes the case (as it did in the previous trade), we will refer to these levels as levels of exit orders (exactly as we've done previously). Stop-loss levels, however, are naturally not "initial", but something that, in our opinion, might be entered as an order.
Since it is impossible to synchronize target prices and stop-loss levels for all the ETFs and ETNs with the main markets that we provide these levels for (gold, silver and mining stocks - the GDX ETF), the stop-loss levels and target prices for other ETNs and ETF (among other: UGL, GLL, AGQ, ZSL, NUGT, DUST, JNUG, JDST) are provided as supplementary, and not as "final". This means that if a stop-loss or a target level is reached for any of the "additional instruments" (GLL for instance), but not for the "main instrument" (gold in this case), we will view positions in both gold and GLL as still open and the stop-loss for GLL would have to be moved lower. On the other hand, if gold moves to a stop-loss level but GLL doesn't, then we will view both positions (in gold and GLL) as closed. In other words, since it's not possible to be 100% certain that each related instrument moves to a given level when the underlying instrument does, we can't provide levels that would be binding. The levels that we do provide are our best estimate of the levels that will correspond to the levels in the underlying assets, but it will be the underlying assets that one will need to focus on regarding the signs pointing to closing a given position or keeping it open. We might adjust the levels in the "additional instruments" without adjusting the levels in the "main instruments", which will simply mean that we have improved our estimation of these levels, not that we changed our outlook on the markets. We are already working on a tool that would update these levels daily for the most popular ETFs, ETNs and individual mining stocks.
Our preferred ways to invest in and to trade gold along with the reasoning can be found in the how to buy gold section. Furthermore, our preferred ETFs and ETNs can be found in our Gold & Silver ETF Ranking.
As a reminder, Gold & Silver Trading Alerts are posted before or on each trading day (we usually post them before the opening bell, but we don't promise doing that each day). If there's anything urgent, we will send you an additional small alert before posting the main one.
Thank you.
Przemyslaw K. Radomski, CFA
Founder, Editor-in-chief

