

Briefly: in our opinion, full (300% of the regular position size) speculative short positions in junior mining stocks are justified from the risk/reward point of view at the moment of publishing this Alert.
Gold’s breakout above $2,000 was officially invalidated, and given the weekly reversal, it seems that the war-uncertainty-based rally is over.
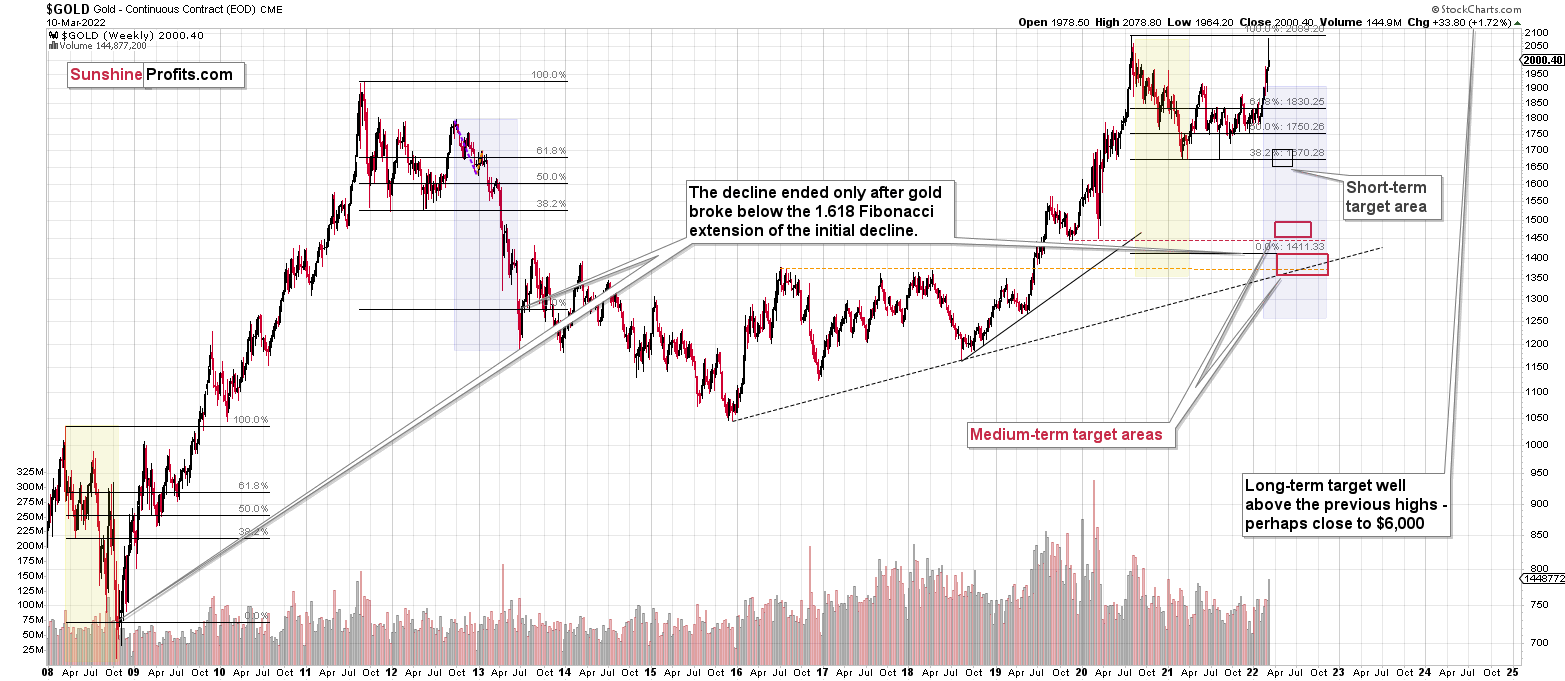
Let’s start today’s analysis with gold’s weekly chart, which shows last week’s key development.
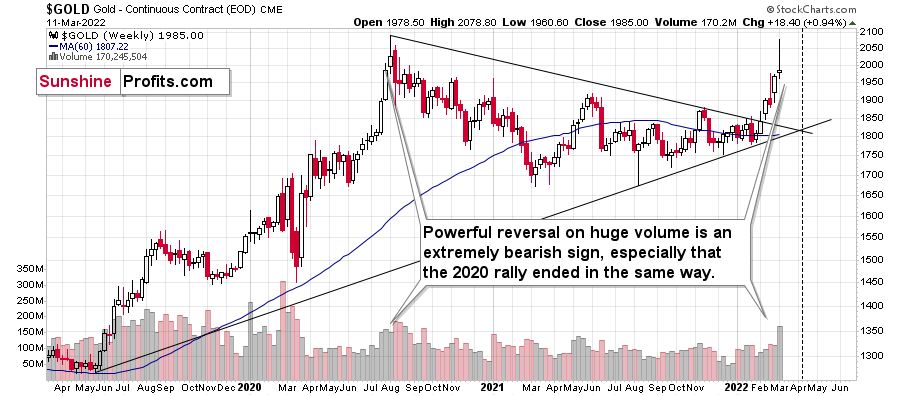
By key development, I mean – of course – gold’s failed attempt to rally above its 2020 high that ended in a powerful weekly reversal candlestick. These patterns are particularly bearish when they are accompanied by strong volume, and that’s exactly what we saw last week.
Gold reversed on volume that was huge – it was the biggest weekly volume that we’ve seen in months.
In fact, it was the highest weekly volume that we saw while gold still ended the week higher than the week that directly preceded the 2020 slide.
Friday’s decline (and today’s pre-market ~$15 decline) are in tune with what I wrote about gold based on its short-term chart.
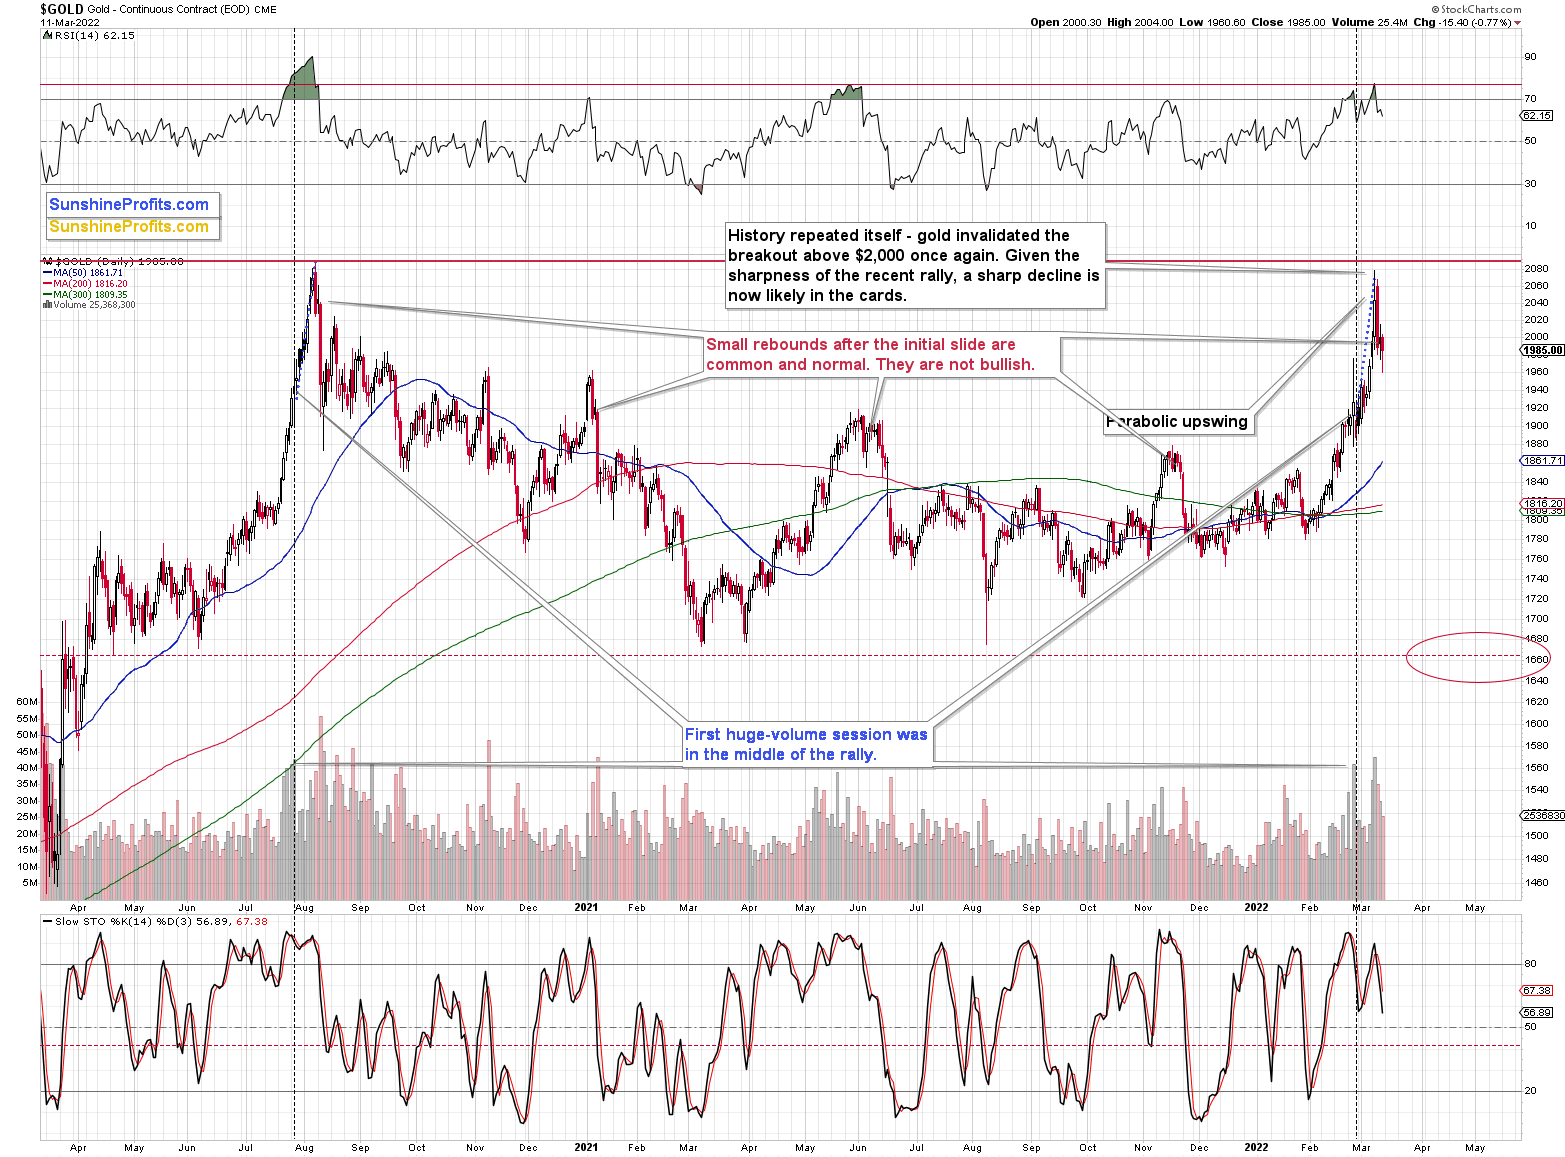
On Friday, I wrote the following:
Gold’s move of $0.40 (yes, forty cents) above $2,000 is not important as the breakout above this level was just invalidated the previous day. Technically, this is another attempt to break above this level, which is likely to be invalidated based on what we see in today’s pre-market trading.
The fact that I would like to emphasize today is that this kind of small rebound after the initial slide is common and perfectly normal for gold. We saw exactly the same thing right after gold’s 2020 top and after its 2021 top, and also two times more in 2021 (as marked on the above chart).
This means that yesterday’s upswing is not particularly bullish. It’s a normal post-top reaction. Lower gold values are to be expected.
Silver didn’t do much on Friday, but that’s also in tune with what I wrote previously (and what happened in 2020, before the slide – silver didn’t decline that fast initially; it caught up later.)
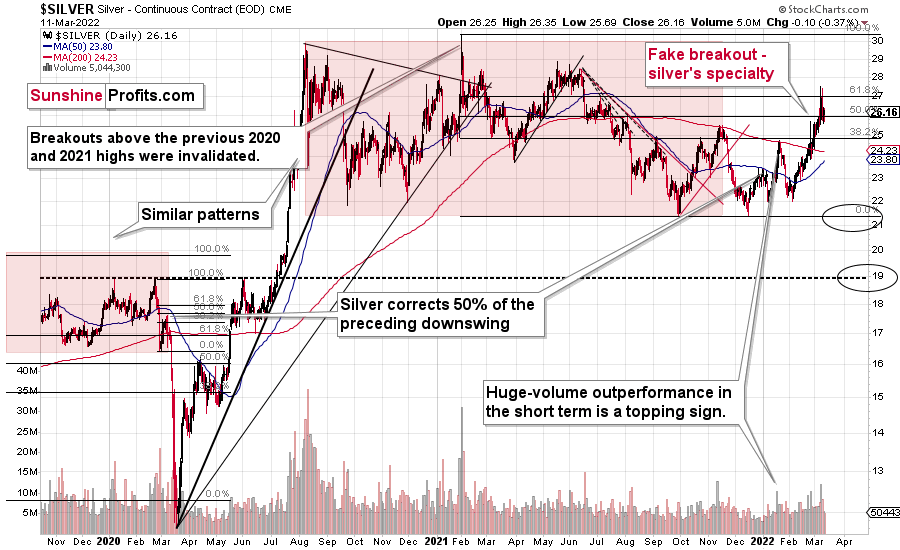
On Friday, I commented on the above chart in the following way:
(…) the white metal just invalidated the move above its 61.8% Fibonacci retracement.
That’s bearish on its own, but let’s keep in mind that it happened right after silver outperformed gold.
On Tuesday, the GDXJ ETF was up by less than 1%, gold was up by 2.37%, and silver was up by 4.57%. Silver’s outperformance and miners’ underperformance is what we tend to see right at the tops. That’s exactly what it was – a top. Silver declined profoundly, and the attempt to break above its 61.8% Fibonacci retracement level will soon be just a distant (in terms of price) memory.
On a medium-term basis, silver was simply weak relative to gold, but we saw short-term outperformance. In short, that was and continues to be bearish.
How high could silver go before declining? Given all that I wrote above, I think that silver’s top is already in. However, if it isn’t, I don’t think it would manage to move above $30.
As far as silver’s big picture is concerned, please note that it also provides us with a confirmation of the analogy between 2012 and now.
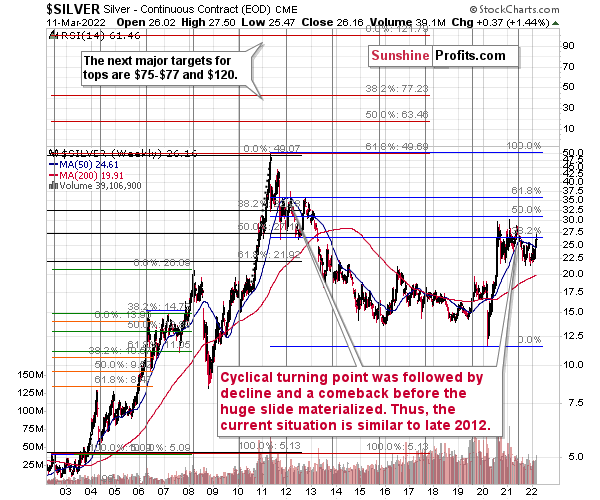
At the turn of the year in 2011/2012, there was a cyclical turning point in silver, and we saw a sizable decline in silver shortly thereafter. The same happened in 2021, after silver’s cyclical turning point.
Back in 2012, silver declined more or less to its previous lows and then rallied back up, but it didn’t reach its previous top. It more or less rallied to its 50-week moving average and then by about the same amount before topping.
Recently, we saw exactly the same thing. After the initial decline, silver bottomed close to its previous lows, and most recently it rallied to its 50-week moving average and then by about the same amount before topping – below the previous high.
Thus, the situation is just like what it was during the 2012 top in all three key components of the precious metals sector: in gold, silver, and mining stocks.
We have a situation in the general stock market that points to an even quicker slide than what we saw in 2012-2013. If stocks slide sharply and significantly just like in 2008, then the same fate may await the precious metals sector – just like in 2008. In this case, silver and mining stocks (in particular, junior mining stocks) would be likely to fall in a spectacular manner.
All the above remains up-to-date given what happened on Friday and what’s happening in today’s pre-market trading.
The situation hasn’t really changed in the case of the mining stocks either.
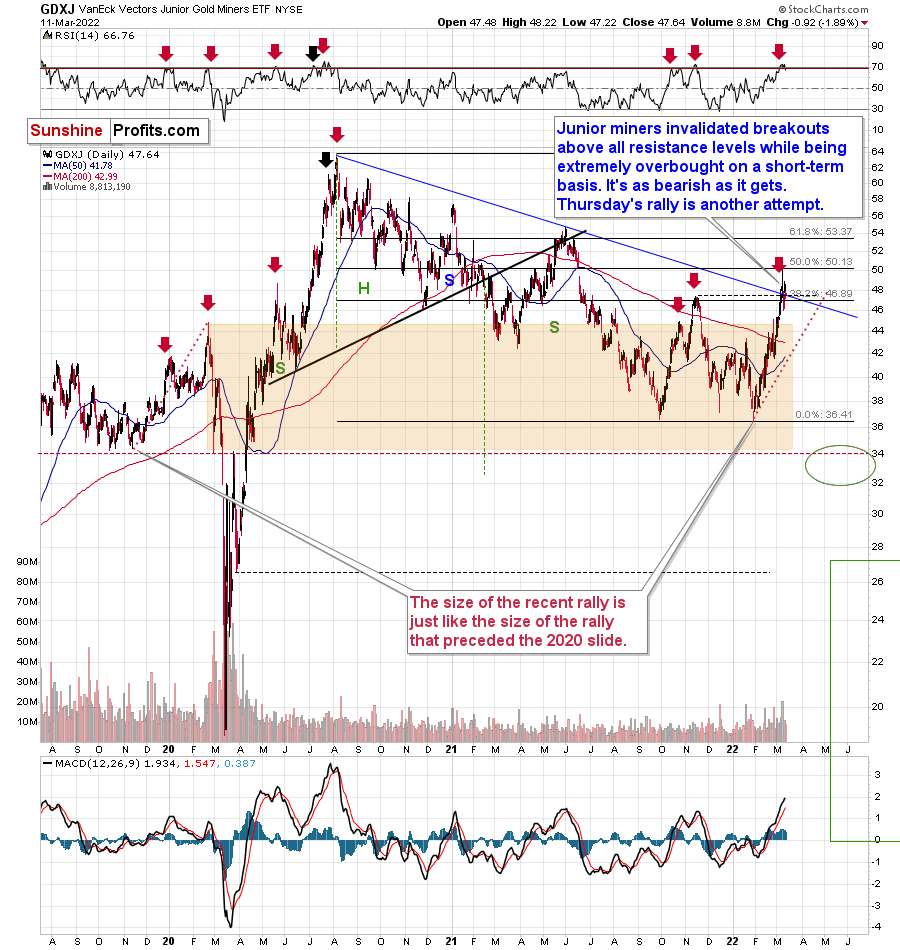
Junior miners recently invalidated their triple breakout so it was a triple invalidation, and thus a very strong sell sign. The resistance levels that were broken initially are:
- 38.2% Fibonacci retracement level;
- declining (blue) resistance line;
- late-2021 top.
Invalidations of breakouts are bearish as they show that a given market’s strength was not real and that sellers were able to overwhelm the buyers.
While mining stocks underperformed gold in a rather extreme manner on Tuesday, silver outperformed it on the same day. This was a bearish indication, and indeed, it was followed by lower prices.
During Thursday’s trading, we saw a 2.10% rally, so it was another attempt by junior miners to break higher. On Friday, I wrote that I doubted that junior miners would be able to rally further based on this second attempt, and I justified this opinion in the following way:
The long-term indications are much more powerful than the short-term ones, and given what I already wrote in today’s analysis, it’s simply unlikely that junior would be able to trigger an additional rally from here.
Some might say that what we saw yesterday is a sign of strength as junior moved higher more visibly than gold did, but please note that miners’ strength is particularly bullish at the beginning of a given upswing or at the end of a downswing. Miners are in neither of those. Instead, what we could see is fake strength that’s present just before the slide, in analogy to what we saw at the very beginning of 2016. Back then, we saw fake weakness when miners broke to new lows while gold didn’t.
Given what gold is doing and what’s happening in the general stock market, it seems that the next big move in junior mining stocks will be to the downside.
The above remains true today. Please note that juniors declined on Friday, and given today’s pre-market decline in gold, it seems that they are about to head lower in today’s trading as well. This would make them invalidate the previous breakouts once again, and when that takes place, the outlook will not only be extremely bearish, but also crystal-clear.
Friday’s session was particularly interesting when we compare what happened in gold to what happened in the USD Index.
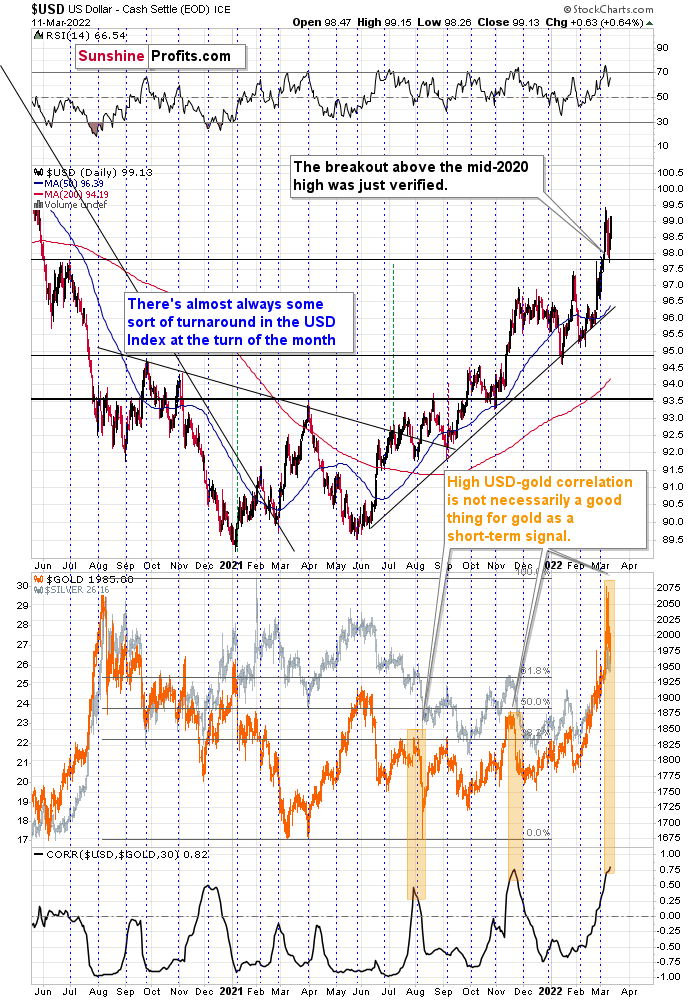
Gold invalidated its important breakout above $2,000, thus flashing a medium-term sell signal.
The USD Index, on the other hand, confirmed its breakout above its mid-2020 high by moving back to it and then rallying once again.
This major difference on the technical level tells us that the key driver behind rallies in both assets is starting to wane. The key driver was, of course, the fear and uncertainty regarding Russia’s invasion of Ukraine. I’ve been writing about both points for many days:
- Geopolitical events have only a temporary impact on gold prices .
- Based on the analogies to how gold performed after previous military interventions (Russia annexing Crimea, the U.S. invading Iraq, the U.S. invading Afghanistan), it was likely that the rally would be a short-term phenomenon that would be followed by a decline. In fact, based on the “oil factor,” the situation might be particularly similar to the U.S.’s invasion of Iraq. Back then, mining stocks gave away their war-tension-based gains rather quickly.
What we saw on Friday appears to be an indication that history is rhyming.
Also, please note that if one looks at the correlation between the USD Index and gold (lower part of the chart), high values tend to coincide with tops in gold, especially when the latter is after a short-term rally. The correlation just moved to the level that it reached when gold topped in late 2021, so we have yet another factor pointing to lower gold prices in the coming weeks.
Before moving to the fundamental part of the analysis, I would to like quote what I wrote after gold invalidated its breakout above $2,000 for the first time, as it applies today as well:
So much for gold’s move above $2,000. Congratulations on avoiding the mania – it was not easy. The volume readings show that many people were caught up in the “inevitable rally” in gold. You, however, kept focused on what’s most important in the medium term, and over this time frame, this approach is likely to prove most beneficial.
As gold tried to rally to new all-time highs, I sent out an intraday Gold & Silver Trading Alert, and in it, I emphasized the likely temporary nature of this move. I wrote the following:
Yes, the situation in Ukraine is critical.
However, the two key drivers of gold price continue to point to lower gold prices, and at the same time we know that geopolitical-event-based rallies don’t last and very likely to be reversed.
These two key drivers are:
- real interest rates;
- the USD Index.
The USD Index is already soaring, and real interest rates are likely to increase as the nominal interest rates are about to increase – and given the recent rally in prices they might increase more than most investors expect them to.
Consequently, while – given today’s rally – it might seem like there’s no stopping gold, silver, and mining stocks, please keep the above in mind. This rally is likely to be reversed, and when it reverses, junior gold miners are likely to decline in an epic manner, leading to epic profits for those who didn’t succumb the mania during the parabolic upswing.
Having said that, let’s take a look at the markets from a more fundamental point of view.
Good News Is Bad News
While the PMs remain uplifted due to the Russia-Ukraine conflict, their medium-term fundamentals are in much worse shape. For example, the new narrative is that the U.S. economy is in a precarious position. As such, the Fed will have to proceed with caution to avoid causing a recession.
However, while prophecies of a destitute U.S. consumer make the rounds, the reality is that Americans still have plenty of monetary ammunition. With strong data still pouring in amid high inflation and weak sentiment, a continuation of the trend should put upward pressure on the U.S. Federal Funds Rate in the coming months.
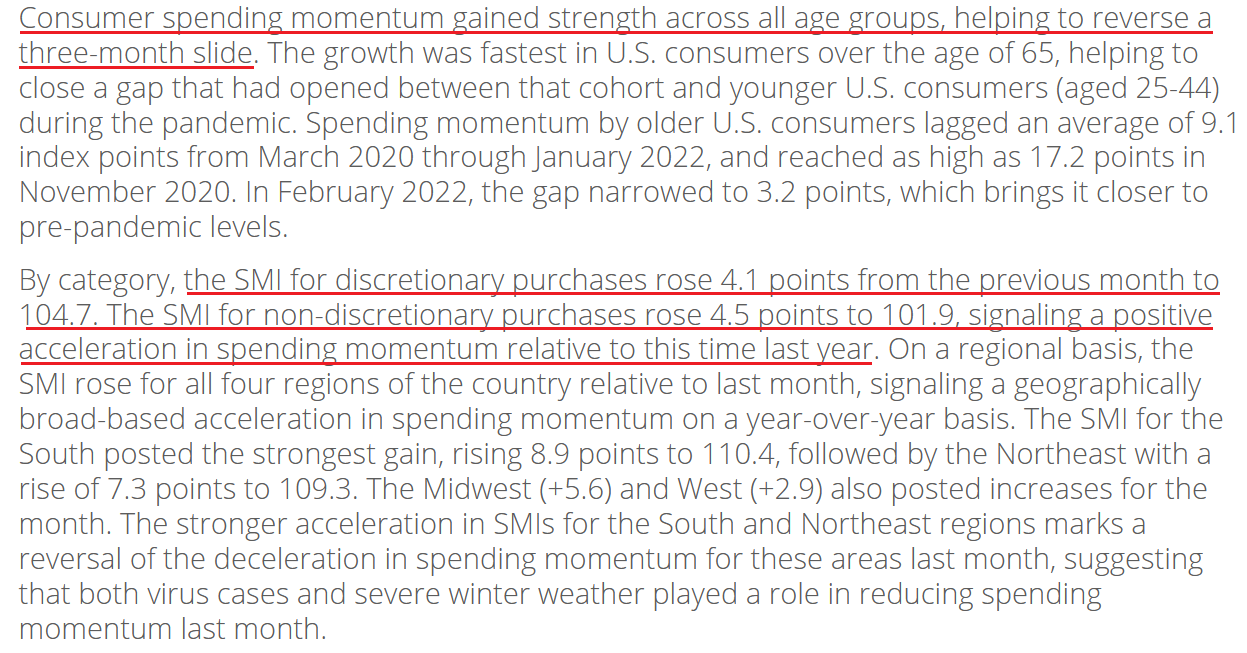
To explain, Visa released its U.S. Spending Momentum Index (SMI) on Mar. 10. With the index increasing from 102.4 in January to 109.3 in February (seasonally adjusted), Wayne Best, Visa’s Chief Economist, said: “We have been surprised by the resiliency of U.S. consumers through the ongoing uncertainty of the pandemic and persistent elevated inflation.”
For context, Visa’s SMI gauges the health of U.S. consumer spending. When the index rises above 100, spending momentum is strengthening, and when it falls below 100, spending momentum is weakening. As a result, with another robust reading recorded in February, it signals that Americans still have plenty of cash in their bank accounts.
Please see below:
 Source: Visa
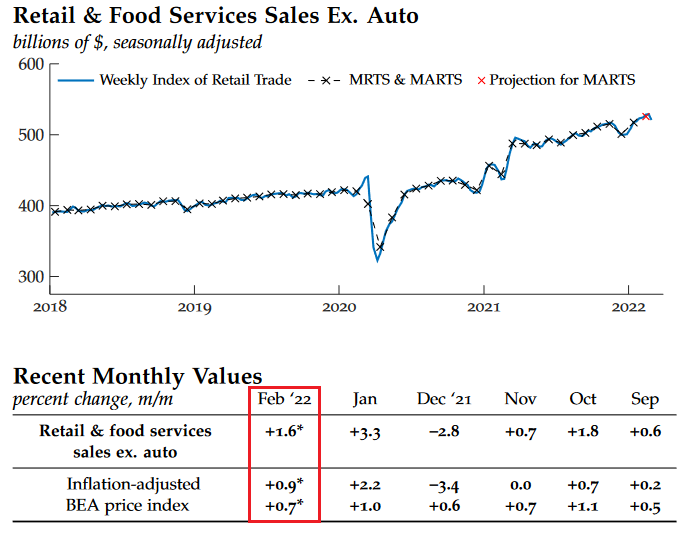
On top of that, U.S. retail sales increased by 3.8% month-over-month (MoM) and hit a new all-time high in January. For some time, the Chicago Fed has made prescient predictions about the future direction of the metric. Moreover, with the latest update on Mar. 11, the Chicago Fed noted: “In the fourth week of February, the Weekly Index of Retail Trade decreased 1.5% on a seasonally adjusted basis after increasing 0.1% in the previous week. For the month of February, retail & food services sales excluding motor vehicles & parts (ex. auto) are projected to increase 1.6% from January on a seasonally adjusted basis and to increase 0.9% when adjusted for inflation.”
Please see below:
 Source: Chicago Fed
As a result, with Visa and high-frequency data from the Chicago Fed signaling that consumers have not been deterred by high inflation, demand remains resilient; and as long as this is the case, the Fed has little reason to perform a dovish 180.
To that point, the latest data from the U.S. Census Bureau’s Small Business Pulse Survey (SBPS) shows that 7.5% of firms reported an uptick in paid employment and hours worked for the week ended Mar. 5. While this figure may seem small on the surface, it was the highest reading since October. Thus, with nonfarm payrolls outperforming expectations and U.S. job openings only slightly below their all-time high, it’s another data point that supports the Fed’s hawkish disposition.
Please see below:
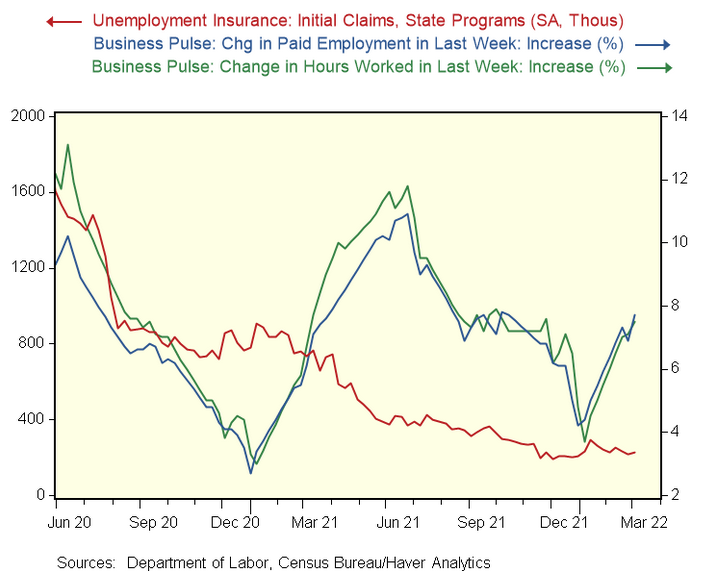
To explain, the blue and green lines above track the percentage of SBPS respondents who reported an increase in paid employment and hours worked, while the red line above tracks initial unemployment claims. If you analyze the right side of the chart, you can see that the former bottomed in late 2021/early 2022 and has been moving higher ever since. As a result, while the financial markets have suffered in 2022, the U.S. economy is stronger than the new narrative suggests.
For more context, I wrote on Mar. 9:
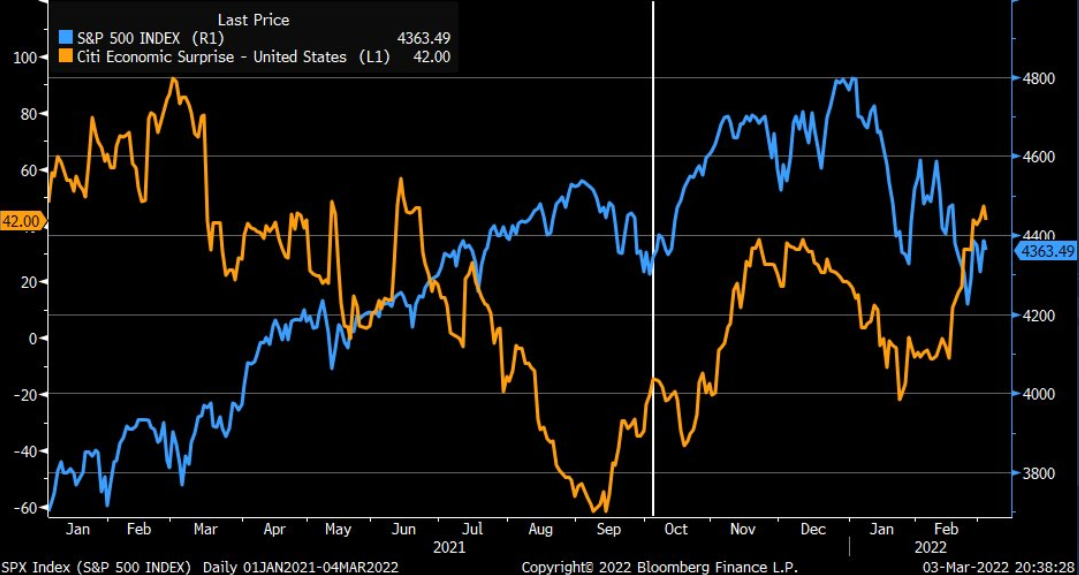
The blue line above tracks the S&P 500, while the orange line above tracks Citigroup’s Economic Surprise Index. For context, a surprise occurs when an economic data point outperforms economists’ consensus estimate.
If you analyze the right side of the chart, you can see that the orange line bottomed in January and has been moving higher ever since. As a result, the U.S. economy remains in a healthy position, and as long as this is the case, it keeps the pressure on the Fed to raise interest rates at its next several monetary policy meetings.
Furthermore, while the U.S. labor market and consumer spending are at or near all-time highs, pricing pressures remain extremely problematic. For example, with the U.S. Bureau of Labor Statistics (BLS) revealing on Mar. 10 that the headline Consumer Price Index (CPI) increased by 7.9% year-over-year (YoY) in February, the inflationary onslaught continues.
Please see below:
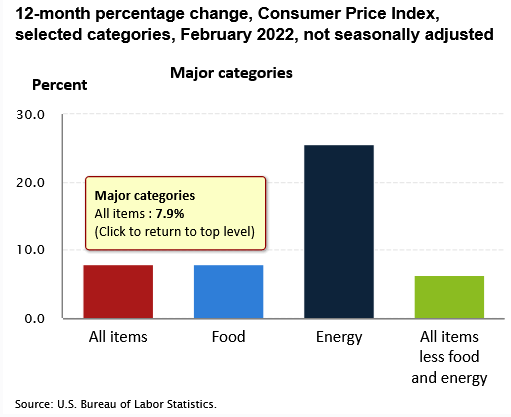
To that point, while the Biden Administration tries to blame the recent surge on the Russia-Ukraine crisis, the reality is that inflation has simply continued its 2021 surge. With the median CPI – which strips out outliers – likely to seek higher ground in the coming months, the Fed’s rate hike cycle should have plenty of room to run.
To explain, I wrote on Mar. 9:
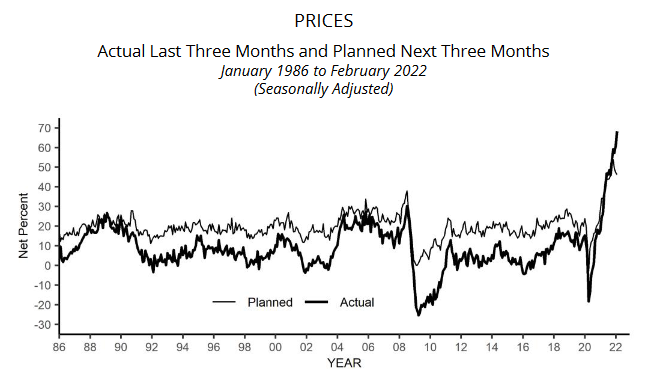
The NFIB released its Small Business Optimism Index on Mar. 8. And while the headline index decreased from 97.1 in January to 95. 7 in February, the report revealed:
“The net percent of owners raising average selling prices increased 7 points to a net 68 percent seasonally adjusted, the highest reading recorded in the series.”
Please see below:
 Source: NFIB
Moreover, with the median CPI often tracking the NFIB’s data with a lag, it should rally in the coming months.
Please see below:
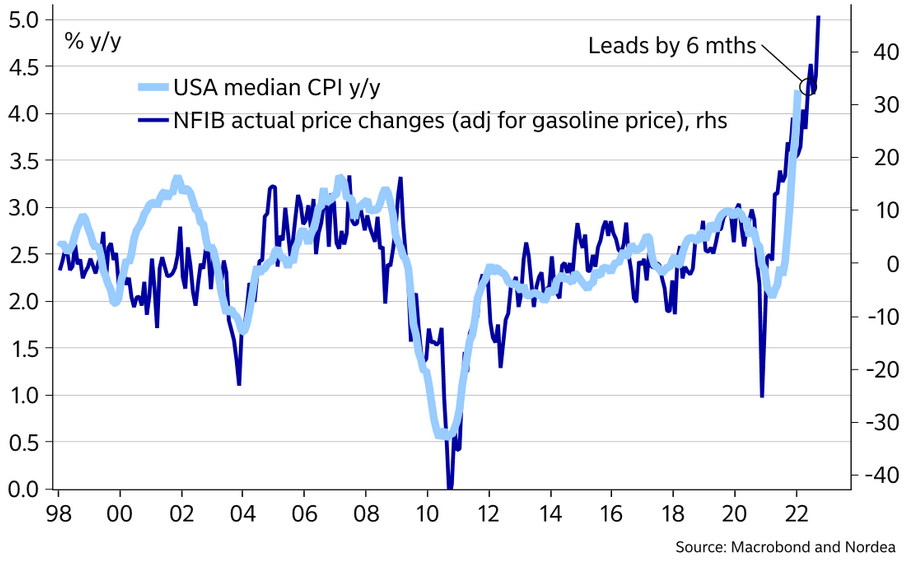
To explain, the dark blue line above tracks the net percent of NFIB respondents increasing their prices (adjusted for gasoline), while the dark blue line above tracks the YoY percentage change in the median CPI. If you analyze the relationship, you can see that the latter often tracks the former’s movement.
In addition, if you focus your attention on the right side of the chart, you can see that the median CPI still has room to move higher over the next six months. As a result, the cocktail of inflation, employment and consumer spending is bullish for hawkish Fed policy and bearish for the PMs.
If that wasn’t enough, China announced on Mar. 13 that 17.5 million residents in the city of Shenzhen will be in lockdown until Mar. 20. For context, this occurred after coronavirus cases increased to a level that challenged the country’s Covid-Zero strategy.
More importantly, though, please remember that the U.S. imports more goods from China than any other nation. Thus, manufacturing standstills and port delays will only put upward pressure on U.S. inflation.
Please see below:
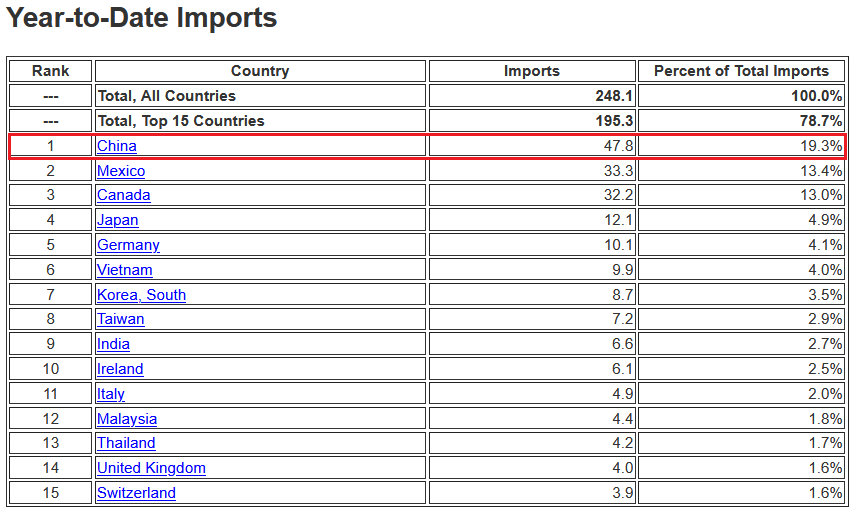 Source: U.S. Census Bureau
To that point, Mohamed El-Erian, Chief Economic Adviser to Allianz, has been sounding the alarm on inflation for months. Speaking with CBS news on Mar. 13, he said: “inflation is high and will go higher because of what's happening in Ukraine. And basically, [Powell has] got to make a choice, hit the brakes, regain credibility, but risk a recession or tap the brakes, and we have an inflation problem going into next year. We are here because the Fed is very late and has no good policy options available anymore.”
He added:
“Til' the end of November, [White House officials] were calling it transitory, but also to be fair to the administration, there will be a Putin inflation component. I estimate that at 7.9%, we will probably get very close or above 10% before we come down. And that difference will be all because of the disruption that Putin's war imply for commodity prices, supply chains and shipments.”
The bottom line? While the PMs remain elevated due to geopolitical risk premiums, their medium-term fundamental outlooks continue to head in the opposite direction. With the Fed poised to raise interest rates this week, and more hikes likely to materialize in the coming months, the liquidity drain should weigh on the PMs’ performance. Moreover, with inflationary pressures exacerbated by the Russia-Ukraine conflict, and now, the lockdown in China, the Fed will have to push up real yields to help calm inflation’s reign.
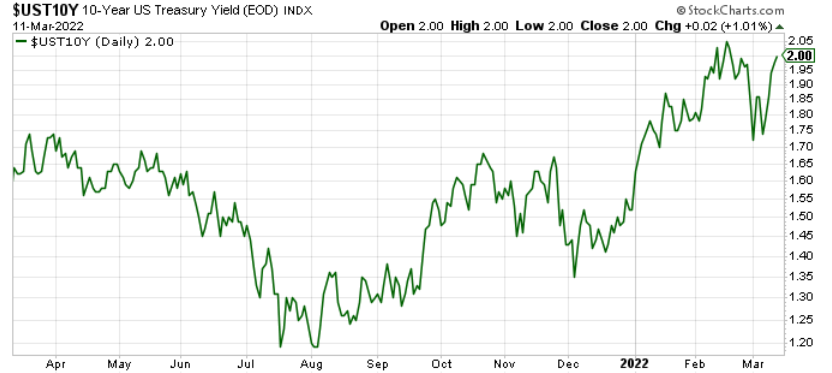
More importantly, though, the policy mix is extremely bullish for the USD Index and the U.S. 10-Year Treasury yield. With the latter rallying back to 2% on Mar. 11, its geopolitical risk premium has already been erased. As a result, the PMs should suffer similar fates over the medium term.
In conclusion, the PMs declined on Mar. 11, as overbought conditions catch up to gold, silver and mining stocks. While the short term still remains uncertain, the medium-term implications remain intact. As a result, another profound slide should confront the PMs before long-term buying opportunities emerge.
Overview of the Upcoming Part of the Decline
- It seems to me that the corrective upswing is now over or very close to being over , and that gold, silver, and mining stocks are now likely to continue their medium-term decline.
- It seems that the first (bigger) stop for gold will be close to its previous 2021 lows, slightly below $1,700. Then it will likely correct a bit, but it’s unclear if I want to exit or reverse the current short position based on that – it depends on the number and the nature of the bullish indications that we get at that time.
- After the above-mentioned correction, we’re likely to see a powerful slide, perhaps close to the 2020 low ($1,450 - $1,500).
- If we see a situation where miners slide in a meaningful and volatile way while silver doesn’t (it just declines moderately), I plan to – once again – switch from short positions in miners to short positions in silver. At this time, it’s too early to say at what price levels this could take place, and if we get this kind of opportunity at all – perhaps with gold close to $1,600.
- I plan to exit all remaining short positions once gold shows substantial strength relative to the USD Index while the latter is still rallying. This may be the case with gold close to $1,350 - $1,400. I expect silver to fall the hardest in the final part of the move. This moment (when gold performs very strongly against the rallying USD and miners are strong relative to gold after its substantial decline) is likely to be the best entry point for long-term investments, in my view. This can also happen with gold close to $1,375, but at the moment it’s too early to say with certainty.
- As a confirmation for the above, I will use the (upcoming or perhaps we have already seen it?) top in the general stock market as the starting point for the three-month countdown. The reason is that after the 1929 top, gold miners declined for about three months after the general stock market started to slide. We also saw some confirmations of this theory based on the analogy to 2008. All in all, the precious metals sector is likely to bottom about three months after the general stock market tops.
- The above is based on the information available today, and it might change in the following days/weeks.
You will find my general overview of the outlook for gold on the chart below:
Please note that the above timing details are relatively broad and “for general overview only” – so that you know more or less what I think and how volatile I think the moves are likely to be – on an approximate basis. These time targets are not binding or clear enough for me to think that they should be used for purchasing options, warrants or similar instruments.
Letters to the Editor
Q: I would appreciate advice/ opinion on investing in the following products or those that you suggest: invest in ZSL /silver/ GDXD, reverse GDXJ... What would be the best diversification?
A: I don’t know what would be the best option for you. Selecting something individually for you, would require me to get to know you thoroughly (investment objectives, willingness to take risk, ability to take risk, liquidity requirements, etc.) and it would be investment advice, and I don’t provide such.
I can only tell you what I think is going to happen in the markets, which assets I think will be outperforming and when, and what I think is a good idea for someone who is not a market professional (which I guess you aren’t, as in this case you wouldn’t ask this question).
What I can say is already visible below the summary of the analysis in the “Trading”, “Investing”, and “Insurance” sections.
In short, my first choice (if I was not a market professional), would be to short the GDXJ. There is no leverage, so based on the back-and-forth trading, the short position doesn’t lose value (and the margin interest is relatively small). My second choice would be to use JDST while paying attention not to use too much capital for the trade – it has 2x leverage for daily price moves, so its value will deteriorate over time due to back and forth trading.
My third choice would be ZSL, as silver is likely to decline, too.
I wouldn’t use GDXD at all, because the 3x leverage seems excessive and the price deterioration due to the back-and-forth trading is significant.
Having said that, I’m currently using JDST myself, and I’m not using ZSL. I plan to switch from JDST to ZSL if junior miners decline significantly first but silver only declines somewhat. In other words, if we see the 2020-slide all over again, I plan to capitalize on that specific intra-sector price differentiation.
If one is not that interested in switching between positions, then half in junior miners and half in silver (both short trading positions) seems OK.
Q: I follow your in-depth analyses, and I have two questions for you. In your research, you analogize the US-Iraq and the Crimea invasion in 2014. One would argue that those two events are very different from today's situation due to Russia's current unprecedented sanctions that could potentially create:
A) run-away inflation in the West due to banning Russian commodities;
B) severely impact the dominance of the US Dollar as a global reserve currency due to Russia's exclusion from the SWIFT system.
Could those developments change your mind about the direction of gold, and could those developments support a new gold bull run? It seems that buying physical gold could be more relevant and justifiable.
A: The big inflation is already here, and what’s happening in Ukraine is only exacerbating the situation. The war-based premium likely discounted that, while what wasn’t discounted is that the Fed is about to hike interest rates, and it might hike them more than the markets anticipate. In this case, the real interest rates would move higher from their current levels, and that would be bearish for gold.
The data shows that gold is a hedge against hyperinflation, but not necessarily against more moderate inflation.
Why do I think that the Fed will want to tighten the inflation screw in a significant manner? Because it got political – simple as that. Biden’s approval numbers were hit hard as inflation hit the wallets of U.S. voters. He tries to blame it all on Putin, but people remember that the problem existed well before Russia’s invasion. Besides, even if people blame this on Putin, they will likely still request that inflation be handled. Thus, the Fed will be pressured to act. The markets are already pricing in a 0.25% hike this week, so if the Fed wants to really change anything and show that they are “actively doing something,” they might even hike by 0.5%.
Declining gold prices would also imply that inflation is getting under control, don’t you think? So, the former might be “politically useful”, and I wouldn’t be surprised to see wide price swings to the downside “proving” how well Biden is handling everything.
As far as Russia’s exclusion from the SWIFT system is concerned, I see this as a potential threat to the overall stability of the system. While gold would be likely to soar in the long run if the system is viewed as unstable, in the short term, we could see a flight to cash.
Remember 2008? We had an international banking crisis (this doesn’t fully express what it was, but serves as a good summary), so the contagion effect was in full force, and what did gold do? It first declined significantly, along with the general stock market, and then came back up with a vengeance. While gold was declining, silver and mining stocks were also declining, particularly significantly. That’s in perfect tune with what I’m expecting to see in the future of the precious metals market.
Summary
Summing up, despite the recent rally in gold, the outlook for junior mining stocks remains exactly as I described previously.
Crude oil’s extreme outperformance, the stock market’s weakness, and critical medium-term resistance levels reached by gold (all-time high!) and junior mining stocks, all indicate that the tops are at hand or have just formed. The huge-volume reversals in gold and (especially) mining stocks, along with silver’s short-term outperformance, all point to lower precious metals prices in the following days/weeks. It seems that the top is in.
Investing and trading are difficult. If it was easy, most people would be making money – and they’re not. Right now, it’s most difficult to ignore the urge to “run for cover” if you physically don’t have to. The markets move on “buy the rumor and sell the fact.” This repeats over and over again in many (all?) markets, and we have direct analogies to similar situations in gold itself. Junior miners are likely to decline the most, also based on the massive declines that are likely to take place (in fact, they have already started) in the stock markets.
From the medium-term point of view, the two key long-term factors remain the analogy to 2013 in gold and the broad head and shoulders pattern in the HUI Index. They both suggest much lower prices ahead.
It seems that our profits from short positions are going to become truly epic in the coming months.
After the sell-off (that takes gold to about $1,350-$1,500), I expect the precious metals to rally significantly. The final part of the decline might take as little as 1-5 weeks, so it's important to stay alert to any changes.
Most importantly, please stay healthy and safe. We made a lot of money last March and this March, and it seems that we’re about to make much more in the upcoming decline, but you have to be healthy to enjoy the results.
As always, we'll keep you - our subscribers - informed.
To summarize:
Trading capital (supplementary part of the portfolio; our opinion): Full speculative short positions (300% of the full position) in junior mining stocks are justified from the risk to reward point of view with the following binding exit profit-take price levels:
Mining stocks (price levels for the GDXJ ETF): binding profit-take exit price: $34.63; stop-loss: none (the volatility is too big to justify a stop-loss order in case of this particular trade)
Alternatively, if one seeks leverage, we’re providing the binding profit-take levels for the JDST (2x leveraged) and GDXD (3x leveraged – which is not suggested for most traders/investors due to the significant leverage). The binding profit-take level for the JDST: $14.98; stop-loss for the JDST: none (the volatility is too big to justify a SL order in case of this particular trade); binding profit-take level for the GDXD: $25.48; stop-loss for the GDXD: none (the volatility is too big to justify a SL order in case of this particular trade).
For-your-information targets (our opinion; we continue to think that mining stocks are the preferred way of taking advantage of the upcoming price move, but if for whatever reason one wants / has to use silver or gold for this trade, we are providing the details anyway.):
Silver futures downside profit-take exit price: $19.12
SLV profit-take exit price: $17.72
ZSL profit-take exit price: $38.28
Gold futures downside profit-take exit price: $1,683
HGD.TO – alternative (Canadian) inverse 2x leveraged gold stocks ETF – the upside profit-take exit price: $11.79
HZD.TO – alternative (Canadian) inverse 2x leveraged silver ETF – the upside profit-take exit price: $29.48
Long-term capital (core part of the portfolio; our opinion): No positions (in other words: cash
Insurance capital (core part of the portfolio; our opinion): Full position
Whether you already subscribed or not, we encourage you to find out how to make the most of our alerts and read our replies to the most common alert-and-gold-trading-related-questions.
Please note that we describe the situation for the day that the alert is posted in the trading section. In other words, if we are writing about a speculative position, it means that it is up-to-date on the day it was posted. We are also featuring the initial target prices to decide whether keeping a position on a given day is in tune with your approach (some moves are too small for medium-term traders, and some might appear too big for day-traders).
Additionally, you might want to read why our stop-loss orders are usually relatively far from the current price.
Please note that a full position doesn't mean using all of the capital for a given trade. You will find details on our thoughts on gold portfolio structuring in the Key Insights section on our website.
As a reminder - "initial target price" means exactly that - an "initial" one. It's not a price level at which we suggest closing positions. If this becomes the case (like it did in the previous trade), we will refer to these levels as levels of exit orders (exactly as we've done previously). Stop-loss levels, however, are naturally not "initial", but something that, in our opinion, might be entered as an order.
Since it is impossible to synchronize target prices and stop-loss levels for all the ETFs and ETNs with the main markets that we provide these levels for (gold, silver and mining stocks - the GDX ETF), the stop-loss levels and target prices for other ETNs and ETF (among other: UGL, GLL, AGQ, ZSL, NUGT, DUST, JNUG, JDST) are provided as supplementary, and not as "final". This means that if a stop-loss or a target level is reached for any of the "additional instruments" (GLL for instance), but not for the "main instrument" (gold in this case), we will view positions in both gold and GLL as still open and the stop-loss for GLL would have to be moved lower. On the other hand, if gold moves to a stop-loss level but GLL doesn't, then we will view both positions (in gold and GLL) as closed. In other words, since it's not possible to be 100% certain that each related instrument moves to a given level when the underlying instrument does, we can't provide levels that would be binding. The levels that we do provide are our best estimate of the levels that will correspond to the levels in the underlying assets, but it will be the underlying assets that one will need to focus on regarding the signs pointing to closing a given position or keeping it open. We might adjust the levels in the "additional instruments" without adjusting the levels in the "main instruments", which will simply mean that we have improved our estimation of these levels, not that we changed our outlook on the markets. We are already working on a tool that would update these levels daily for the most popular ETFs, ETNs and individual mining stocks.
Our preferred ways to invest in and to trade gold along with the reasoning can be found in the how to buy gold section. Furthermore, our preferred ETFs and ETNs can be found in our Gold & Silver ETF Ranking.
As a reminder, Gold & Silver Trading Alerts are posted before or on each trading day (we usually post them before the opening bell, but we don't promise doing that each day). If there's anything urgent, we will send you an additional small alert before posting the main one.
Thank you.
Przemyslaw Radomski, CFA
Founder, Editor-in-chief

