

Briefly: in our opinion, full (250% of the regular position size) speculative short positions in mining stocks are justified from the risk/reward point of view at the moment of publishing this Alert.
Practically everything that we wrote on Monday, and yesterday. remains up-to-date today. The current situation continues to be similar to what happened in the first half of March. Let's take a look at the details.
USDX in Focus
Starting with a quote from our previous analysis to provide context:
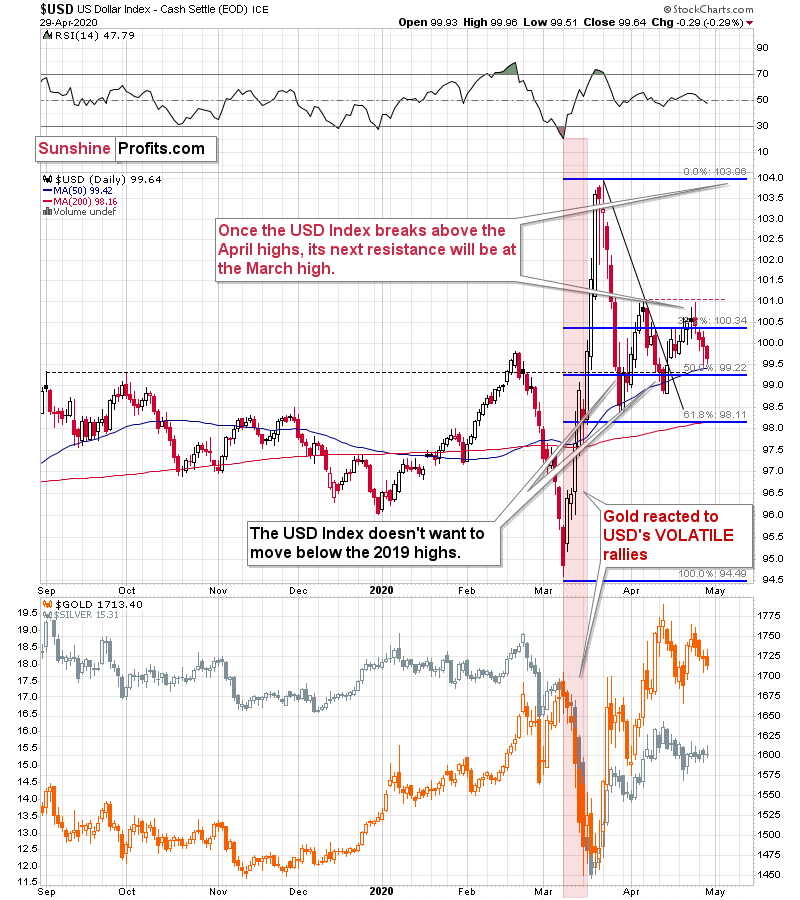
In short, the USD Index is after a huge rally and a correction. In late March, the USD Index corrected the previous rally in terms of price moves, but not in terms of time. The latter is what it seems to have been doing for the past month. The USD Index did move higher in April, but the moves were relatively boring - somewhat similar to how it rallied in January and February. And what did gold do at that time? It moved higher, and then declined at some point once it got too high too fast - practically regardless of what the USD Index was doing. That was in the final part of February.
Please check what silver did in January and February. It moved mostly higher, only to decline in the final part of the month. Overall the initial action was positive but rather nothing to call home about. Gold's rebound in early March was accompanied by rather weak action in silver.
What's happening now? Gold declined in mid-April, similar to how it declined in late February. The USD Index initially triggered the move, but then gold declined for a few days regardless of what the USDX was doing. And the rebound that we saw last week? Silver's upswing was nothing to call home about - just like what we saw in early March.
Back in March, gold's rally ended after the first clear intraday decline. Interestingly, the very first day of gold's March slide - March 9th - took place when the USD Index also declined. That daily decline, however, was actually the start of a powerful rally.
That USD Index rally was not only powerful, but it was also volatile. It was volatile not only in general, but also in terms of each individual trading day.
Guess what - Friday was the day when gold clearly declined on an intraday basis, and that was also when the USD Index declined a bit. Silver hasn't done much.
What is even more interesting is that today, gold is also declining (about $10 at the moment of writing these words) along with the decline in the USD Index (about 0.26 decline at the moment of writing these words).
Just like it wasn't clear that gold was topping in the first half of March, it's far from being clear now - at least for most market participants.
Neither we would bet the farm on the scenario in which gold topped on Thursday, but it does seem quite likely.
Once again, gold futures ended the day lower and so did the USD Index, confirming the indications from the previous day.
In a way, the indications are now more bearish than they were in March, because back then gold futures declined with the USD Index for just one day, and right now we've seen this kind of performance for 4 days now.
In other words, this week's price action is similar to what happened around March 9th - at least in case of the gold-USD link. There are other individual confirmations as well, but before we move to them, let's once again go through the recent performance of mining stocks. As the miners haven't really moved yesterday, our previous comments also remain unchanged.
It's true that miners declined and were the first to drop profoundly in the first half of March. However, it's also true that back then, it was the decline in the stock market that helped them plunge first. On March 9th, the general stock market was already in the full decline mode. That's not what's going on right now.
The Lessons from Stocks
Quoting our previous analysis:
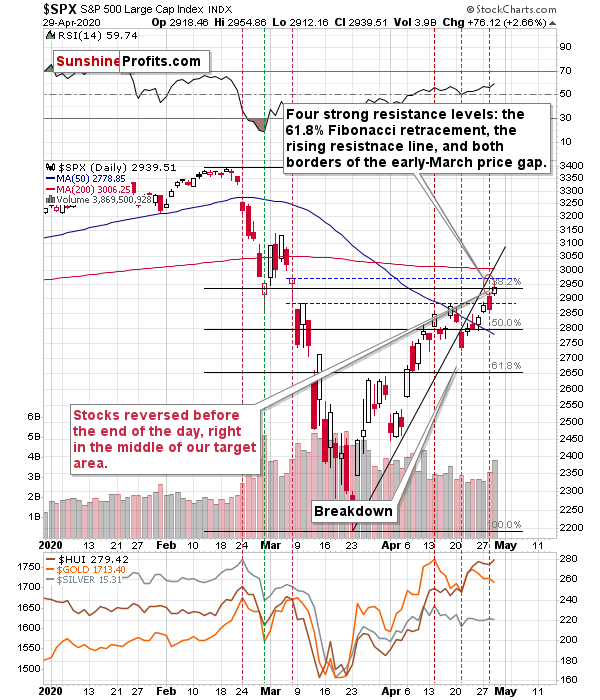
In general, the above chart shows that the S&P 500 lost its momentum and broke below the rising trend channel. It moved higher since that time, but the breakdown was not invalidated. This has bearish implications going forward. In reality, it's just a confirmation of what we wrote with regard to how the situation is developing from the fundamental point of view and how it's likely to develop in the future.
Stocks are too high given what's likely ahead as investors don't seem to realize the long-term implications of what's happening right now, still counting on the V-shaped economic recovery. The market is forward looking and once more people start to realize what's going on, the stock market is likely to fall.
You know that UBER's stock price just moved to new April high on Friday? It makes little sense given that the restrictions are likely to be in place longer, not shorter than initially expected. Instead of looking at data, investors seem to be focusing on the fact that the re-opening talks are taking place - which "seems to suggest" that re-opening the economy is somewhat close or that it would be the first step toward getting quickly to how things were before. It's not quick, and it might even require a step back first, if the second wave of the virus hits first - which seems quite likely given how the protests are taking place.
It's very likely that stocks will decline over the next several weeks, but the question is when will investors start to - massively - realize that the worst is yet to come?
The vertical dashed lines provide interesting details from the precious metals investors' and traders' point of view. Namely, they show that in late February and early March, the PMs and miners were lagging the stock market. The declines in stocks started earlier. In fact, when the first serious daily decline in the stock market took place (February 24th), the PMs and miners topped. We marked this day with the red vertical line.
Then the stock market declined, and when it bottomed, gold, silver and miners also formed a daily bottom. That was on February 28th and we marked it with a green line. What happened next is that we saw a corrective rebound, which lasted longer in case of the precious metals market than it did in case of the general stock market. Once again stocks topped first, and the precious metals market topped approximately on the day when the stock market declined quite visibly (red line - March 6th).
We're seeing something similar also this month. The initial top in stocks formed on April 14th (red line) and that was also the top in the precious metals market. Then stocks bottomed on April 21st, which was also the day when the precious metals market bottomed (more or less).
The late-February - early March performance seems to be repeating.
The difference is in the performance of the mining stocks, which used to lag, and now they leap gold and the general stock market. What gives? Well, during the analogous period in March (around March 6th), stocks moved higher, but they didn't even manage to correct half of the decline from the February high. Right now, the stock market (taking the overnight futures into account) is slightly above the April 14th high. Mining stocks, being more correlated with the general stock market are moving higher relative to gold as they take their strength from the general stock market. Moreover, if the general stock market is about to top shortly, it's quite likely to expect the previously worst performing stocks, to shine now (that's what tends to happen at the market tops).
All the above suggests that the general stock market is likely to top any day now, and when the first sizable daily slide takes place, we'll have a good indication that the next huge decline in the precious metals market is about to start or that it has just started.
When could that take place? Quite possibly as early as this week. Please note that the spacing between the horizontal lines that we saw in late February and early March was approximately symmetrical. Plus, they were about a week apart.
This means that the next local top in the precious metals sector - including the mining stocks - might be at hand, quite possibly today or tomorrow.
The first sizable decline in the stock market will serve as an indication and the sizable daily decline in gold, silver, and mining stocks that follows - likely on the next day - will serve as a confirmation.
The strong resistance levels are: the 61.8% Fibonacci retracement, the rising resistance line, and the upper border of the early-March price gap. There's also the 200-day moving average.
During yesterday's session the S&P 500 closed very insignificantly above the 61.8% Fibonacci retracement level and below the upper border of the price gap. In other words, it moved and reversed practically right in the middle of our target area. We wrote that the outlook was bearish, but that "on a very short-term basis, anything could happen in the stock market" and it did - we saw another daily move higher.
The final of the individual strong resistance levels is based on the upper border of the price gap. This gap is at 2972 in case of the S&P 500 index, and at 2964 in case of the S&P 500 index futures. Whether this level is "taken out" or not will depend on the closing price that we see. So far, the S&P futures moved to 2964 today and then they declined - trading at 2948 at the moment of writing these words.
If stocks decline from here, they will confirm the strength of the above-mentioned resistance and at the same time, they would likely invalidate the tiny breakout above the 61.8% Fibonacci retracement, which could trigger technical selling. This would likely have a very negative impact on the mining stock sector.
Let's take a look at what happened in the precious metals' ETFs yesterday.
In yesterday's analysis, we commented on the above chart in the following way:
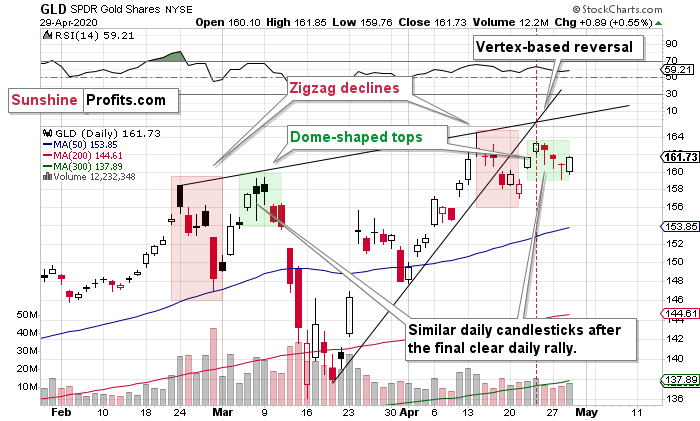
This makes that situation even more similar to what happened in early March. Back then, the GLD ETF also made a new high in terms of the closing prices... And it was the final time to exit any remaining long positions and enter short ones.
Please note that the double-top itself is not the only similar thing. The shape of the decline from the first top (zigzag marked with red) and the shape of the second top (dome) also confirm the similarity.
This, plus the fact that based on the last few days, it seems that gold topped right at its vertex-based reversal, makes the outlook very bearish.
Now, while gold futures declined yesterday, the GLD ETF closed a bit higher. Does this invalidate the above-mentioned analogy? Not really. On March 11th, GLD moved slightly above the previous day's close and then declined during the day. Why would it matter? Because it shows the back and forth movement before the biggest part of the decline. This time, gold is trading a bit differently in terms of the closing prices, but the overall pause within the short-term decline is present - just like it was present in March. What we saw, could be just the calm before the storm.
Silver in the Spotlight
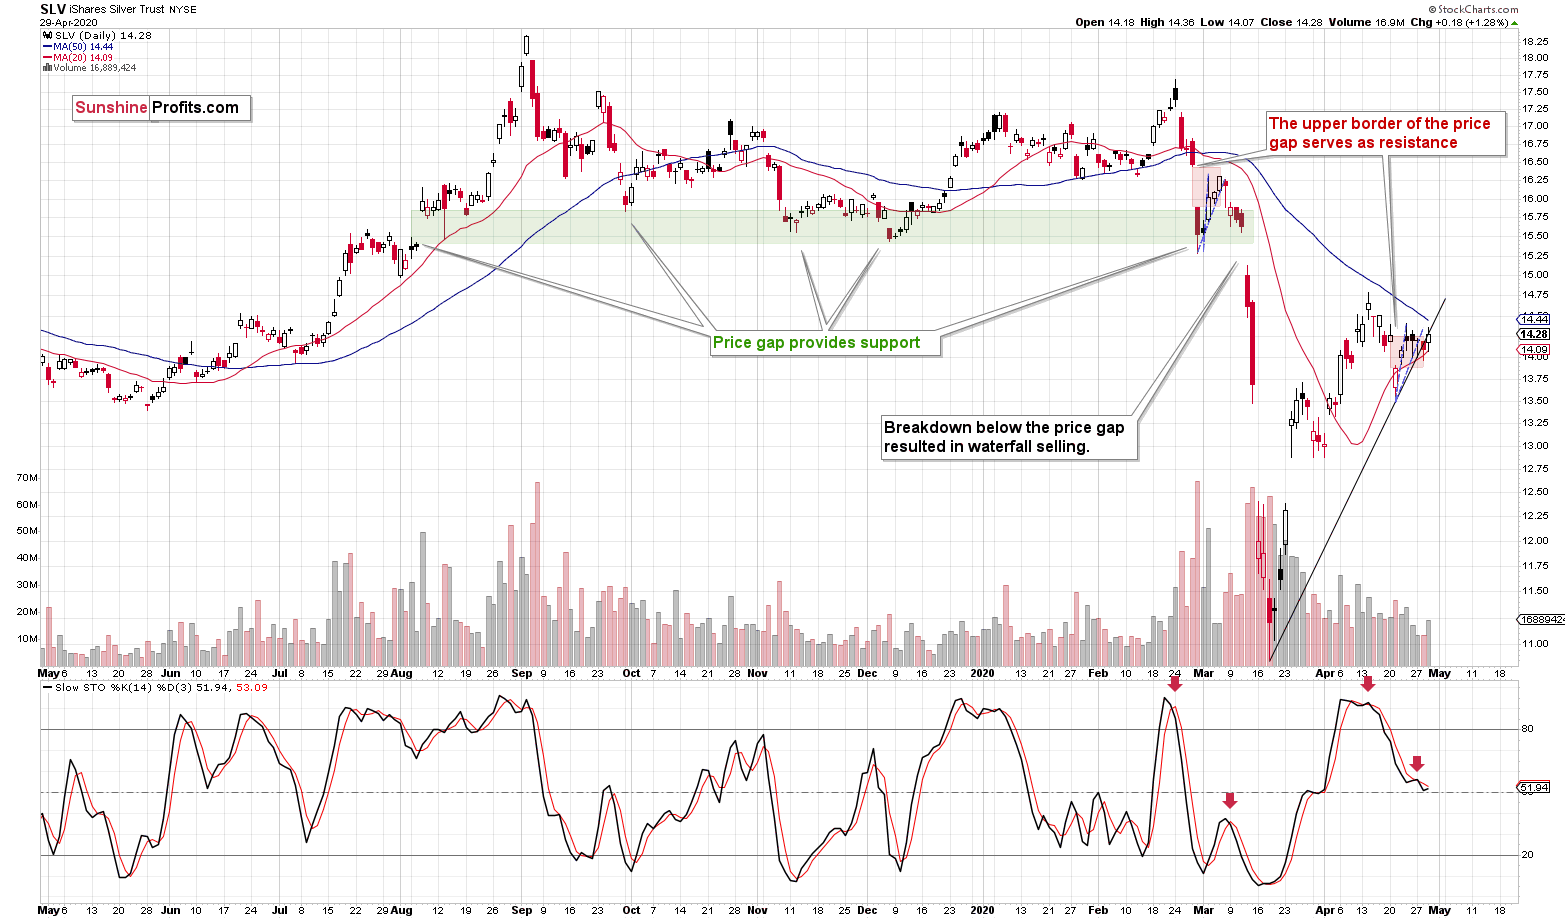
As far as the SLV ETF is concerned, we also continue to see similarity between both periods: early March and late April.
The SLV ETF closed yesterday's session 2 cents above the upper border of its previous price gap, which might be bullish, if the breakout is confirmed. It doesn't seem likely because silver just rallied and reversed in the overnight trading, and it happened at the vertex of the triangle based on the important support and resistance lines.
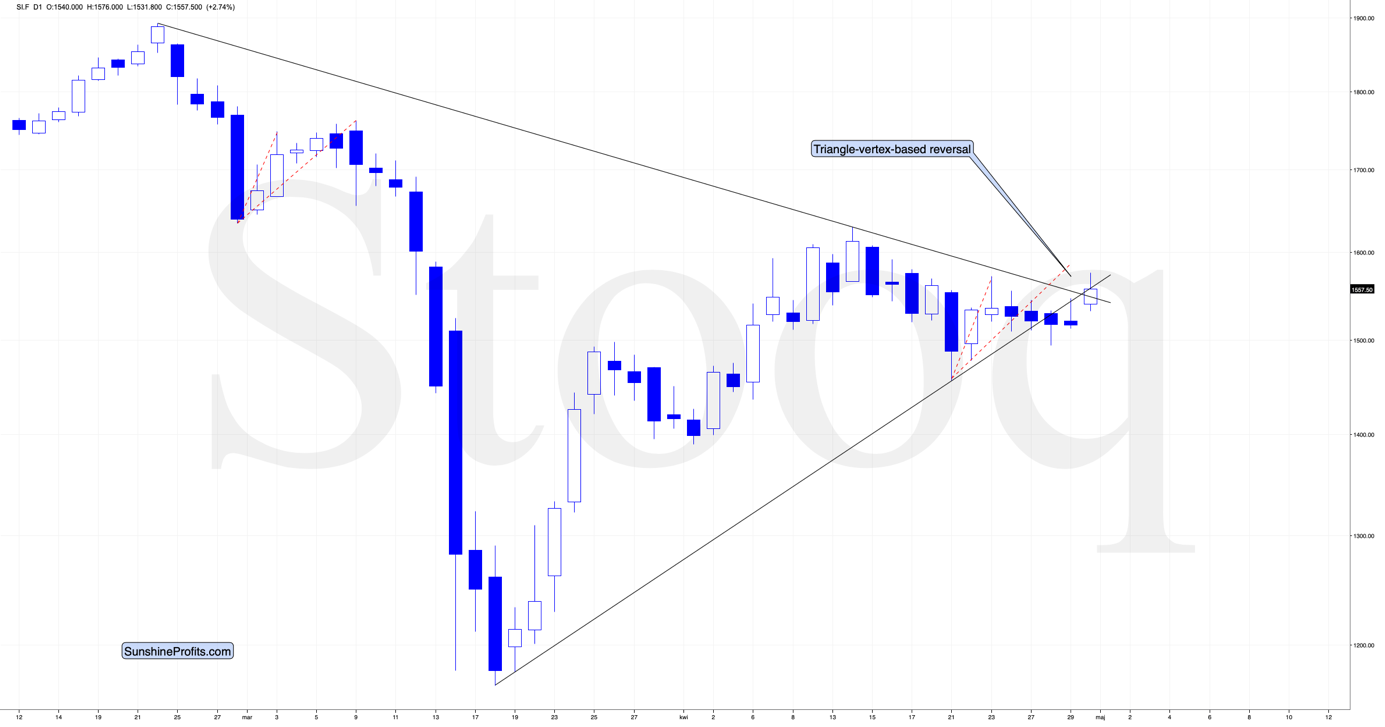
This suggests that the small breakout above the price gap in SLV, and above the declining resistance line in silver, is likely to be invalidated shortly.
Such an invalidation would likely lead to sizable declines, even without taking into account the similarity to what happened in early March.
Speaking of the similarity to early March - the red dashed lines show when and how far silver rallied before plunging at that time. The initial rallies are practically identical, while the final upswing is very similar in terms of price, and as far as time is concerned, it still similar as it seems to be taking silver only an extra day to complete the same pattern.
And what about the miners? Once again, the situation is just as we've described it yesterday.
Mining Stocks
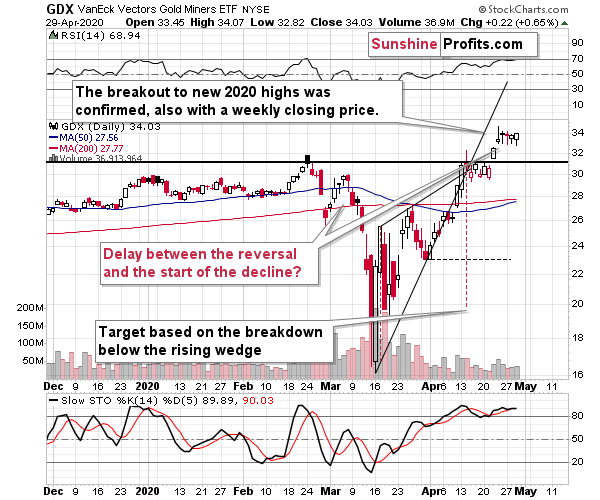
The GDX ETF finally showed relative weakness yesterday. Yes, it closed a bit higher, but it didn't rally to new monthly highs despite being led there by the general stock market. Instead, miners closed more or less where they had closed on Monday - just like the GLD ETF.
The GDX ETF stopped moving decisively higher after the profound April 23rd reversal. That's similar to what miners did after the March 3rd reversal. Of course, back then they moved higher on a day-to-day basis and right now, they are just moving sideways. Please keep in mind that back then, miners were following stocks bullish lead initially and then they followed their bearish lead. Right now, we saw that miners refused to follow stocks' bullish lead. This means that once they get the bearish lead, they are likely to decline significantly (provided that gold declines as well, but that seems likely).
Finally, before summarizing, we would like to reply to questions that we received recently.
From the Readers' Mailbag
Q:
I wonder if you think Stagflation is coming from here until when ?
What does it mean for PM and Stocks?
Is it more likely that we have a Deflation coming instead ,where both PM and stocks decline into 2022?
A: (reply by Arkadiusz Sieron, PhD) Good question. Actually, we have already stagflation - as we are in deep recession, while inflation is low but positive. And we expect that stagflation could stay with us for a while. I mean here the fact that this crisis is likely to be more inflationary than the Great Recession because of two factors: 1) the negative supply shock and 2) the faster increase in the bank credit and money supply. Hence, after the initial shock that lowers the inflation rate, when the economy reopens, we could see higher inflation than during the Great Recession (this is also what the market expects given the inflation expectations derived from TIPS). Hyperinflation or even double-digit inflation is not likely anytime soon, but we do not expect deflation either. In the long run, inflation might be also more preferred than unemployment and serve as a great tool to lower the real interest rates and to get out from the high public debt. Such an environment should be positive for gold, which is considered to be an inflation hedge. Stocks also tend to rise more with inflation than bonds, but their performance depends also on the strength of the recovery (which could be weaker than many people believe). I wrote more about the inflation versus deflation debate in the Fundamental Gold Report from April 16, 2020.
Q: (...) the link (...) is about 15 minutes and I wanted to get your opinion on it....
does it make sense???
[the video is about Jim Rickard's prediction for $50k gold based on gold being used as money]
A: (reply by Arkadiusz Sieron, PhD) More info will be in the May edition of the Gold Market Overview. In the first part of the report, I analyze how high gold prices can go amid the coronavirus crisis, referring also to Rickard's claims which link gold prices to the money supply. I show that there is no a simple mechanical relationship between these two variables, so the gold prices do not have to gold to $50,000 anytime soon. In other words, Rickards' claims are based on the assumption that gold will be monetized (the gold standard will be reintroduced), which is, unfortunately, unlikely to happen in the foreseeable future.
Summary
Summing up, the outlook for the precious metals market remains bearish for the next few weeks, even though the next few days are relatively unclear. The general stock market appears to be ready to top this week and given that gold is declining along with the USD Index so far this week (today's performance seems to be an exception from the rule rather than a change thereof), it seems that the next big move lower in the entire precious metals sector is just around the corner.
The recent strength in the mining stocks doesn't seem to fit the bearish narrative, especially since the miners just confirmed their breakout above the previous 2020 high. Still, the flagship proxy for the gold stocks - the HUI Index - is almost right at its 2016 high, which provides a strong resistance, and the relative strength of the general stock market (which likely contributed to rising prices of miners) is likely close to being over.
Thus, it seems likely that we'll see the initial part of the next big mover lower later this week. This is particularly the case as we see a very short-term outperformance of silver after a monthly upswing - the former is often seen right at the tops and before significant declines. And this time, we see it right at silver's triangle-vertex-based reversal day.
After the sell-off (that takes gold below $1,400), we expect the precious metals to rally significantly. The final decline might take as little as 1-3 weeks, so it's important to stay alert to any changes.
Most importantly - stay healthy and safe. We made a lot of money on the March decline and the subsequent rebound (it's initial part) price moves (and we'll likely make much more in the following weeks and months), but you have to be healthy to really enjoy the results.
By the way, we recently opened a possibility to extend one's subscription for a year with a 10% discount in the yearly subscription fee (the profits that you took have probably covered decades of subscription fees...). It also applies to our All-Inclusive Package (if you didn't know - we just made huge gains shorting crude oil and are also making money on both the decline and temporary rebound in stocks). The boring time in the PMs is over and the time to pay close attention to the market is here - it might be a good idea to secure more access while saving 10% at the same time.
Important: If your subscription got renewed recently, but you'd like to secure more access at a discount - please let us know, we'll make sure that the discount applies right away, while it's still active. Moreover, please note that you can secure more access than a year - if you secured a yearly access, and add more years to your subscription, each following year will be rewarded with an additional 10% discount (20% discount total). We would apply this discount manually - please contact us for details.
Secure more access at a discount.
As always, we'll keep you - our subscribers - informed.
To summarize:
Trading capital (supplementary part of the portfolio; our opinion): Full speculative short positions (250% of the full position) in mining stocks is justified from the risk to reward point of view with the following binding exit profit-take price levels:
Senior mining stocks (price levels for the GDX ETF): binding profit-take exit price: $10.32; stop-loss: none (the volatility is too big to justify a SL order in case of this particular trade); binding profit-take level for the DUST ETF: $231.75; stop-loss for the DUST ETF: none (the volatility is too big to justify a SL order in case of this particular trade)
Junior mining stocks (price levels for the GDXJ ETF): binding profit-take exit price: $9.57; stop-loss: none (the volatility is too big to justify a SL order in case of this particular trade); binding profit-take level for the JDST ETF: $284.25; stop-loss for the JDST ETF: none (the volatility is too big to justify a SL order in case of this particular trade)
For-your-information targets (our opinion; we continue to think that mining stocks are the preferred way of taking advantage of the upcoming price move, but if for whatever reason one wants / has to use silver or gold for this trade, we are providing the details anyway. In our view, silver has greater potential than gold does):
Silver futures downside profit-take exit price: $8.58 (the downside potential for silver is significant, but likely not as big as the one in the mining stocks)
Gold futures downside profit-take exit price: $1,382 (the target for gold is least clear; it might drop to even $1,170 or so; the downside potential for gold is significant, but likely not as big as the one in the mining stocks or silver)
Long-term capital (core part of the portfolio; our opinion): No positions (in other words: cash)
Insurance capital (core part of the portfolio; our opinion): Full position
Whether you already subscribed or not, we encourage you to find out how to make the most of our alerts and read our replies to the most common alert-and-gold-trading-related-questions.
Please note that the in the trading section we describe the situation for the day that the alert is posted. In other words, it we are writing about a speculative position, it means that it is up-to-date on the day it was posted. We are also featuring the initial target prices, so that you can decide whether keeping a position on a given day is something that is in tune with your approach (some moves are too small for medium-term traders and some might appear too big for day-traders).
Plus, you might want to read why our stop-loss orders are usually relatively far from the current price.
Please note that a full position doesn't mean using all of the capital for a given trade. You will find details on our thoughts on gold portfolio structuring in the Key Insights section on our website.
As a reminder - "initial target price" means exactly that - an "initial" one, it's not a price level at which we suggest closing positions. If this becomes the case (like it did in the previous trade) we will refer to these levels as levels of exit orders (exactly as we've done previously). Stop-loss levels, however, are naturally not "initial", but something that, in our opinion, might be entered as an order.
Since it is impossible to synchronize target prices and stop-loss levels for all the ETFs and ETNs with the main markets that we provide these levels for (gold, silver and mining stocks - the GDX ETF), the stop-loss levels and target prices for other ETNs and ETF (among other: UGLD, DGLD, USLV, DSLV, NUGT, DUST, JNUG, JDST) are provided as supplementary, and not as "final". This means that if a stop-loss or a target level is reached for any of the "additional instruments" (DGLD for instance), but not for the "main instrument" (gold in this case), we will view positions in both gold and DGLD as still open and the stop-loss for DGLD would have to be moved lower. On the other hand, if gold moves to a stop-loss level but DGLD doesn't, then we will view both positions (in gold and DGLD) as closed. In other words, since it's not possible to be 100% certain that each related instrument moves to a given level when the underlying instrument does, we can't provide levels that would be binding. The levels that we do provide are our best estimate of the levels that will correspond to the levels in the underlying assets, but it will be the underlying assets that one will need to focus on regarding the signs pointing to closing a given position or keeping it open. We might adjust the levels in the "additional instruments" without adjusting the levels in the "main instruments", which will simply mean that we have improved our estimation of these levels, not that we changed our outlook on the markets. We are already working on a tool that would update these levels on a daily basis for the most popular ETFs, ETNs and individual mining stocks.
Our preferred ways to invest in and to trade gold along with the reasoning can be found in the how to buy gold section. Additionally, our preferred ETFs and ETNs can be found in our Gold & Silver ETF Ranking.
As a reminder, Gold & Silver Trading Alerts are posted before or on each trading day (we usually post them before the opening bell, but we don't promise doing that each day). If there's anything urgent, we will send you an additional small alert before posting the main one.
Thank you.
Sincerely,
Przemyslaw Radomski, CFA
Editor-in-chief, Gold & Silver Fund Manager

