

Briefly: in our opinion, full (250% of the regular position size) speculative short positions in mining stocks are justified from the risk/reward point of view at the moment of publishing this Alert.
Welcome to this week's flagship Gold & Silver Trading Alert. As we promised you previously, in our flagship Alerts, we will be providing you with bigger, more complex analyses (approximately once per week) and it will usually take place on Monday.
Even though it might seem to be the case, the most important analogies and long-term trends didn't change during the previous week, and most of our previous extensive comments still remain up-to-date in general.
As it is the case usually, we will quote last week's comments while updating everything that needs to be updated or changed. In the end, the entire below analysis is up-to-date at the moment of publishing. The parts that we didn't change (or changed only insignificantly) since last week, will be put in italics.
The most important fundamental factor right now remains the Covid-19 pandemic and what might be referred to as the Great Lockdown. We'll start with discussing the latest news on this front and we'll move to the technical part of today's analysis next. Today's Covid-19 discussion will be shorter than previously.
COVID-19 Revisited
The new Covid-19 cases didn't really slow down either globally (first chart), or in the US (second chart).
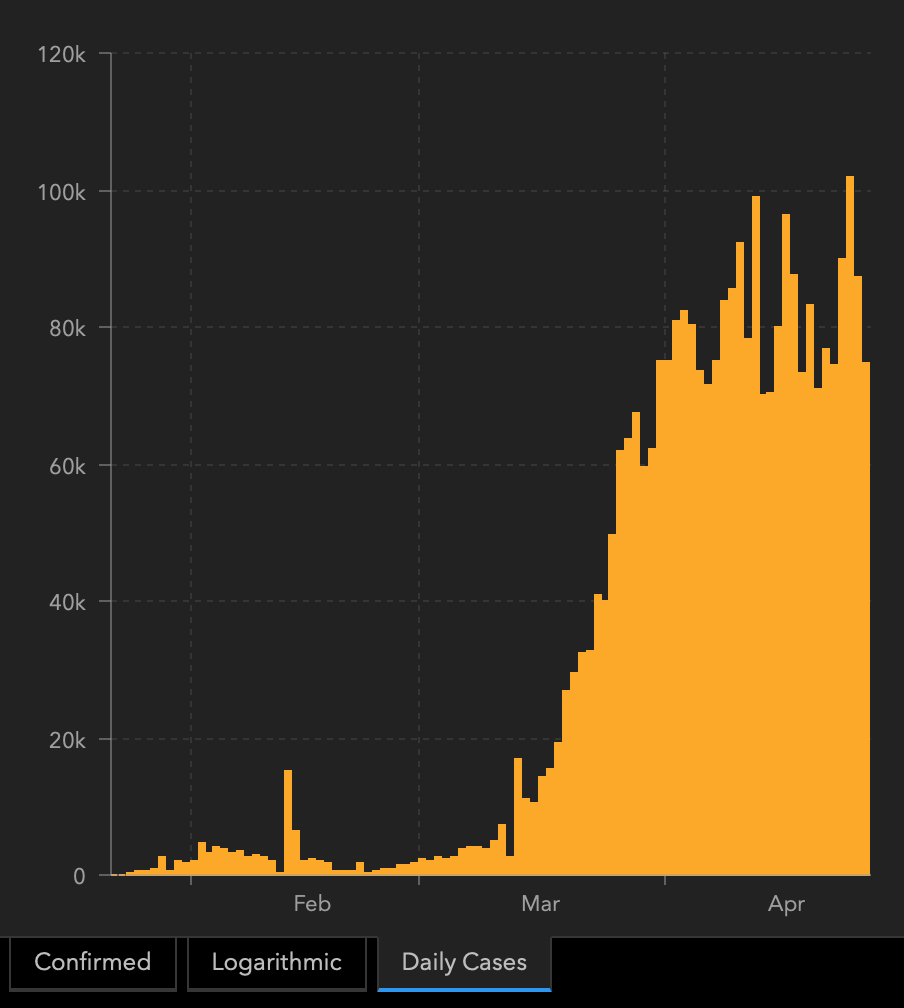
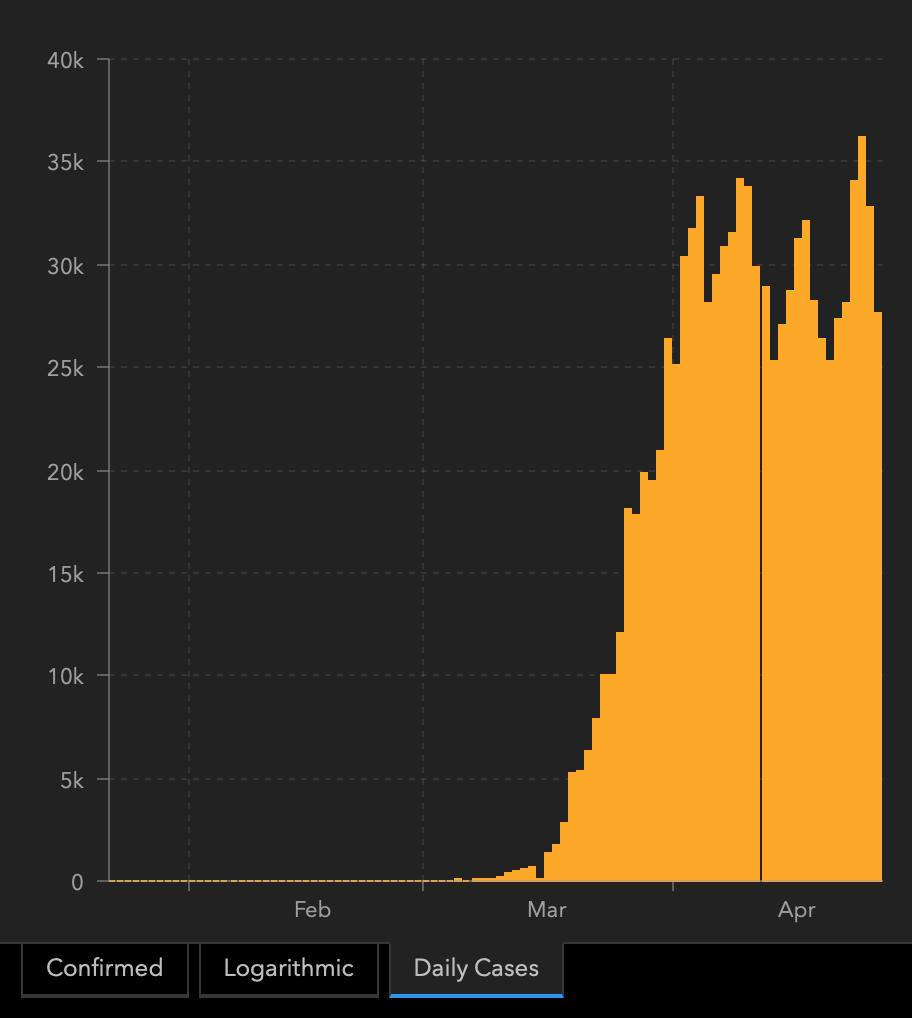
The real numbers including deaths are likely much higher due to testing kit shortage.
The official US Covid-19 death toll at the moment of writing these words is about 55k (up by 16k since the last week), and there are officially 965k Covid-19 cases in the US (up by 231k from the previous week).
Some countries are starting (!) to get back on track, while some are seeing the explosion in new cases. Overall, things are not improving globally.
Almost every official out there, claims to be data-dependent and wants to reopen the economy once the situation regarding the Covid-19 virus is under control, and the number of new cases and new deaths is low and after a steady decline. At the same time, global protests are putting pressure on the leaders to reopen the economies. In most cases, the protesters are not adhering to the social distancing rules, they don't wear masks etc. The latter is the factor due to which the spread of the virus is likely to increase, and it should show in the statistics within the next few weeks.
All this means that the economies will either be reopened way too soon (as the officials give in the to the protesters), or we might even see riots and possibly the use of the military, in case of more violent cases. In case of the former, the healthcare would likely be overwhelmed, and the death toll would increase dramatically. In both cases, the implications are very bad for the economy. And to make things worse, it's not something that tax cuts or Fed's money printing could fix.
This makes the fundamental case for gold very promising, but in the short run, this could mean another big wave down, just as people sell most assets and raise cash - just like they did in March. At some point, the precious metals market will be able to rise regardless of the above and despite strongly rising US dollar. The million-dollar question is if we are past this moment or whether is it still ahead. And that's what we'll strive to detect in the technical part of today's analysis.
But first, a bit more on the fundamental front, with the emphasis on the implications for the stock market and gold.
Will We Win This War With Coronavirus?
Yes, of course, we will win! People are smart and creative beings. The number of scientific articles on COVID-19 is increasing all the time, while the scope of cooperation between scientists from around the world is unprecedented.
However, our triumph may occur later than the markets think. On Thursday, the stocks market fell on the Chinese remdesivir trial report that Gilead Science's experimental antiviral drug did not improve patients' condition or reduce the pathogen's presence in the bloodstream. The drop in equities clearly shows that investors become delusional and that the recent rally in the stock market is based on hopes that the pandemic is a very temporary shock after which we will see a V-shaped recovery.
As we explained several times, such hopes are unlikely to materialize. Why? First, our knowledge about the coronavirus is still limited. And there are important downside risks. For example, Japan and Singapore face now the second wave of infections. Meanwhile, the recent study shows that coronavirus' ability to mutate has been vastly underestimated. The really frightening point is that the most aggressive strains of the coronavirus could generate 270 times as much viral load as the least potent type, which could explain the death toll in the New York. The virus' ability to mutate is a real obstacle to developing a successful vaccine.
Second, although the US epidemiological curve has flattened somewhat, it remains steeper than for other countries - and the epidemic is far from over. As the chart below shows, although the country could pass the peak in daily deaths, the total number of confirmed cases still shows exponential dynamics.
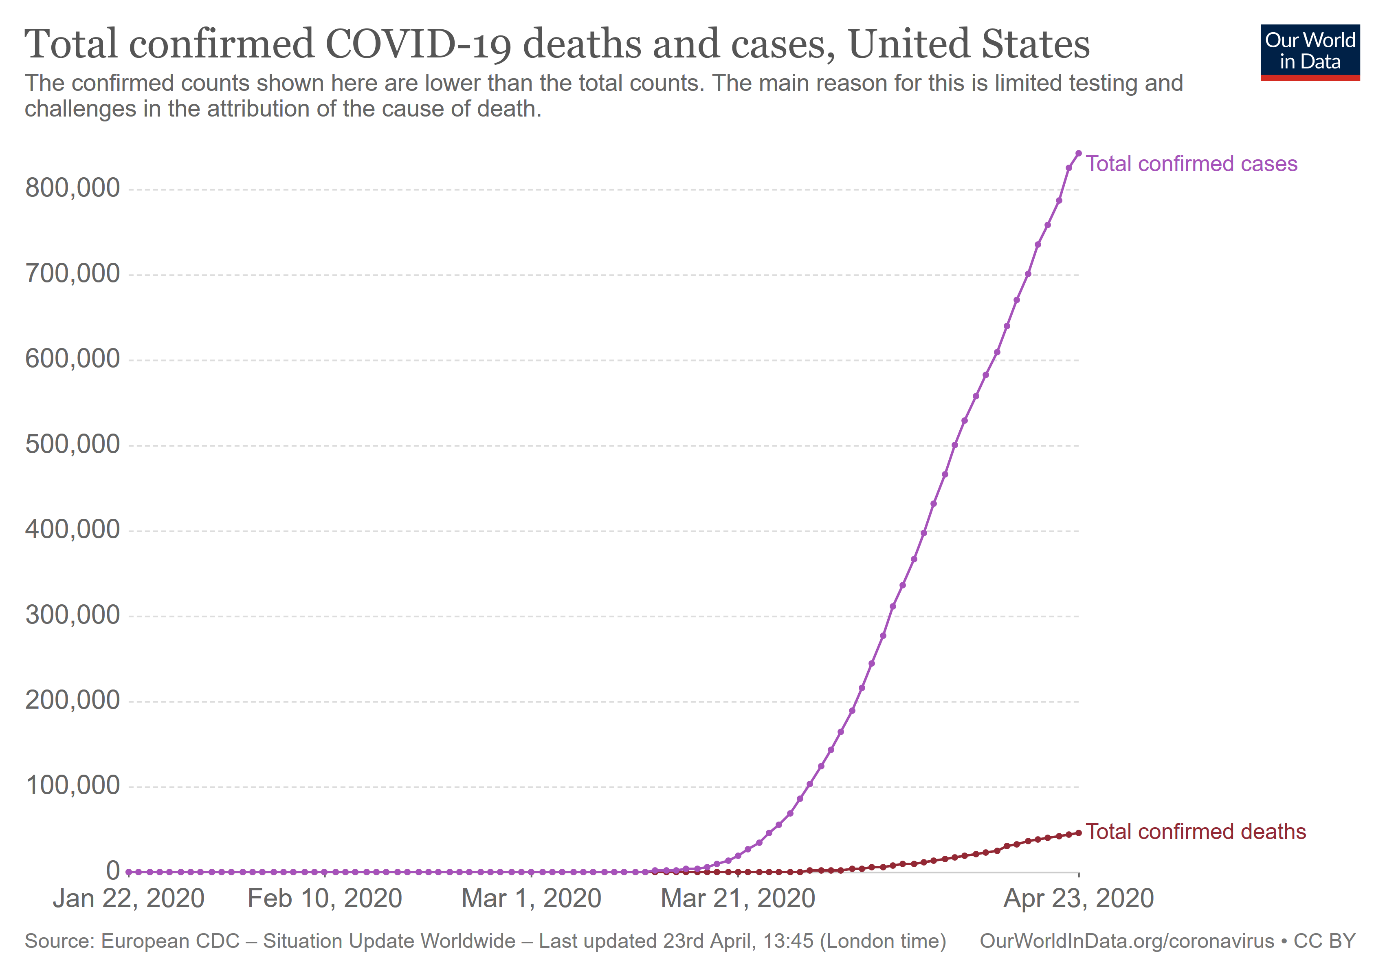
As one can see, the total number is more than 840,000, while the total confirmed deaths are almost 47,000, which means that the simple case fatality rate is above 5 percent! This does not look like a seasonal flu, does it? Of course, the time lag (the virus incubation period is assumed to be up to 14 days) increases the true mortality rate (as some of the current patients will die later), but on the other hand the unconfirmed cases decreases the true mortality rate. What is the true number nobody knows, so for simplicity I decided to keep with the widely cited CFR.
What is more, The Economist shows that the official covid-19 death tolls still underestimates the true number of fatalities, as they exclude anybody who did not die in hospital or who did not test positive, or who were killed by other conditions that could not be treated successfully because of the overwhelmed hospitals.
The Great Fundamental Disconnect
Moreover, the corporate earnings are only expected to decline by 10 percent in the Q2 2020, although we experience the most severe recession since the Great Depression. Surely, the stock market is not an economy and the stock market does not care what people believe it should do, but the fundamental disconnect is puzzling. Yes, the stock market is forward-looking, but it does not mean that its expectations are always correct - after all, in early February, it did not expect the global pandemic and lockdown. JP Morgan has recently warned that given the expected decline in GDP by about 10 percent in Q2, corporate profits could decline as much as 70 percent. The Fed supports the Wall Street, but gold investors should be prepared for possible declines in stock prices. We could see then some selloff in the gold market, but the safe-haven demand for gold should strengthen.
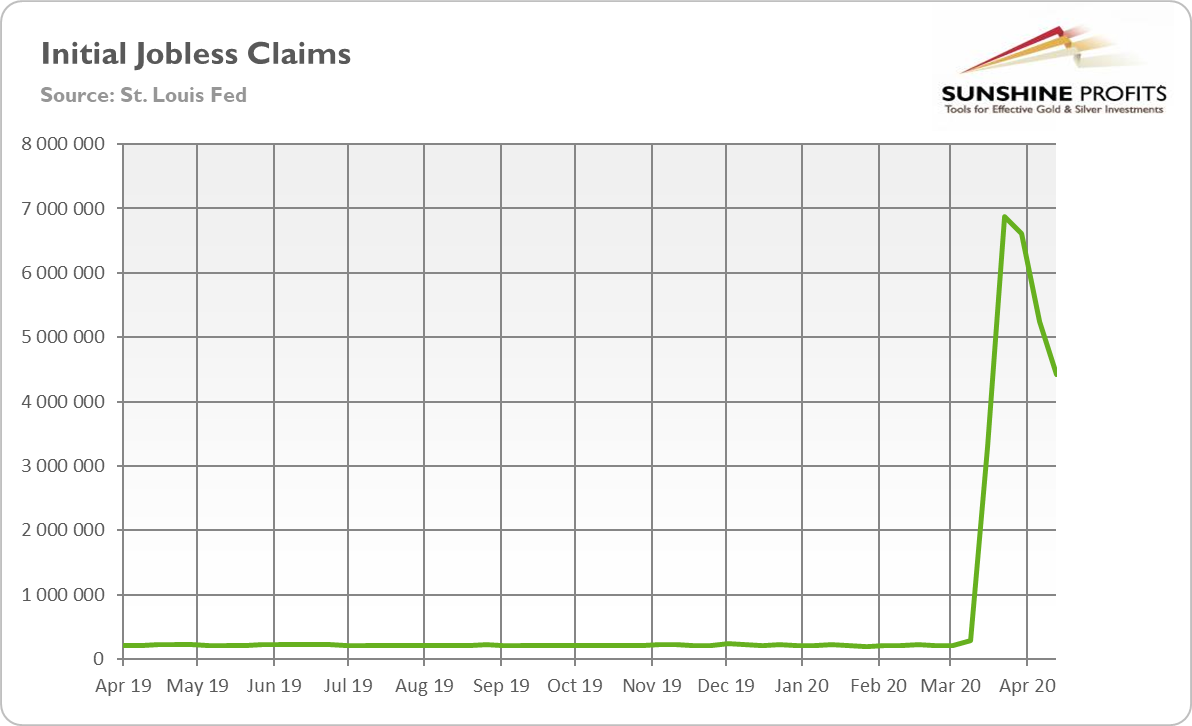
The disconnect is really intriguing. Please look at the chart below, which shows the updated numbers of the jobless claims. As one can see, between April 11 and April 18, 4.4 million of Americans lost their jobs. It seems that since the beginning of the crisis, 26.5 million of people filed for the unemployment benefits. Assuming that no one dropped out from the labor market, the implied unemployment rate is about 24 percent, the level seen last time during the Great Depression. So, isn't the recent stock market rally a bit suspicious?
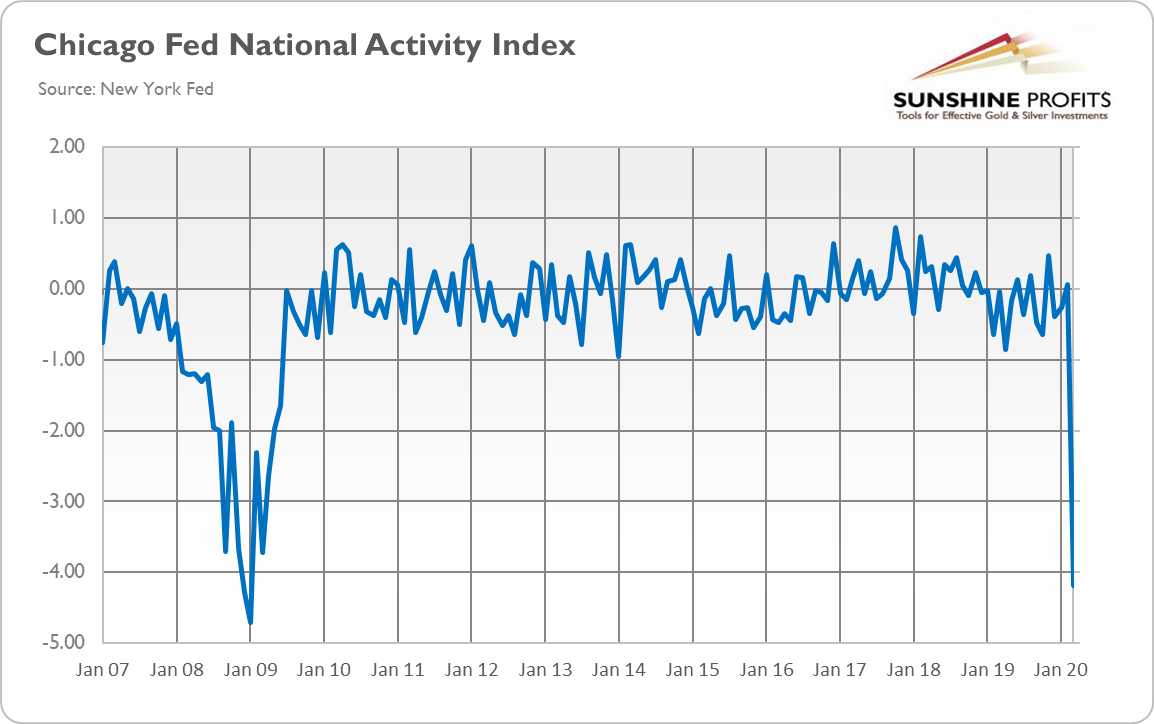
Moreover, the US flash services PMI fell from 39.8 in March to 27, a record low, while the manufacturing PMI declined from 48.5 to 36.9, the lowest level in 11 years, as the Great Lockdown crashed business activity. Last but not least, as the chart below shows, Chicago Fed National Activity Index declined to -4.19 in March, the lowest level since January 2009. And April will be even worse!
Implications for Gold
What does it all mean for the gold market? The current economic data are really depressing. At the same time, the stock markets seemed unmoved. However, we think that there could be a correction in the equity valuations. If this happens, gold may initially be hit, but it should eventually emerge as a great beneficiary from this turmoil.
Anyway, even without the further declines in the stock market (upside risks also exist after all - we keenly listen to both sides of the story at Stock Trading Alerts), gold should shine this year due to the recession, high indebtedness and dovish central banks. By the way, on Wednesday, the FOMC will publish its newest monetary policy statement, while Powell will hold the press conference - both events could affect the markets. Given the circumstances, the Fed is likely to please the Wall Street and deliver the dovish message, which should benefit the gold prices.
Not necessarily, right away though, as gold could initially be seriously hit when the stock market slides.
Let's take a look at the technical details.
Silver and miners are likely to be particularly affected, just like they were during the March decline. This is also the case since it's the final year of the US Presidential cycle.
Assets' Returns and Presidential Cycle
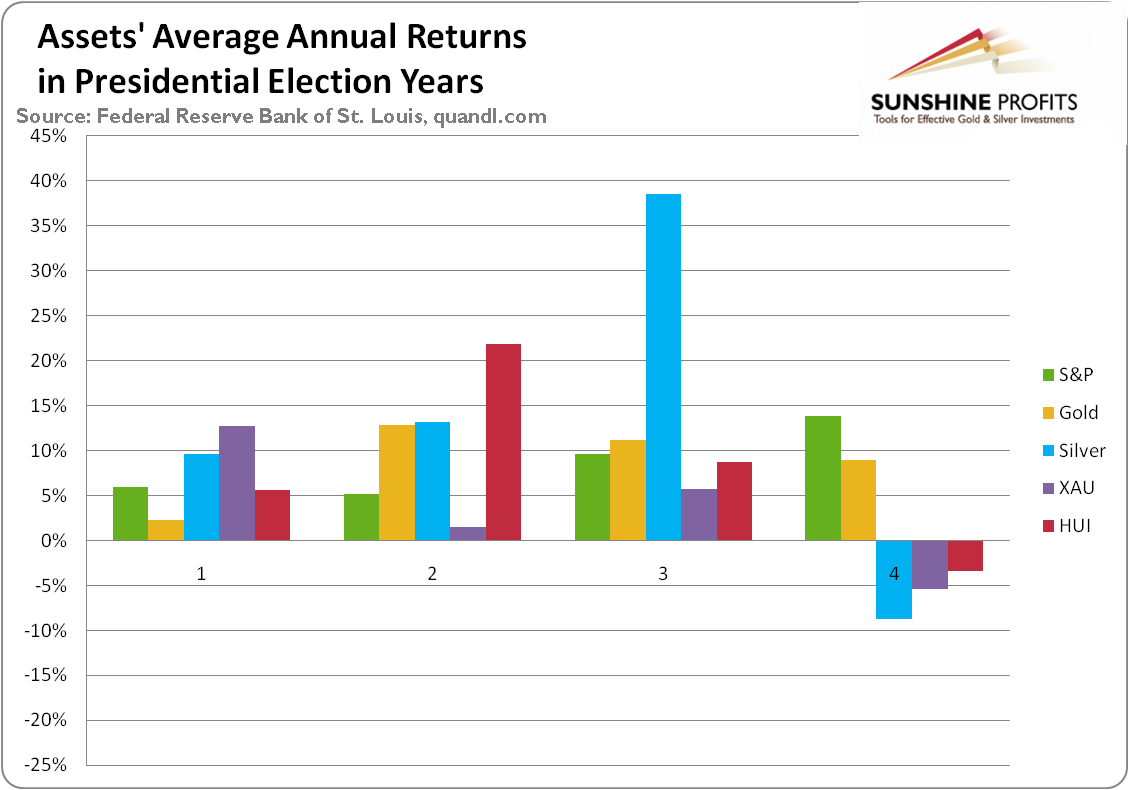
Average annual return of S&P (1948-2015, green line), gold (London P.M. Fix, 1972-2015, yellow line), silver (London Fix, 1972-2015, blue line), XAU Index (1984-2015, purple line) and HUI Index (1997-2015, red line) in presidential election cycles.
Gold's performance is more or less average in the election year, but in case of silver and mining stocks, we see something very different. Namely, the election year is the only year when - on average - they all decline.
So, does it mean that gold won't be affected by this specific cyclicality, but silver and miners will be? Not really. It seems that the above chart shows that silver and miners - on average - lead gold lower. They perform worst in the election year and the yellow metal is the worst choice in the following year - the first year of presidency.
Silver is already at new multi-year lows and miners just declined the most during the previous week...Ever. The above-mentioned analogy seems to have worked quite well.
We previously supplemented the above with the discussion of interest rates and QE4. We argued that the lower rates are not likely to help in a sustainable manner and neither will QE4. But we could see a temporary rally based on this factor.
Well, let's see what the previous quantitative easing programs did.
Quoting from our explanation of the link between QE and gold:
"The effects of quantitative easing on the gold market depended on how it was perceived by investors. Initially, after the financial crisis of 2008, quantitative easing was positive for the price of gold. It was a new and unprecedented program, which undermined the investors' confidence and caused a fear of inflation or even hyperinflation. However, the U.S. economy recovered after some time and there was no inflation on the horizon. In consequence, the price of gold entered a decline in September 2011, just two months after the end of the QE2. As the confidence in the Fed and the U.S. economy was restored, the third round of the quantitative easing was welcomed by the investors. The increased confidence reduced risk premia and the bidding for tail risk insurance. Consequently, the stock market rose, while the price of gold declined."
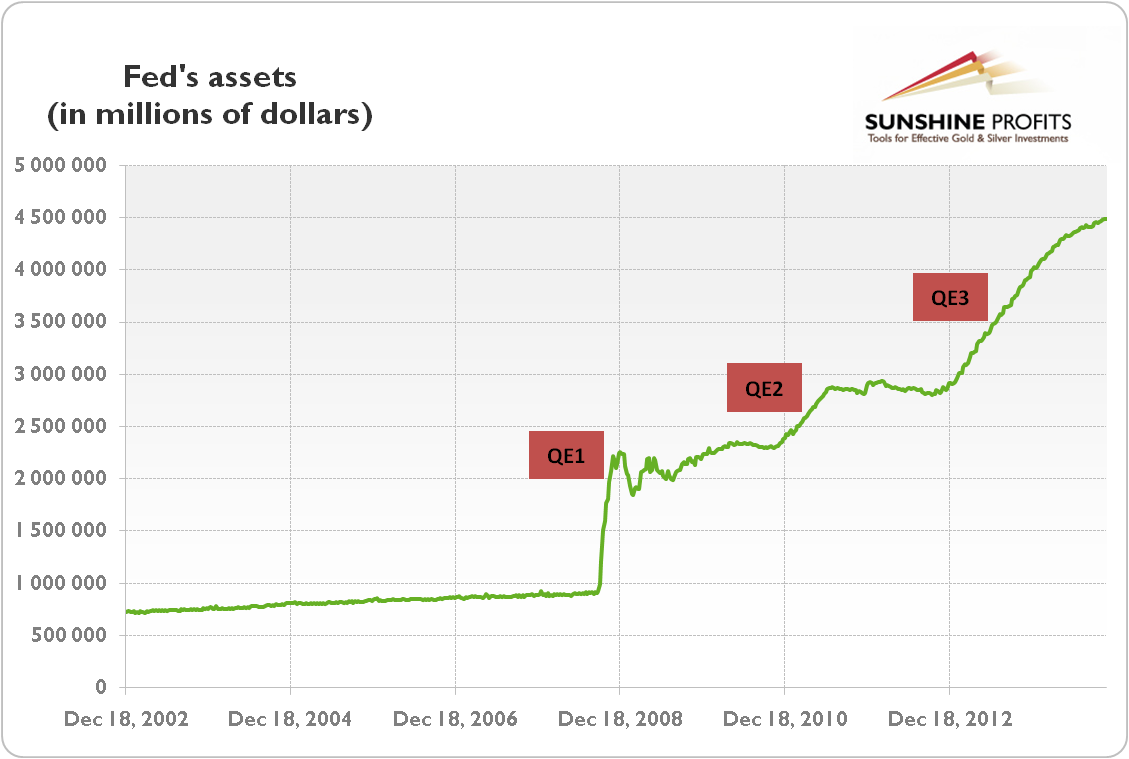
QE1 was very bullish for the precious metals sector - the market was surprised, and the precious metals market was already after a huge decline.
QE2 was still bullish for the PMs and miners, but not as much as the first round.
QE3 started in the final part of 2012 and as it continued, PMs and miners declined profoundly. QE3 didn't prevent the decline.
Each round of the QE program was less bullish than the previous one. This trend doesn't suggest placing a lot of bullish faith in QE4 with regard to the precious metals market.
The most bullish QE was the one that was launched after gold had already declined severely for months. This is definitely not the case right now. What is the case right now is that gold just declined tens of dollars despite the dovish change in investors' expectations toward interest rates. This suggest than neither rate cuts, nor QE4 may be able to stop the decline that just started - at least not on their own and not until gold drops much further.
One more thing regarding the elections. Trump is the anti-establishment President. Perhaps the "establishment" actually wants the stock market to tumble this year, to make sure that the next U.S. President will be pro-establishment. Consequently, perhaps the stock market won't be saved until it drops much lower, and until the U.S. dollar is soaring much higher, proving that pro-lower-dollar-Trump was unable to get what he aimed for.
The Big Picture View of the USD Index and Gold
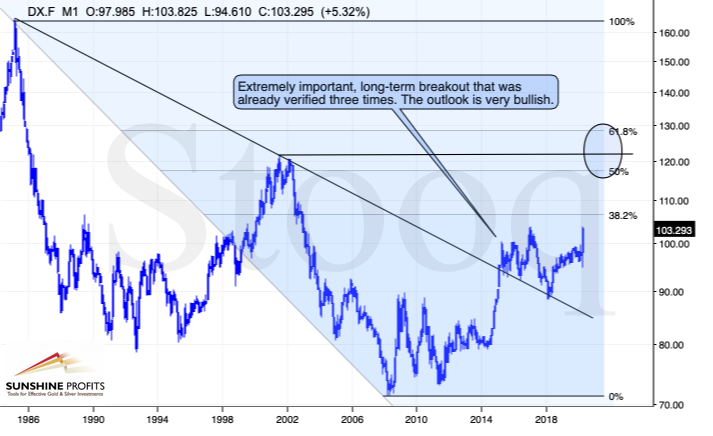
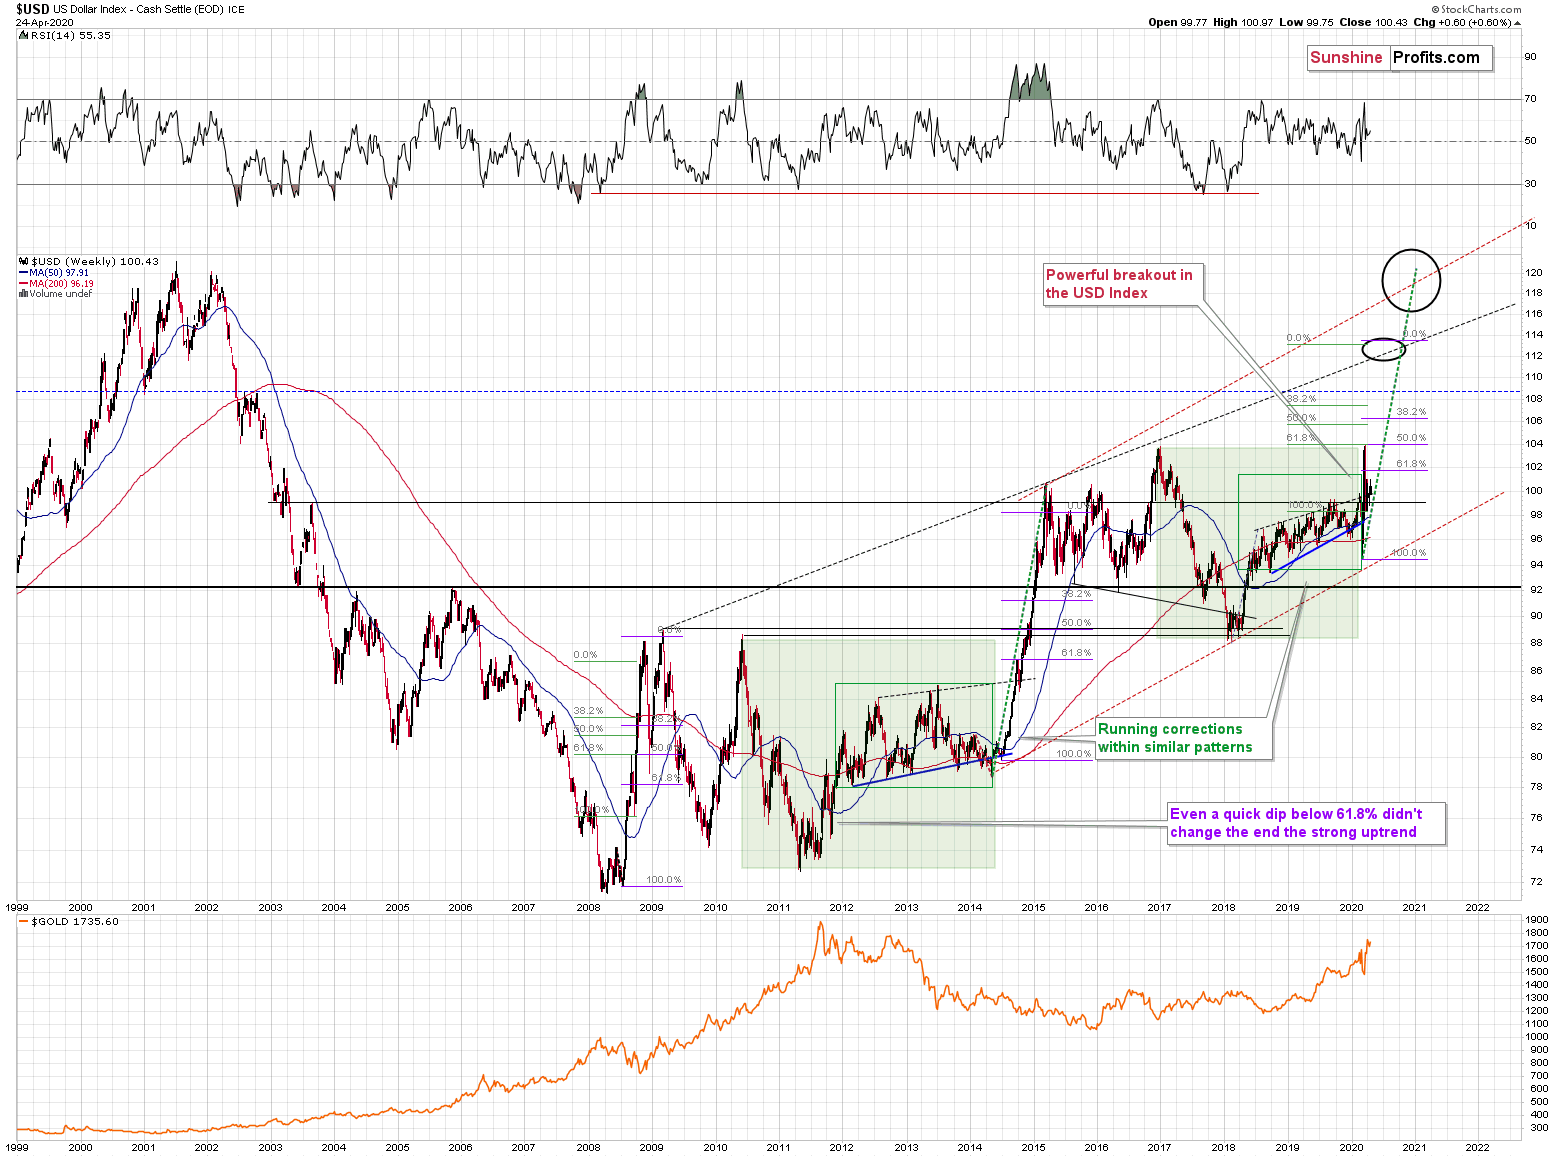
The 2014-2015 rally caused the USD Index to break above the declining very-long-term resistance line, which was verified as support three times. This is a textbook example of a breakout and we can't stress enough how important it is.
The most notable verification was the final one that we saw in 2018. Since the 2018 bottom, the USD Index is moving higher and the consolidation that it's been in for about a year now is just a pause after the very initial part of the likely massive rally that's coming.
If even the Fed and the U.S. President can't make the USD Index decline for long, just imagine how powerful the bulls really are here. The rally is likely to be huge and the short-term (here: several-month long) consolidation may already be over.
There are two cases on the above chart when the USD Index was just starting its massive rallies: in the early 1980s and in mid-90s. What happened in gold at that time?

These were the starting points of gold's most important declines of the past decades. The second example is much more in tune with the current situation as that's when gold was after years of prolonged consolidation. The early 1980s better compare to what happened after the 2011 top.
Please note that just as what we saw earlier this year, gold initially showed some strength - in February 1996 - by rallying a bit above the previous highs. The USD Index bottomed in April 1995, so there was almost a yearly delay in gold's reaction. But in the end, the USD - gold relationship worked as expected anyway.
The USD's most recent long-term bottom formed in February 2018 and gold seems to have topped right now. This time, it's a bit more than a year of delay, but it's unreasonable to expect just one situation to be repeated to the letter given different economic and geopolitical environments. The situations are not likely to be identical, but they are likely to be similar - and they indeed are.
What happened after the February 1995 top? Gold declined and kept on declining until reaching the final bottom. Only after this bottom was reached, a new powerful bull market started.
Please note that the pace at which gold declined initially after the top - in the first few months - was nothing to call home about. However, after the initial few months, gold's decline visibly accelerated.
Let's compare the sizes of the rallies in the USDX and declines in gold. In the early 80s, the USDX has almost doubled in value, while gold's value was divided by the factor of 3. In the mid-90s, the USDX rallied by about 50% from its lows, while gold's value was divided by almost 1.7. Gold magnified what happened in the USD Index in both cases, if we take into account the starting and ending points of the price moves.
However, one can't forget that the price moves in USD and in gold started at different times - especially in the mid-90s! The USDX bottomed sooner, which means that when gold was topping, the USDX was already after a part of its rally. Consequently, when gold actually declined, it declined based on only part of the slide in the USDX.
So, in order to estimate the real leverage, it would be more appropriate to calculate it in the following way:
- Gold's weekly close at the first week of February 1996: $417.70
- USDX's weekly close at the first week of February 1996: 86.97
- Gold's weekly close at the third week of July 1999: $254.50
- USDX's weekly close at the third week of July 1999: 103.88
The USD Index gained 19.44%
Gold lost 39.07% (which means that it would need to gain 64.13% to get back to the $417.70).
Depending on how one looks at it, gold actually multiplied USD's moves 2-3 times during the mid-90 decline.
And in the early 1980s?
- Gold's weekly close at the third week of January 1980: $845
- USDX's weekly close at the third week of January 1980: 85.45
- Gold's weekly close at the third week of June 1982: $308.50
- USDX's weekly close at the third week of June 1982: 119.01
The USD Index gained 39.27%
Gold lost 63.49% (which means that it would need to gain 173.91% to get back to $845).
Depending on how one looks at it, gold actually multiplied USD's moves by 1.6 - 4.4 times during the early-80 decline.
This means that just because one is not using U.S. dollars as their primary currency, it doesn't result in being safe from gold's declines that are accompanied by USD's big upswings.
In other words, the USD Index is likely to soar, but - during its decline - gold is likely to drop even more than the USD is going to rally, thus falling in terms of many currencies, not just the U.S. dollar.
Please note that there were wars, conflicts and tensions between 1980 and 2000. And the key rule still applied. Huge rallies in the USD Index mean huge declines in gold. If not immediately, then eventually.
On April 6th, we wrote that gold could first rally to or slightly above its 2020 high and decline in a volatile manner shortly thereafter. The former has already taken place, and now it seems that the latter will happen.
Since the USD Index is such an important piece of the puzzle, let's take a look at its charts.
More on the USD Index and Gold
You already saw the most important USD Index chart 2 charts ago - the USDX is after a major, long-term breakout that was confirmed a few times, so it's now in a strong long-term uptrend. Let's keep in mind that it doesn't mean that the situation in the US is perfect - it means that it's better than in other territories - mostly in the EU and Japan. And that does seem to be the case.
Having said that let's take a look at the above chart. Quoting our previous comments on it appears justified as practically all the long- and medium-term points remain up-to-date.
The USD Index was previously (for the entire 2019 as well as parts of 2018 and 2020) moving up in a rising trend channel (all medium-term highs were higher than the preceding ones) that formed after the index ended a very sharp rally. This means that the price movement within the rising trend channel was actually a running correction, which was the most bullish type of correction out there.
If a market declines a lot after rallying, it means that the bears are strong. If it declines a little, it means that bears are only moderately strong. If the price moves sideways instead of declining, it means that the bears are weak. And the USD Index didn't even manage to move sideways. The bears are so weak, and the bulls are so strong that the only thing that the USD Index managed to do despite Fed's very dovish turn and Trump's calls for lower USD, is to still rally, but at a slower pace.
We previously wrote that the recent temporary breakdown below the rising blue support line was invalidated, and that it was a technical sign that a medium-term bottom was already in.
The USD Index soared, proving that invalidation of a breakdown was indeed an extremely strong bullish sign.
Interestingly, that's not the only medium-term running correction that we saw. What's particularly interesting is that this pattern took place between 2012 and 2014 and it was preceded by the same kind of decline and initial rebound as the current running correction.
The 2010 - 2011 slide was very big and sharp, and it included one big corrective upswing - the same was the case with the 2017 - 2018 decline. They also both took about a year. The initial rebound (late 2011 and mid-2018) was sharp in both cases and then the USD Index started to move back and forth with higher short-term highs and higher short-term lows. In other words, it entered a running correction.
The blue support lines are based on short-term lows and since these lows were formed at higher levels, the lines are ascending. We recently saw a small breakdown below this line that was just invalidated. And the same thing happened in early 2014. The small breakdown below the rising support line was invalidated.
Since there were so many similarities between these two cases, the odds are that the follow-up action will also be similar. And back in 2014, we saw the biggest short-term rally of the past 20+ years. Yes, it was bigger even than the 2008 rally. The USD Index soared by about 21 index points from the fakedown low.
The USDX formed the recent fakedown low at about 96. If it repeated its 2014 performance, it would rally to about 117 in less than a year. Before shrugging it off as impossible, please note that this is based on a real analogy - it already happened in the past.
In fact, given this month's powerful run-up, it seems that nobody will doubt the possibility of the USD Index soaring much higher. Based on how things are developing right now, it seems that the USD Index might even exceed the 117 level, and go to 120, or even higher levels. The 120 level would be an extremely strong resistance, though.
Based on what we wrote previously in today's analysis, you already know that big rallies in the USD Index are likely to correspond to big declines in gold. The implications are, therefore, extremely bearish for the precious metals market in the following months.
On March 23rd, we wrote that the USD Index was ripe for a correction, and that was indeed the case.
However, a few weeks passed, and the USD Index now appears to be ready for another powerful upswing.
USDX in Focus
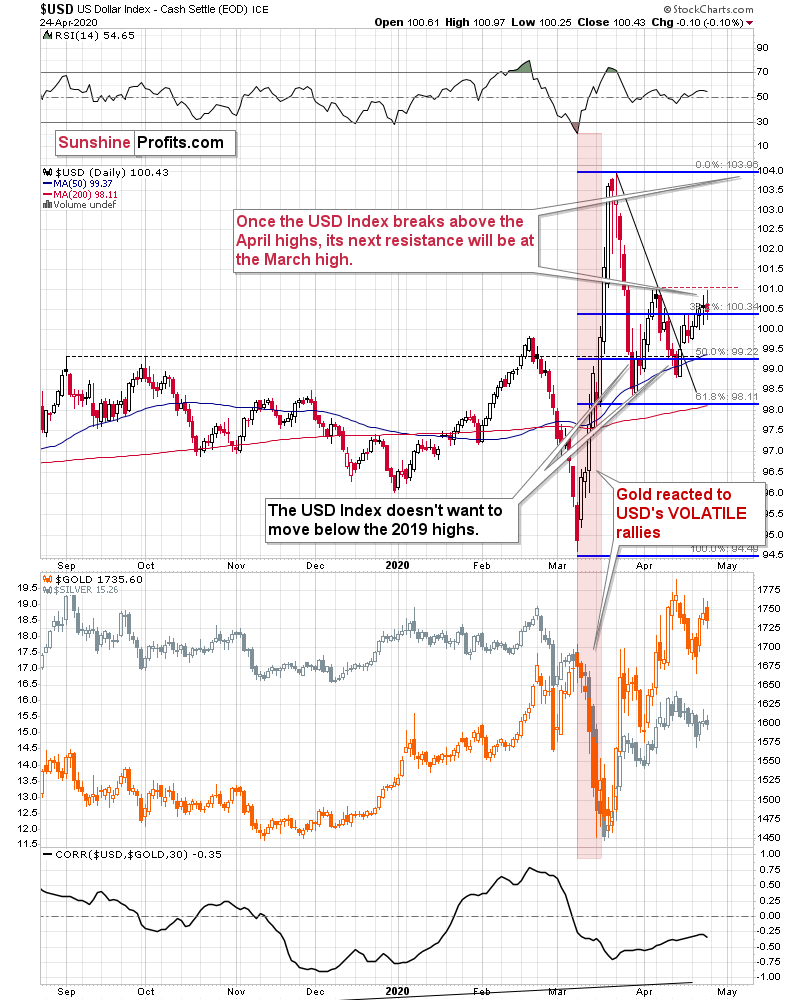
In short, the USD Index is after a huge rally and a correction. In late March, the USD Index corrected the previous rally in terms of price moves, but not in terms of time. The latter is what it seems to have been doing for the past month. The USD Index did move higher in April, but the moves were relatively boring - somewhat similar to how it rallied in January and February. And what did gold do at that time? It moved higher, and then declined at some point once it got too high too fast - practically regardless of what the USD Index was doing. That was in the final part of February.
Please check what silver did in January and February. It moved mostly higher, only to decline in the final part of the month. Overall the initial action was positive but rather nothing to call home about. Gold's rebound in early March was accompanied by rather weak action in silver.
What's happening now? Gold declined in mid-April, similar to how it declined in late February. The USD Index initially triggered the move, but then gold declined for a few days regardless of what the USDX was doing. And the rebound that we saw last week? Silver's upswing was nothing to call home about - just like what we saw in early March.
Back in March, gold's rally ended after the first clear intraday decline. Interestingly, the very first day of gold's March slide - March 9th - took place when the USD Index also declined. That daily decline, however, was actually the start of a powerful rally.
That USD Index rally was not only powerful, but it was also volatile. It was volatile not only in general, but also in terms of each individual trading day.
Guess what - Friday was the day when gold clearly declined on an intraday basis, and that was also when the USD Index declined a bit. Silver hasn't done much.
What is even more interesting is that today, gold is also declining (about $10 at the moment of writing these words) along with the decline in the USD Index (about 0.26 decline at the moment of writing these words).
Just like it wasn't clear that gold was topping in the first half of March, it's far from being clear now - at least for most market participants.
Neither we would bet the farm on the scenario in which gold topped on Thursday, but it does seem quite likely.
The recent link between gold and the general stock market - and the fact that they both declined profoundly in March, seems more important, though.
Consequently, let's take a brief look at the stock market (it's analyzed more thoroughly in our Stock Trading Alerts).
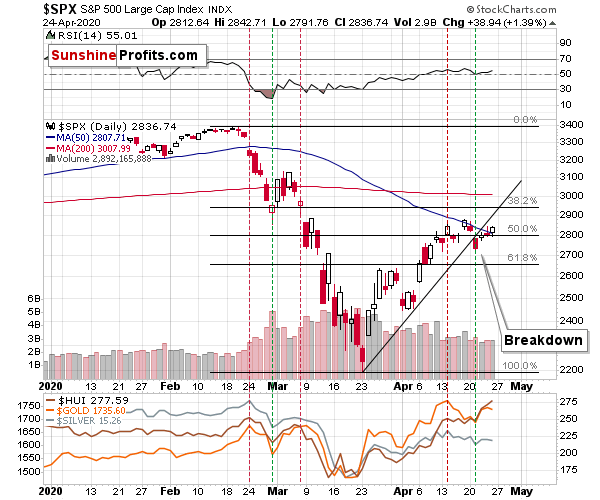
In general, the above chart shows that the S&P 500 lost its momentum and broke below the rising trend channel. It moved higher since that time, but the breakdown was not invalidated. This has bearish implications going forward. In reality, it's just a confirmation of what we wrote with regard to how the situation is developing from the fundamental point of view and how it's likely to develop in the future.
Stocks are too high given what's likely ahead as investors don't seem to realize the long-term implications of what's happening right now, still counting on the V-shaped economic recovery. The market is forward looking and once more people start to realize what's going on, the stock market is likely to fall.
You know that UBER's stock price just moved to new April high on Friday? It makes little sense given that the restrictions are likely to be in place longer, not shorter than initially expected. Instead of looking at data, investors seem to be focusing on the fact that the re-opening talks are taking place - which "seems to suggest" that re-opening the economy is somewhat close or that it would be the first step toward getting quickly to how things were before. It's not quick, and it might even require a step back first, if the second wave of the virus hits first - which seems quite likely given how the protests are taking place.
It's very likely that stocks will decline over the next several weeks, but the question is when will investors start to - massively - realize that the worst is yet to come?
The vertical dashed lines provide interesting details from the precious metals investors' and traders' point of view. Namely, they show that in late February and early March, the PMs and miners were lagging the stock market. The declines in stocks started earlier. In fact, when the first serious daily decline in the stock market took place (February 24th), the PMs and miners topped. We marked this day with the red vertical line.
Then the stock market declined, and when it bottomed, gold, silver and miners also formed a daily bottom. That was on February 28th and we marked it with a green line. What happened next is that we saw a corrective rebound, which lasted longer in case of the precious metals market than it did in case of the general stock market. Once again stocks topped first, and the precious metals market topped approximately on the day when the stock market declined quite visibly (red line - March 6th).
We're seeing something similar also this month. The initial top in stocks formed on April 14th (red line) and that was also the top in the precious metals market. Then stocks bottomed on April 21st, which was also the day when the precious metals market bottomed (more or less).
The late-February - early March performance seems to be repeating.
The difference is in the performance of the mining stocks, which used to lag, and now they leap gold and the general stock market. What gives? Well, during the analogous period in March (around March 6th), stocks moved higher, but they didn't even manage to correct half of the decline from the February high. Right now, the stock market (taking the overnight futures into account) is slightly above the April 14th high. Mining stocks, being more correlated with the general stock market are moving higher relative to gold as they take their strength from the general stock market. Moreover, if the general stock market is about to top shortly, it's quite likely to expect the previously worst performing stocks, to shine now (that's what tends to happen at the market tops).
All the above suggests that the general stock market is likely to top any day now, and when the first sizable daily slide takes place, we'll have a good indication that the next huge decline in the precious metals market is about to start or that it has just started.
When could that take place? Quite possibly as early as this week. Please note that the spacing between the horizontal lines that we saw in late February and early March was approximately symmetrical. Plus, they were about a week apart.
Based on the above symmetry and the week analogy (which remains intact as the initial top and the most recent bottom were exactly one week apart) it seems that the next top or the significant daily slide could take place tomorrow - on Tuesday. Of course, there's no guarantee that it would happen, but it does seem quite likely.
This means that the next local top in the precious metals sector - including the mining stocks - might be at hand, quite possibly today or tomorrow.
The first sizable decline in the stock market will serve as an indication and the sizable daily decline in gold, silver, and mining stocks that follows - likely on the next day - will serve as a confirmation.
The 2008 - 2020 Analogy
The analogy to 2008 got invalidated in terms of the shape of the price moves, but it doesn't mean that it's completely useless. The key implication is that the final decline in gold, silver, and mining stocks was bigger than almost everyone thought was possible at that time, it was quick (took 2 weeks from the last top) and it was particularly profound in case of silver and mining stocks.
Even if the profound decline in the stock market is delayed as people continue to think that the situation is now under control and it's all over (for 1-4 weeks - until the second wave of the virus hits based on the lockdowns being lifted too early or based on the protests themselves), it's highly unlikely that another massive slide in the stock market can be avoided.
And the precious metals market is likely to respond to such slide with lower prices - at least initially (for the first 2 weeks or so).
Gold's Technical Details
Now, since the decline in gold started from levels that were higher than the analogous levels in 2008, how low could the gold price sink at the bottom?
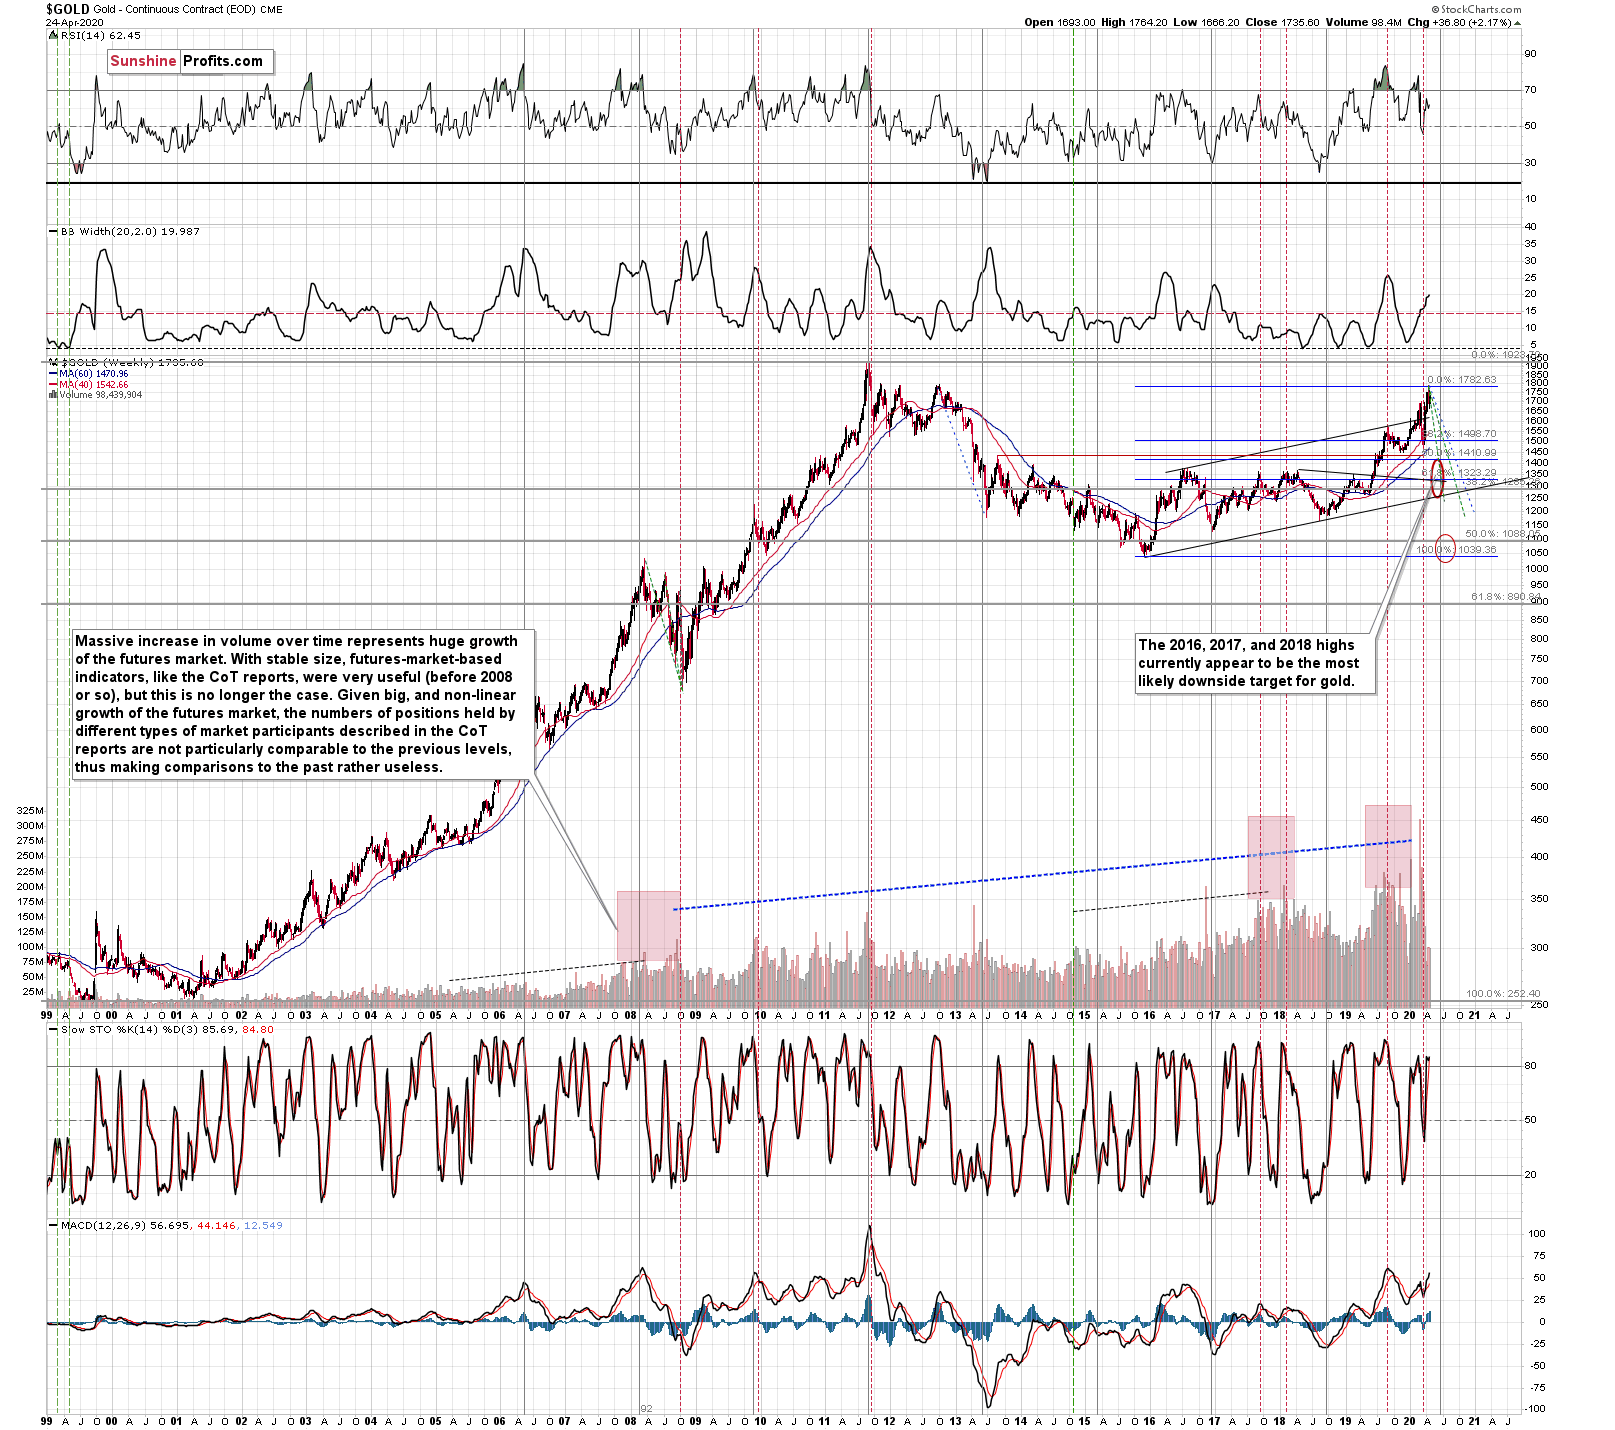
Our current (and it might change in the following days) estimate is that gold would decline to the 2016, 2017, and 2018 lows - slightly below $1,400. Why? Because this level is confirmed by several major highs, which makes it the strongest support that's below the previous 2020 lows.
Moreover, back in 2008, gold bottomed about 8% below its initial September bottom. The recent bottom in gold was about $1,451. If the history repeats itself, gold could decline to 92% x $1,451 = about $1,335.
In 2008, gold also declined by about 27% from its previous high. If the history repeats itself here, and gold topped yesterday (which seems quite likely), we can see gold's bottom at 73% x $1,789 = about $1,306.
The 2016, 2017, and 2018 highs are the strongest gold support that we have close to the above-mentioned price levels. Gold's fundamental situation is even better now than it was in 2008, so we think that looking for the support above the above-mentioned 2008-based price levels is more appropriate than basing it the above-mentioned gold trading tips. The 2016, 2017, and 2018 highs fulfill this requirement.
This means that gold would be likely to bottom between about $1,350 and $1,380.
In other news, gold just invalidated its breakout above the previous highs in terms of the euro, and it also broke below the rising support line, which by itself is a lower border of the rising wedge pattern.
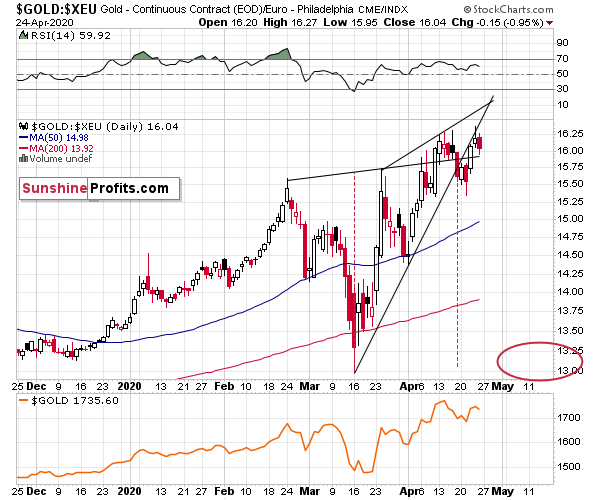
That's a very bearish sign as it means that gold is likely to continue to magnify USD's rallies as it declines.
As you can see, despite last week's rally, gold was unable to get back above the rising resistance line. Instead, gold topped at this line and at its previous April highs.
Interestingly, the vertex of the rising wedge pattern is today, suggesting that perhaps we'll see some kind of price extreme within the next several hours. This means that perhaps today's weakness in both: gold and the USD Index will be at least to some extent reversed and we'll see gold make another attempt to move higher. The latter would could result in either the final high, or a local high. Either way, the gold price in terms of the euro would be likely to decline shortly thereafter.
In light of the above, what happens in gold today is relatively unclear.
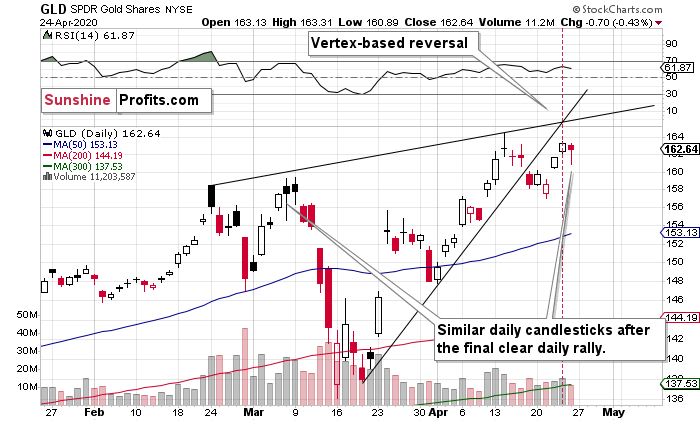
Still, based on the GLD ETF analysis it seems that it has already topped. After all, it reversed right at the vertex-based reversal. Interestingly, it then declined in a similar way to how it declined on March 6th. This means that perhaps the decline doesn't fully start today, but on Tuesday or Wednesday, as the analogies in the stock market and the gold price in euro chart indicate.
The next support is theoretically at the early April lows, but given gold's weakness relative to the USDX and the fact that the latter is likely to soar shortly, it seems rather unlikely that gold will decline by just $25 or so. A move several times larger seems more likely. The nearest strong support level that fills this requirement is the early April low - a bit below $1,600.
That's our next interim target that could generate a (dead cat) bounce before the decline continues.
What about silver?
In short, the major 2008 - 2020 analogy in terms of price moves remains intact.
Silver Shares Its Two Cents
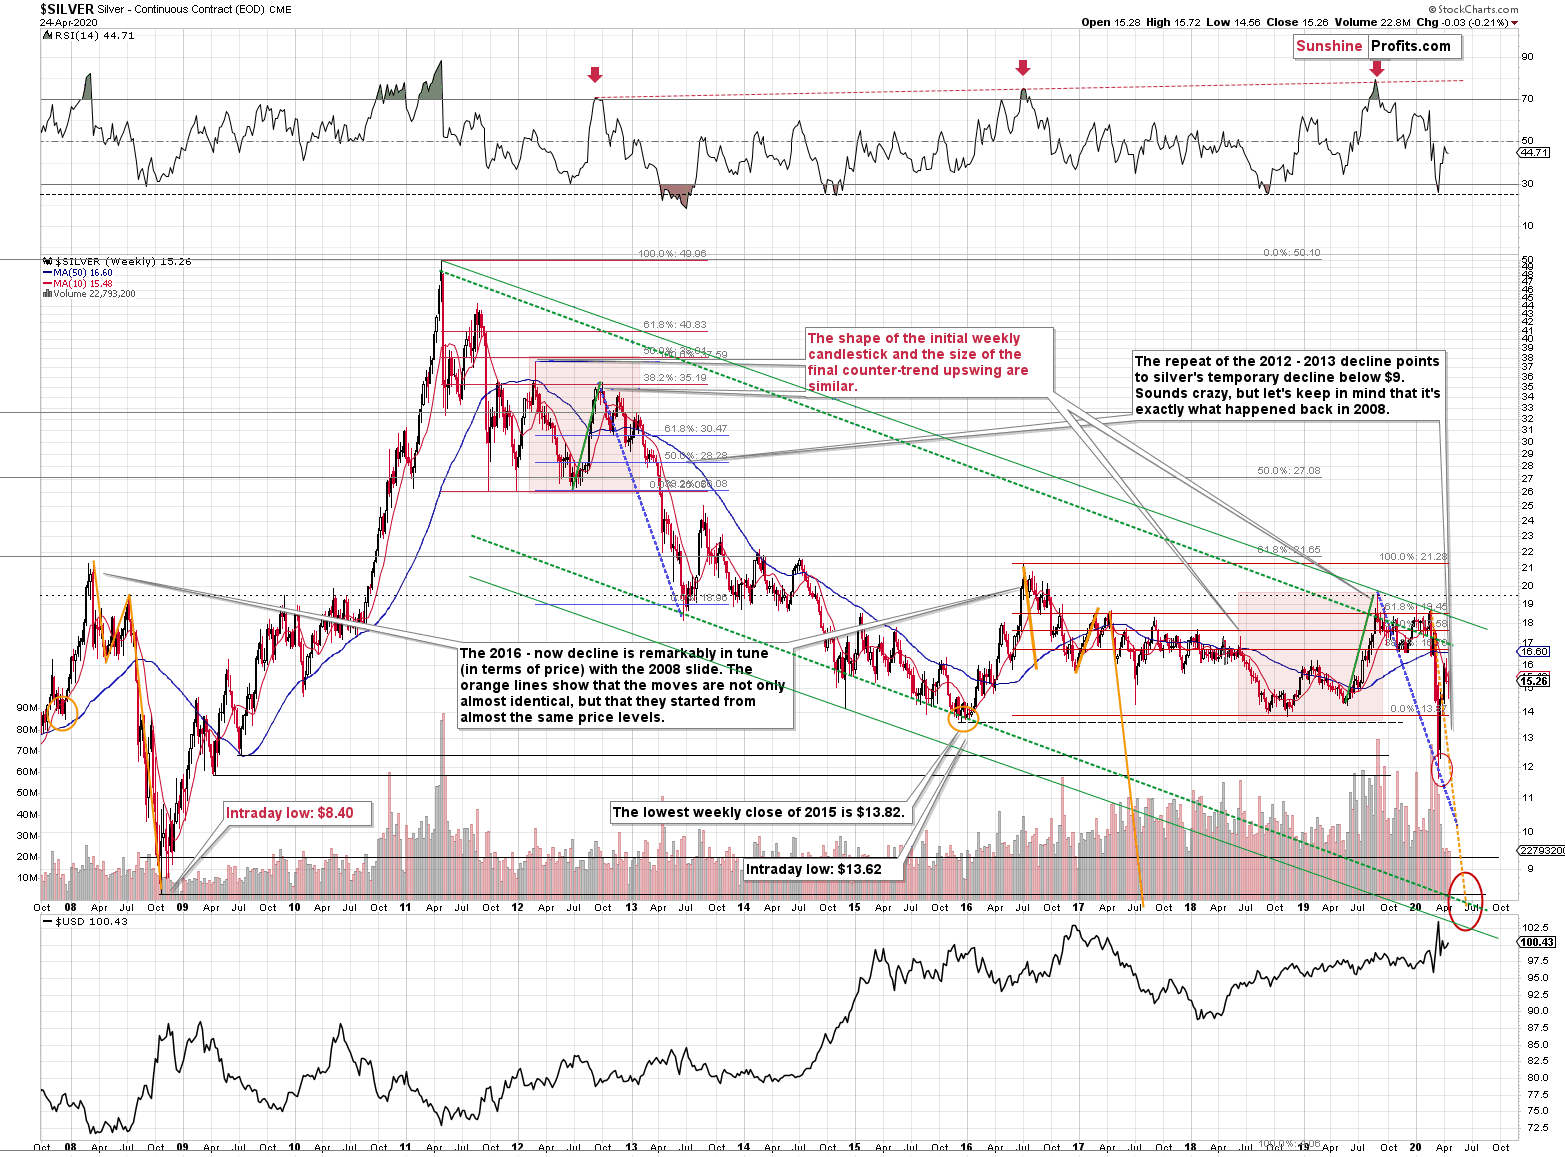
Silver plunged to our initial target level and reversed shortly after doing so. It was for many months that we've been featuring the above silver chart along with the analogy to the 2008 slide. People were laughing at us when we forecasted silver below $10.
Well, the recent low of $11.64 proves that we were not out of our minds after all. Our initial target was reached, and as we had explained earlier today, the entire panic-driven plunge has only begun.
Those who were laughing the loudest will prefer not to notice that silver reversed its course at a very similar price level at which it had reversed initially in 2008. It was $12.40 back then, but silver started the decline from about 50 cent higher level, so these moves are very similar.
This means that the key analogy in silver (in addition to the situation being similar to mid-90s) remains intact.
It also means that silver is very likely to decline AT LEAST to $9. At this point we can't rule out a scenario in which silver drops even to its all-time lows around $4-$5.
Note: Silver at or slightly below $8 seems most probable at this time.
Crazy, right? Well, silver was trading at about $19 less than a month ago. These are crazy times, and crazy prices might be quite realistic after all. The worst is yet to come.
Let's quote what the 2008-now analogy is all about in case of silver.
There is no meaningful link in case of time, or shape of the price moves, but if we consider the starting and ending points of the price moves that we saw in both cases, the link becomes obvious and very important. And as we explained in the opening part of today's analysis, price patterns tend to repeat themselves to a considerable extent. Sometimes directly, and sometimes proportionately.
The rallies that led to the 2008 and 2016 tops started at about $14 and we marked them both with orange ellipses. Then both rallies ended at about $21. Then they both declined to about $16. Then they both rallied by about $3. The 2008 top was a bit higher as it started from a bit higher level. And it was from these tops (the mid-2008 top and the early 2017 top) that silver started its final decline.
In 2008, silver kept on declining until it moved below $9. Right now, silver's medium-term downtrend is still underway. If it's not clear that silver remains in a downtrend, please note that the bottoms that are analogous to bottoms that gold recently reached, are the ones from late 2011 - at about $27. Silver topped close to $20.
The white metal hasn't completed the decline below $9 yet, and at the same time it didn't move above $19 - $21, which would invalidate the analogy. This means that the decline below $10, perhaps even below $9 is still underway.
Now, some may say that back in 2008, silver rallied only to about $14 and since now it rallied to about $16, so the situation is now completely different and that the link between both years is broken. But that's simply not true.
The nominal price levels are just one of the ways that one should look at the analogy - far from being the perfect or most important one.
Please note that back in 2008, there were two smaller bottoms in silver, and this time we saw just one. The decline before the bottom was sharper, so is it really that surprising that the rebound was sharper as well? Silver ended the 2008 corrective upswing once it moved visibly above the declining orange line and that's exactly what happened recently. It also topped once it reached its 10-week moving average (red line). That's exactly what just happened.
This MA is at $15.48 and at the moment of writing these words, silver is back below it, trading at $15.35.
The situations are not perfectly identical in terms of nominal prices, but they remain remarkably similar given how different fundamental reasons are behind these price moves (in reality, what's behind both declines is fear that - itself - doesn't change).
The technique used for predicting silver price is clearer than the one that we applied for gold, so it seems useful to look not only at the USD Index for signs, but also at the white metal itself. Once silver moves to $8 or below it, it will likely serve as a strong buy sign for gold, regardless of the price at which gold will be trading at that time.
Also, please note that silver formed a big shooting star candlestick during the previous week, which is a topping sign. The volume was low, but it was not low just during the formation of this candlestick, but it's been low during this month's upswing as well. It's relatively unclear whether the volume is confirming or invalidating the shooting star. Consequently, we view it as a bearish confirmation, and we wouldn't open a position based just on it. However, since it's just one of the factors pointing to much lower silver prices in the next few weeks, we view the very bearish outlook as justified.
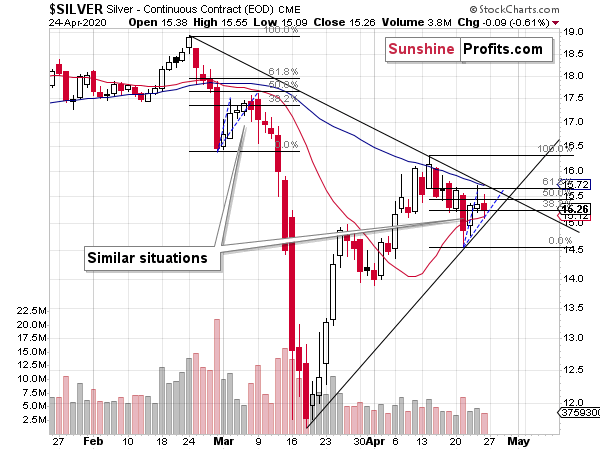
On the short-term note, we see that silver is more or less repeating its early-March performance. The price moves are not identical in terms of the Fibonacci retracement levels, but comparing the size and shape of the initial rallies (blue dashed lines) we get almost identical results. After rallying sharply initially, silver started to do... pretty much nothing. That was the same in early March. It was after a few additional days, when silver's corrective upswing had really ended, and the big slide started.
If the similarity to the early-March continues, we can expect the decline to start on Wednesday or very close to it. Please note that silver's first few days of the decline were noticeable, but not huge. However, once silver broke below its previous lows, it took only three sessions for the white metal to slide below $12. Let's keep in mind that previously silver started from higher price levels.
The implications are bearish for the following few weeks and rather neutral for the next few days.
And what about the miners?
Mining Stocks
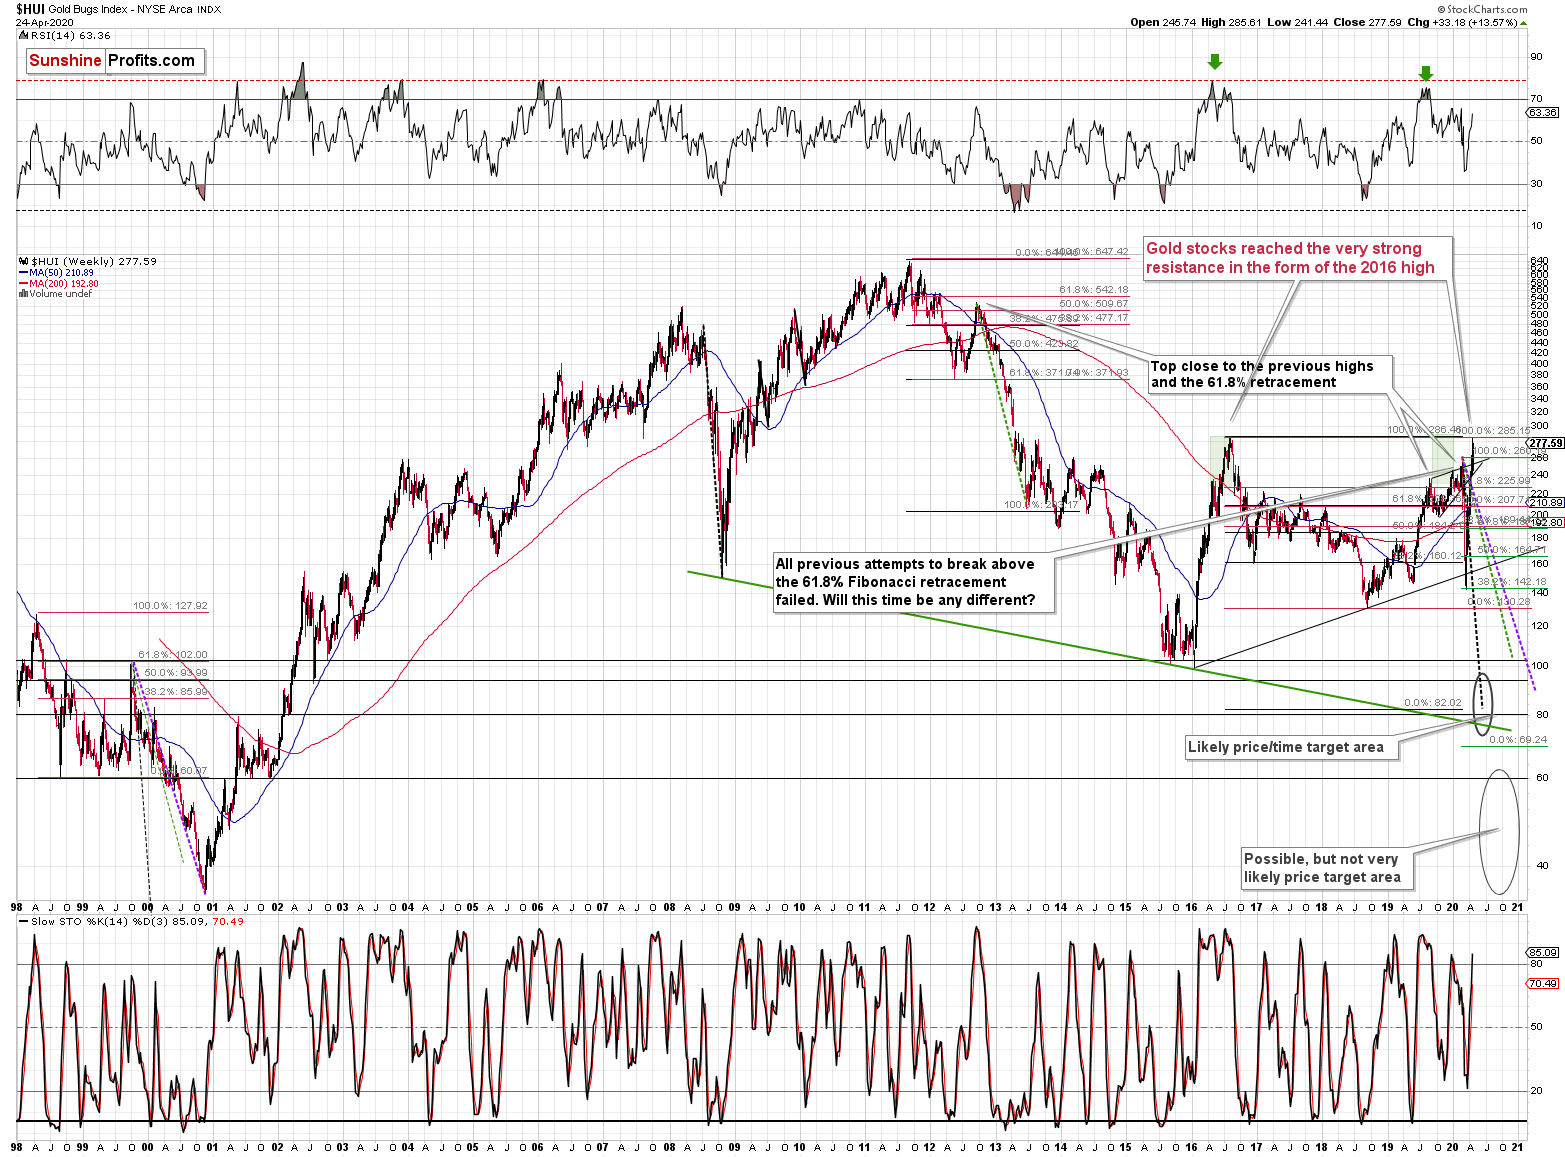
The HUI Index declined significantly, and then it rebounded significantly.
Both are likely linked. Miners first declined more sharply than they did in 2008, so the rebound was also sharper. Based on the stimulus and gold reaching new yearly highs, miners also rallied and tried to move to new yearly highs. It's not surprising.
However, if the general stock market is going to decline significantly one more time, and so will gold - and as you have read above, it is very likely - then miners are likely to slide once again as well. This would be in tune with what happened in 2008.
At this time, it may seem impossible or ridiculous that miners could slide below their 2015 lows, but that's exactly what could take place in the following weeks. With gold below their recent lows and the general stock market at new lows, we would be surprised not to see miners even below their 2020 lows. And once they break below those, their next strong resistance is at the 2016 low. However, please note that miners didn't bottom at their previous lows in 2008 - they moved slightly lower before soaring back up.
Please note that the HUI Index just moved to its 2016 high which serves as a very strong resistance. Given the likelihood of a very short-term (1-2 days?) upswing in stocks and perhaps also in gold (to a rather small extent, but still), it could be the case that gold miners attempt to rally above their 2016 high and... Spectacularly fail, invalidating the move. This would be a great way to start the next huge move lower.
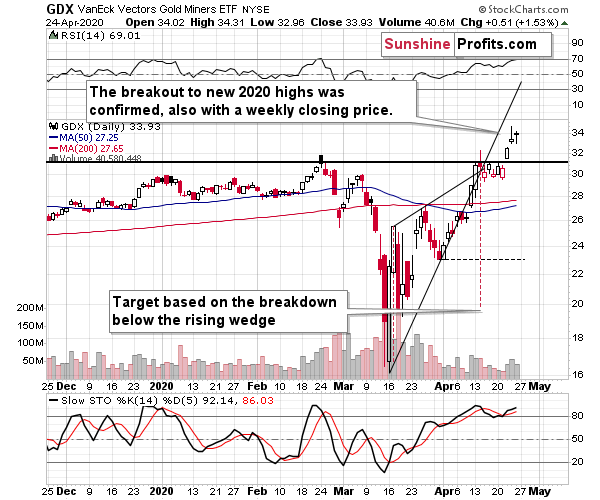
The GDX ETF managed to break above the previous 2020 highs and confirm this breakout in terms of three consecutive daily closes, and a weekly close. The above chart is now bullish for the mining stocks.
However, given how close the powerful long-term resistance (as presented on the previous HUI Index chart) is, and what's likely ahead for the GLD ETF and the general stock market, we doubt that this breakout would be able to generate anything more than a 1-2 day upswing.
It seems that those who are more short-term oriented (or the more advanced traders) might want to limit their exposure to the mining stocks or the precious metals sector until the situation clarifies, while those who aren't might prefer to keep the short positions intact as it seems that within the next 1-3 weeks, gold miners will be much (!) lower.
Finally, before summarizing, we would like to reply to questions that we received recently.
From the Readers' Mailbag
Q1: I am not sure if you mean the target for the USDX in the coming few days and weeks is 102 or should it be any higher?
The 102 level was the very short-term target. The next target is at about 104, but if the next move lower in the general stock market is indeed more profound than what we've seen so far this year, then the USDX would be likely to rally well above this level. Our final target for the next 3- 12 months is the 118 - 120 area.
Q2: Secondly, you mentioned the interim support for gold is around $1600. Could this be the ultimate and final bottom before Gold turns up for good? and Do we hold our position as the bounce is taking place ?
A: It could be the case that this is indeed the final bottom, but we view this as relatively unlikely. That's why looking for confirmations is so important. Ideally we want gold to react to USD's upswing and general stock market's decline with sharply lower prices, and then - as moves in both: USDX and stocks continue - we would see a rebound in gold, silver, and miners. If this happened with gold at about $1,600, it could imply that the final bottom in gold is already in. It seems more likely in our view, that gold will drop lower than that before the said strength becomes visible.
Q: A quick question for you this evening on your published price targets for the precious metals. I see that you've given "binding profit-take exit price(s)" for the ETFs and metals. However, these are different from the targets your analyses predict. Allow me to use silver as an example to make sure I understand:
Based on your analysis, silver could go as low as $7.77 in the coming weeks - or even lower! However, once silver drops to (or past) $8.58, you recommend taking profits on investments tied to silver (for example, DSLV). Is that the correct interpretation of the "binding profit-take exit price(s)"? No matter how low gold/silver/GDX/GDXJ end up going, it's prudent to take profits at the published amounts? (for example, selling JDST whenever GDXJ hits $9.57.)
I understand you are prohibited from giving specific investment advice for my personal situation; I just want to confirm that I understand the phrase, "binding profit-take exit price"
A: In general, the analytical part of the analysis provides the most likely turning point levels. However, in case of trading decisions it is not a good idea to place the exit orders exactly at the price levels that one thinks are going to mark the turning point. What if instead of rallying to $123 from $100, a sample asset of the stock ticker ABC, it "only" rallied to $122.99 and then declined from there? One would be practically correct having previously predicted that the price was going to $123 - it practically did. But because some people placed exit orders slightly lower, the $123 itself was never reached. After reaching the said top, the ABC could then slide to $70 or so. The person, who was essentially right about the price move would lose money instead of making it, just because they wanted to be perfectly right on the trade and exit at the exact top. If this person instead accepted 90% of profits and walked away with them after the stock reached $119.87 or so, they would be much happier with the results.
The analysis could be done correctly and a given forecast might practically work, but technically, due to some random, or very technical or market-specific reasons, the precise price level might differ a bit from the projected price. The odds for that are bigger when a bigger and more daring price projection is being made. That's why our exit targets don't completely match our price projections. It seems that silver could bottom at $7.77 or so, but it doesn't mean that we would prefer to hold the short position until that time. No - instead, we would prefer to cash in enormous profits without the risk of slightly missing the exit price.
Q: Is it not possible that our best laid plans for a precious metals decline could be sabotaged by the Fed desperately inflating the money supply again and again. Couldn't this lead to the dollar hanging in limbo or declining giving the precious metals sector time to recover?
A: This could be the case, but please note what actually happened when the Fed was trying to desperately inject liquidity into the system in March. The market interpreted that as a sign that the crisis was particularly severe and prices kept on declining... Or the above could actually be the fundamental trigger for the action that we're expecting to take place anyway. As the stock market slides profoundly along with the PMs, the Fed injects even more liquidity into the system causing a small upswing in stocks and a small decline in the USDX while at the same time triggering a clear reversal in gold. We would use this as a sign of strength of the precious metals market compared to the other markets.
What we don't expect to see is lower dollar values based on the stimulus from the Fed. This would be the case only if at the same time it was unlikely that the ECB and BOJ (and other monetary authorities) would not be injecting liquidity in their respective systems as well - and they are very likely to do so. Please keep in mind that floating currency exchange rates mean that they all sink, only at different rates.
Q: I assume that when the stock market seriously falls that the mining stocks will at least have a pullback and maybe there is selling of gold as well. but the real question is how much will gold and miners rise before this happens?
A: In our opinion, gold could test its previous 2020 highs at most - we don't expect it to rally further or to confirm a breakout above these highs. Silver is unlikely to rally in any meaningful way, in analogy to how it performed in the first half of March. Mining stocks appear strong right now, but with the long-term resistance level being at hand for the HUI Index, it doesn't seem that miners would be able to rally far, or for much longer. We don't expect to see miners higher than 5% higher than last week's high - if that high at all.
Q1: the manufacturing cost of gold on an avg usd 500 - 700 / oz (depends on mine to mine ) .
if the gold price is usd 1750 / oz , and if i come and sell 10 kg gold , will you buy it being the mine owner ? think
A1: Most likely without the approval of the board, no such transaction would be made. The mining companies have their own way of acquiring the metal and very rarely do they engage in getting extra exposure by buying their product on the market. After all, their business is in selling it. If they want to secure - what they believe to be - great prices, they would hedge their production and lock in the near-certain profit.
By the way, the question is not about it, but many people ask about it every now and then, so it would be a good idea to briefly mention that it is not the case that gold cannot be produced below its cost of production. Gold promoters claim that just because gold price production is XYZ, then gold can never trade below the said XYZ. This is actually (if at all) reversed: gold production costs follow gold price. We don't want to elaborate here, but if you're interested, you'll find details here.
Q2: people are on their saving now, no income so how can they buy gold ? we are human being and what comes first ? our basic need
1. bread n butter
2. house
3. cloths
why dont this point is taken in mind before writing article coming to higher price of gold . it can be bull trap .
look at oil , because of lockdown in most countries , no demand , so the price has come down to zero , why ...because no place to store
in the same way , gold can only be in vaults of fed government and bank vaults . people dont buy because its not their basic need .
people are standing in que to sell gold in thailand ,
1. invest in house... can get rent
2 invest in stock ... can get dividend
3 invest in gold.... only price appreciation (manipulated )
thats my idea , be realistic not live in manipulated world.
A2: Some people have to raise cash to meet their basic needs, but at the same time, some people are thinking hard how to save their millions of dollars from significant inflation that's likely to follow the current massive "money-printing programs". Some people are somewhere in between. And some people will aim to speculate on every short-term move that the three previous groups generate regardless of the real situation in the world.
The actions of the latter group imply that in the short run, gold can do pretty much anything. It can slide, and it can rally.
We don't agree with the storage argument against gold. Gold, and even silver (which is bulkier) can easily be stored almost anywhere, not only in banks. Crude oil takes up a lot of space, while gold or silver don't. Besides, almost all gold that has ever been mined in history still remains accounted for in one way or the other, while crude oil and silver are used up.
If people expect that the value of their currency will be worth significantly less next year and they have already bought enough food (that won't spoil) for months, then protecting their assets (and cash) will be a very urgent need. And gold will become very appealing not only for the millionaires from our previous example. Gold won't provide rent or dividend itself, but it might save one's capital against depreciation better than real estate or stocks. Real estate to some extent as well, but gold is likely to not just preserve ones wealth during very inflationary periods - it's also likely to increase it. Especially, in case of stagflationary environments, and we think that we're heading toward this kind of environment fast.
Still... the above question provides a very good insight into why gold might decline temporarily not only due to technical reasons.
Summary
Summing up, the outlook for the precious metals market remains bearish for the next few weeks, even though the next few days are relatively unclear. The general stock market appears to be ready to top this week and given that gold is declining along with the USD Index today, it seems that the next big move lower in the entire precious metals sector is just around the corner.
The recent strength in the mining stocks doesn't seem to fit the bearish narrative, especially that miners just confirmed their breakout above the previous 2020 high. Still, the flagship proxy for the gold stocks - the HUI Index - is almost right at its 2016 high, which provides a strong resistance, and the relative strength of the general stock market (which likely contributed to rising prices of miners) is likely close to being over.
As it seems likely that we'll see the initial part of the next big mover lower later this week, and more short-term oriented and/or more advanced traders might want to temporarily exit their positions to re-enter them shortly, it seems that taking the next month into account, the big short positions in the mining stocks remain justified.
After the sell-off, we expect the precious metals to rally significantly. The decline might take as little as 1-3 weeks, so it's important to stay alert to any changes.
Most importantly - stay healthy and safe. We're making a lot of money on these price moves (and we'll likely make much more in the following weeks and months), but you have to be healthy to really enjoy the results.
By the way, we recently opened a possibility to extend one's subscription for a year with a 10% discount in the yearly subscription fee (the profits that you took have probably covered decades of subscription fees...). It also applies to our All-Inclusive Package (if you didn't know - we just made huge gains shorting crude oil and are also making money on both the decline and temporary rebound in stocks). The boring time in the PMs is over and the time to pay close attention to the market is here - it might be a good idea to secure more access while saving 10% at the same time.
Important: If your subscription got renewed recently, but you'd like to secure more access at a discount - please let us know, we'll make sure that the discount applies right away, while it's still active. Moreover, please note that you can secure more access than a year - if you secured a yearly access, and add more years to your subscription, each following year will be rewarded with an additional 10% discount (20% discount total). We would apply this discount manually - please contact us for details.
Secure more access at a discount.
As always, we'll keep you - our subscribers - informed.
To summarize:
Trading capital (supplementary part of the portfolio; our opinion): Full speculative short positions (250% of the full position) in mining stocks is justified from the risk to reward point of view with the following binding exit profit-take price levels:
Senior mining stocks (price levels for the GDX ETF): binding profit-take exit price: $10.32; stop-loss: none (the volatility is too big to justify a SL order in case of this particular trade); binding profit-take level for the DUST ETF: $231.75; stop-loss for the DUST ETF: none (the volatility is too big to justify a SL order in case of this particular trade)
Junior mining stocks (price levels for the GDXJ ETF): binding profit-take exit price: $9.57; stop-loss: none (the volatility is too big to justify a SL order in case of this particular trade); binding profit-take level for the JDST ETF: $284.25; stop-loss for the JDST ETF: none (the volatility is too big to justify a SL order in case of this particular trade)
For-your-information targets (our opinion; we continue to think that mining stocks are the preferred way of taking advantage of the upcoming price move, but if for whatever reason one wants / has to use silver or gold for this trade, we are providing the details anyway. In our view, silver has greater potential than gold does):
Silver futures downside profit-take exit price: $8.58 (the downside potential for silver is significant, but likely not as big as the one in the mining stocks)
Gold futures downside profit-take exit price: $1,382 (the target for gold is least clear; it might drop to even $1,170 or so; the downside potential for gold is significant, but likely not as big as the one in the mining stocks or silver)
Long-term capital (core part of the portfolio; our opinion): No positions (in other words: cash)
Insurance capital (core part of the portfolio; our opinion): Full position
Whether you already subscribed or not, we encourage you to find out how to make the most of our alerts and read our replies to the most common alert-and-gold-trading-related-questions.
Please note that the in the trading section we describe the situation for the day that the alert is posted. In other words, it we are writing about a speculative position, it means that it is up-to-date on the day it was posted. We are also featuring the initial target prices, so that you can decide whether keeping a position on a given day is something that is in tune with your approach (some moves are too small for medium-term traders and some might appear too big for day-traders).
Plus, you might want to read why our stop-loss orders are usually relatively far from the current price.
Please note that a full position doesn't mean using all of the capital for a given trade. You will find details on our thoughts on gold portfolio structuring in the Key Insights section on our website.
As a reminder - "initial target price" means exactly that - an "initial" one, it's not a price level at which we suggest closing positions. If this becomes the case (like it did in the previous trade) we will refer to these levels as levels of exit orders (exactly as we've done previously). Stop-loss levels, however, are naturally not "initial", but something that, in our opinion, might be entered as an order.
Since it is impossible to synchronize target prices and stop-loss levels for all the ETFs and ETNs with the main markets that we provide these levels for (gold, silver and mining stocks - the GDX ETF), the stop-loss levels and target prices for other ETNs and ETF (among other: UGLD, DGLD, USLV, DSLV, NUGT, DUST, JNUG, JDST) are provided as supplementary, and not as "final". This means that if a stop-loss or a target level is reached for any of the "additional instruments" (DGLD for instance), but not for the "main instrument" (gold in this case), we will view positions in both gold and DGLD as still open and the stop-loss for DGLD would have to be moved lower. On the other hand, if gold moves to a stop-loss level but DGLD doesn't, then we will view both positions (in gold and DGLD) as closed. In other words, since it's not possible to be 100% certain that each related instrument moves to a given level when the underlying instrument does, we can't provide levels that would be binding. The levels that we do provide are our best estimate of the levels that will correspond to the levels in the underlying assets, but it will be the underlying assets that one will need to focus on regarding the signs pointing to closing a given position or keeping it open. We might adjust the levels in the "additional instruments" without adjusting the levels in the "main instruments", which will simply mean that we have improved our estimation of these levels, not that we changed our outlook on the markets. We are already working on a tool that would update these levels on a daily basis for the most popular ETFs, ETNs and individual mining stocks.
Our preferred ways to invest in and to trade gold along with the reasoning can be found in the how to buy gold section. Additionally, our preferred ETFs and ETNs can be found in our Gold & Silver ETF Ranking.
As a reminder, Gold & Silver Trading Alerts are posted before or on each trading day (we usually post them before the opening bell, but we don't promise doing that each day). If there's anything urgent, we will send you an additional small alert before posting the main one.
Thank you.
Sincerely,
Przemyslaw Radomski, CFA
Editor-in-chief, Gold & Silver Fund Manager

