

Briefly: in our opinion, full (250% of the regular position size) speculative short positions in mining stocks are justified from the risk/reward point of view at the moment of publishing this Alert.
Practically everything that we wrote on Monday, and yesterday. remains up-to-date today. Consequently, we will quote some parts of the analysis, and we'll supplement them with additional discussion of the relative performance of various sectors, as we saw interesting details yesterday that further confirmed our earlier writings.
USDX in Focus
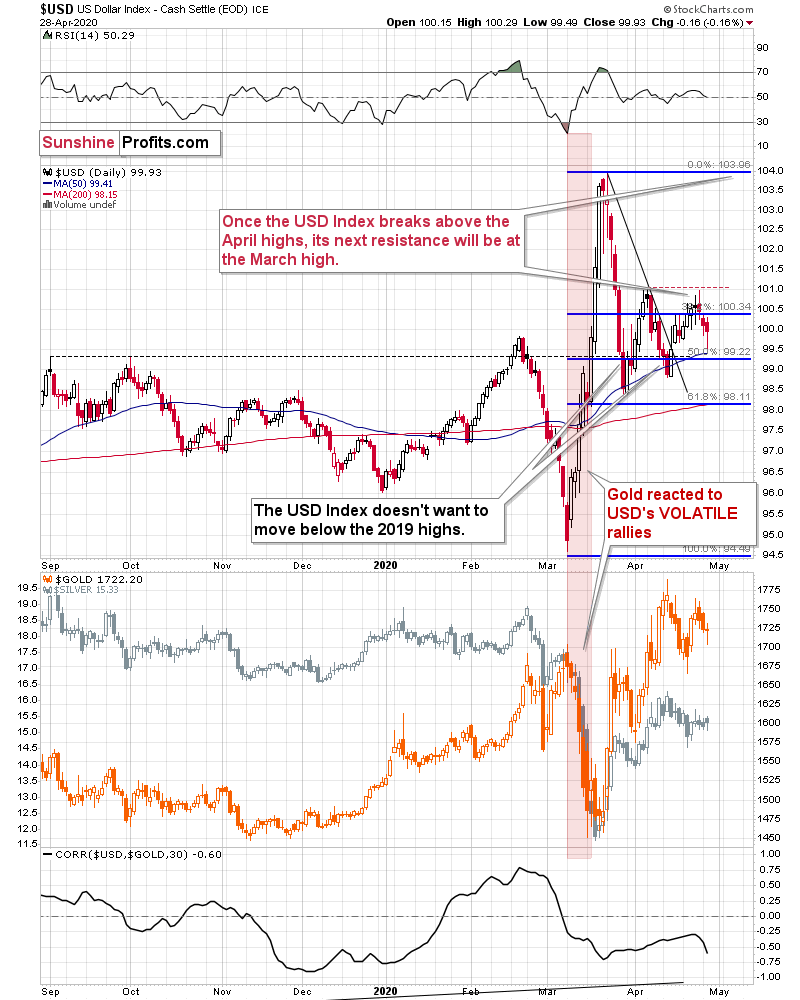
In short, the USD Index is after a huge rally and a correction. In late March, the USD Index corrected the previous rally in terms of price moves, but not in terms of time. The latter is what it seems to have been doing for the past month. The USD Index did move higher in April, but the moves were relatively boring - somewhat similar to how it rallied in January and February. And what did gold do at that time? It moved higher, and then declined at some point once it got too high too fast - practically regardless of what the USD Index was doing. That was in the final part of February.
Please check what silver did in January and February. It moved mostly higher, only to decline in the final part of the month. Overall the initial action was positive but rather nothing to call home about. Gold's rebound in early March was accompanied by rather weak action in silver.
What's happening now? Gold declined in mid-April, similar to how it declined in late February. The USD Index initially triggered the move, but then gold declined for a few days regardless of what the USDX was doing. And the rebound that we saw last week? Silver's upswing was nothing to call home about - just like what we saw in early March.
Back in March, gold's rally ended after the first clear intraday decline. Interestingly, the very first day of gold's March slide - March 9th - took place when the USD Index also declined. That daily decline, however, was actually the start of a powerful rally.
That USD Index rally was not only powerful, but it was also volatile. It was volatile not only in general, but also in terms of each individual trading day.
Guess what - Friday was the day when gold clearly declined on an intraday basis, and that was also when the USD Index declined a bit. Silver hasn't done much.
What is even more interesting is that today, gold is also declining (about $10 at the moment of writing these words) along with the decline in the USD Index (about 0.26 decline at the moment of writing these words).
Just like it wasn't clear that gold was topping in the first half of March, it's far from being clear now - at least for most market participants.
Neither we would bet the farm on the scenario in which gold topped on Thursday, but it does seem quite likely.
Once again, gold ended the day lower and so did the USD Index, confirming the indications from the previous day.
In other words, this week's price action is similar to what happened around March 9th - at least in case of the gold-USD link. There are other individual confirmations as well, but before we move to them, let's once again go through the recent performance of mining stocks. As the miners haven't really moved yesterday, our previous comments also remain unchanged.
It's true that miners declined and were the first to drop profoundly in the first half of March. However, it's also true that back then, it was the decline in the stock market that helped them plunge first. On March 9th, the general stock market was already in the full decline mode. That's not what's going on right now.
The Lessons from Stocks
Quoting our previous analysis:
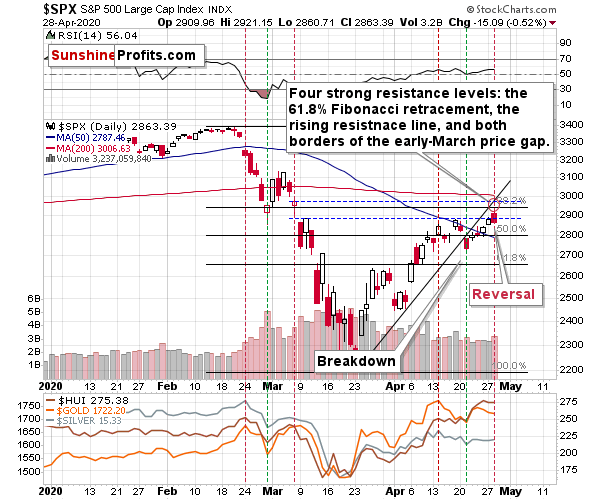
In general, the above chart shows that the S&P 500 lost its momentum and broke below the rising trend channel. It moved higher since that time, but the breakdown was not invalidated. This has bearish implications going forward. In reality, it's just a confirmation of what we wrote with regard to how the situation is developing from the fundamental point of view and how it's likely to develop in the future.
Stocks are too high given what's likely ahead as investors don't seem to realize the long-term implications of what's happening right now, still counting on the V-shaped economic recovery. The market is forward looking and once more people start to realize what's going on, the stock market is likely to fall.
You know that UBER's stock price just moved to new April high on Friday? It makes little sense given that the restrictions are likely to be in place longer, not shorter than initially expected. Instead of looking at data, investors seem to be focusing on the fact that the re-opening talks are taking place - which "seems to suggest" that re-opening the economy is somewhat close or that it would be the first step toward getting quickly to how things were before. It's not quick, and it might even require a step back first, if the second wave of the virus hits first - which seems quite likely given how the protests are taking place.
It's very likely that stocks will decline over the next several weeks, but the question is when will investors start to - massively - realize that the worst is yet to come?
The vertical dashed lines provide interesting details from the precious metals investors' and traders' point of view. Namely, they show that in late February and early March, the PMs and miners were lagging the stock market. The declines in stocks started earlier. In fact, when the first serious daily decline in the stock market took place (February 24th), the PMs and miners topped. We marked this day with the red vertical line.
Then the stock market declined, and when it bottomed, gold, silver and miners also formed a daily bottom. That was on February 28th and we marked it with a green line. What happened next is that we saw a corrective rebound, which lasted longer in case of the precious metals market than it did in case of the general stock market. Once again stocks topped first, and the precious metals market topped approximately on the day when the stock market declined quite visibly (red line - March 6th).
We're seeing something similar also this month. The initial top in stocks formed on April 14th (red line) and that was also the top in the precious metals market. Then stocks bottomed on April 21st, which was also the day when the precious metals market bottomed (more or less).
The late-February - early March performance seems to be repeating.
The difference is in the performance of the mining stocks, which used to lag, and now they leap gold and the general stock market. What gives? Well, during the analogous period in March (around March 6th), stocks moved higher, but they didn't even manage to correct half of the decline from the February high. Right now, the stock market (taking the overnight futures into account) is slightly above the April 14th high. Mining stocks, being more correlated with the general stock market are moving higher relative to gold as they take their strength from the general stock market. Moreover, if the general stock market is about to top shortly, it's quite likely to expect the previously worst performing stocks, to shine now (that's what tends to happen at the market tops).
All the above suggests that the general stock market is likely to top any day now, and when the first sizable daily slide takes place, we'll have a good indication that the next huge decline in the precious metals market is about to start or that it has just started.
When could that take place? Quite possibly as early as this week. Please note that the spacing between the horizontal lines that we saw in late February and early March was approximately symmetrical. Plus, they were about a week apart.
Based on the above symmetry and the week analogy (which remains intact as the initial top and the most recent bottom were exactly one week apart) it seems that the next top or the significant daily slide could take place tomorrow - on Tuesday. Of course, there's no guarantee that it would happen, but it does seem quite likely.
This means that the next local top in the precious metals sector - including the mining stocks - might be at hand, quite possibly today or tomorrow.
The first sizable decline in the stock market will serve as an indication and the sizable daily decline in gold, silver, and mining stocks that follows - likely on the next day - will serve as a confirmation.
Given the price level to which stocks rallied yesterday and the proximity of a combination of very strong resistance levels it seems that they will move even higher before topping. It still seems relatively likely that it will happen this week - perhaps today or tomorrow.
The strong resistance levels are: the 61.8% Fibonacci retracement, the rising resistance line, and the upper border of the early-March price gap. There's also the 200-day moving average.
It turned out that the stock market was even weaker than we thought. Stocks failed to close above even the lowest of the nearby resistance levels - the March 10th closing price. On an intraday basis, stocks attempted to rally, but reversed as soon as they touched the lower border of our target area.
While we didn't see a major decline in terms of the daily closing prices, we did see a notable move lower in intraday terms. Since it took place on relatively (!) high volume (highest in more than a week), it could be the case that we just saw the final top.
While the analogy to the previously marked (vertical dashed lines) patterns in stocks (decline, bottom, decline) is not clear (we saw top, bottom, perhaps-a-top), the analogy seems to be intact in case of the precious metals sector. At the second red line in March, silver was more or less doing nothing, gold was topping in a dome-shaped pattern, while miners just moved slightly lower after a rally. The same seems to be the case right now.
Of course, on a very short-term basis anything can happen on the stock market, but it seems that the implications for the precious metals market are already bearish.
Is it any wonder that in this environment mining stocks were not leading gold and silver lower? Absolutely not. But the above is also a reason to expect miners to slide with vengeance once stocks finally do decline.
Gold futures point to a situation in which the most recent April high was well below the mid-April high.
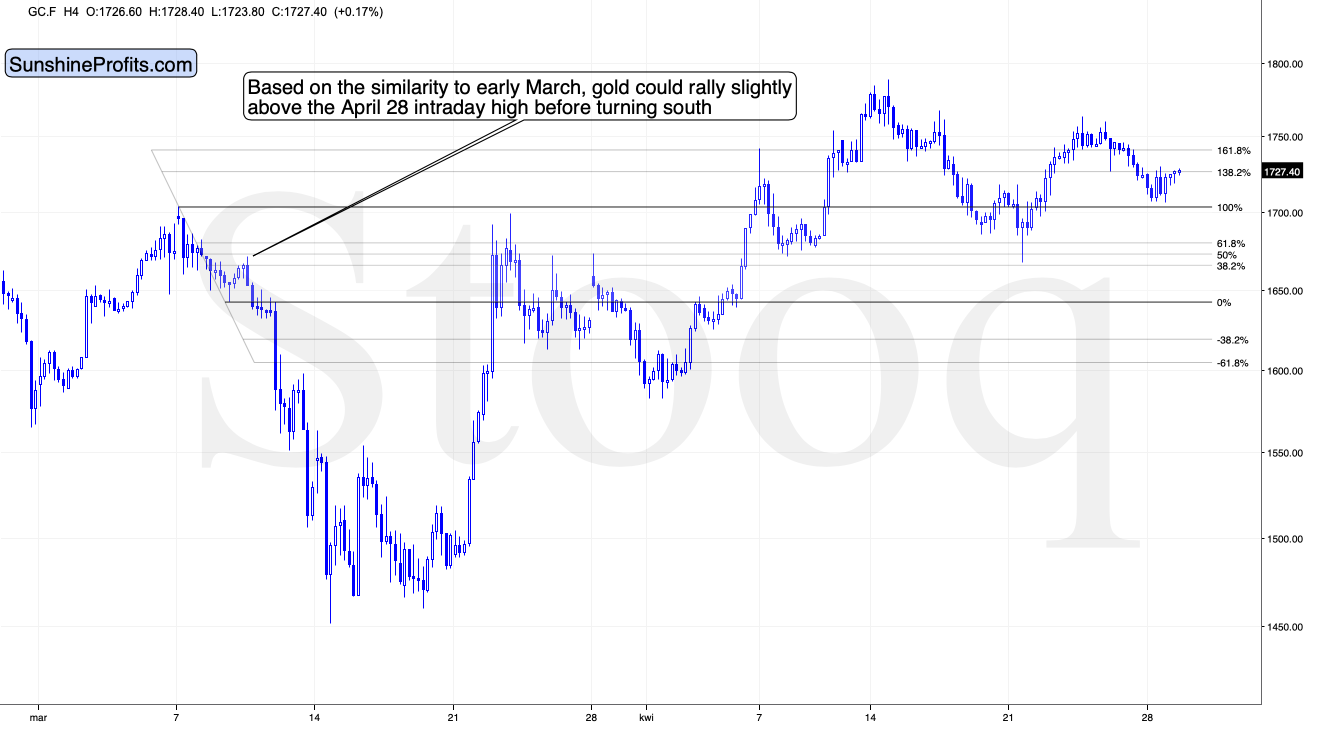
However, in case of the GLD ETF those highs are relatively similar. And actually, taking daily closes into account, we saw a new high just a few days ago.
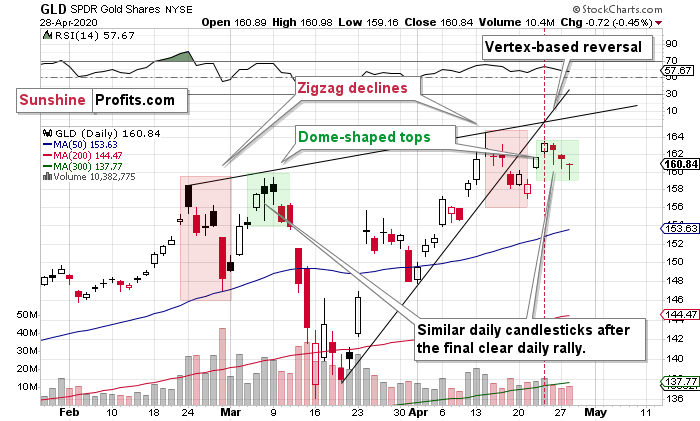
This makes that situation even more similar to what happened in early March. Back then, the GLD ETF also made a new high in terms of the closing prices... And it was the final time to exit any remaining long positions and enter short ones.
Please note that the double-top itself is not the only similar thing. The shape of the decline from the first top (zigzag marked with red) and the shape of the second top (dome) also confirm the similarity.
This, plus the fact that based on the last few days, it seems that gold topped right at its vertex-based reversal, makes the outlook very bearish.
Silver in the Spotlight
Meanwhile, silver is acting exactly as we outlined yesterday:
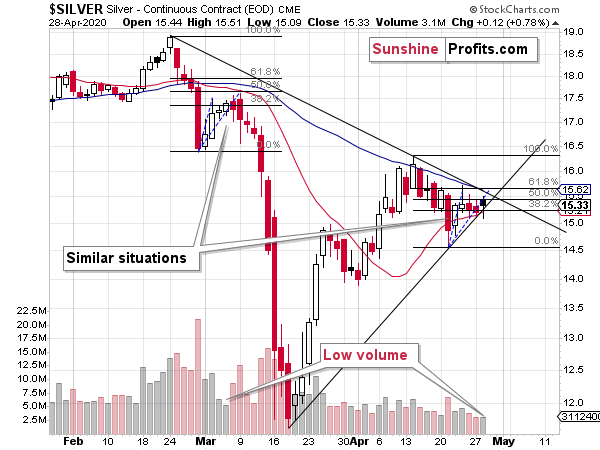
On the short-term note, we see that silver is more or less repeating its early-March performance. The price moves are not identical in terms of the Fibonacci retracement levels, but comparing the size and shape of the initial rallies (blue dashed lines) we get almost identical results. After rallying sharply initially, silver started to do... pretty much nothing. That was the same in early March. It was after a few additional days, when silver's corrective upswing had really ended, and the big slide started.
If the similarity to the early-March continues, we can expect the decline to start on Wednesday or very close to it. Please note that silver's first few days of the decline were noticeable, but not huge. However, once silver broke below its previous lows, it took only three sessions for the white metal to slide below $12. Let's keep in mind that previously silver started from higher price levels.
The implications are bearish for the following few weeks and rather neutral for the next few days.
Silver declined below $15 in yesterday's pre-market trading and it seems to be analogical to what it did on March 9 - declining profoundly before the US markets open and then coming back only to level off in the next 2 days.
Please note that back in March, the day when silver declined was accompanied by high volume and yesterday's session wasn't. This might seem like an invalidation of the analogy, but it really isn't. The reason is that ultimately silver ended yesterday's session higher, while it ended the March 9th session lower. This means that in a way, lower volume now than on March 9th is normal and bearish.
While both situations are not identical, history does seem to be rhyming.
Let's look at silver from the ETF point of view. After all, at times comparing signals generated during only the US trading hours could be even more informative than the signals coming from the futures market.
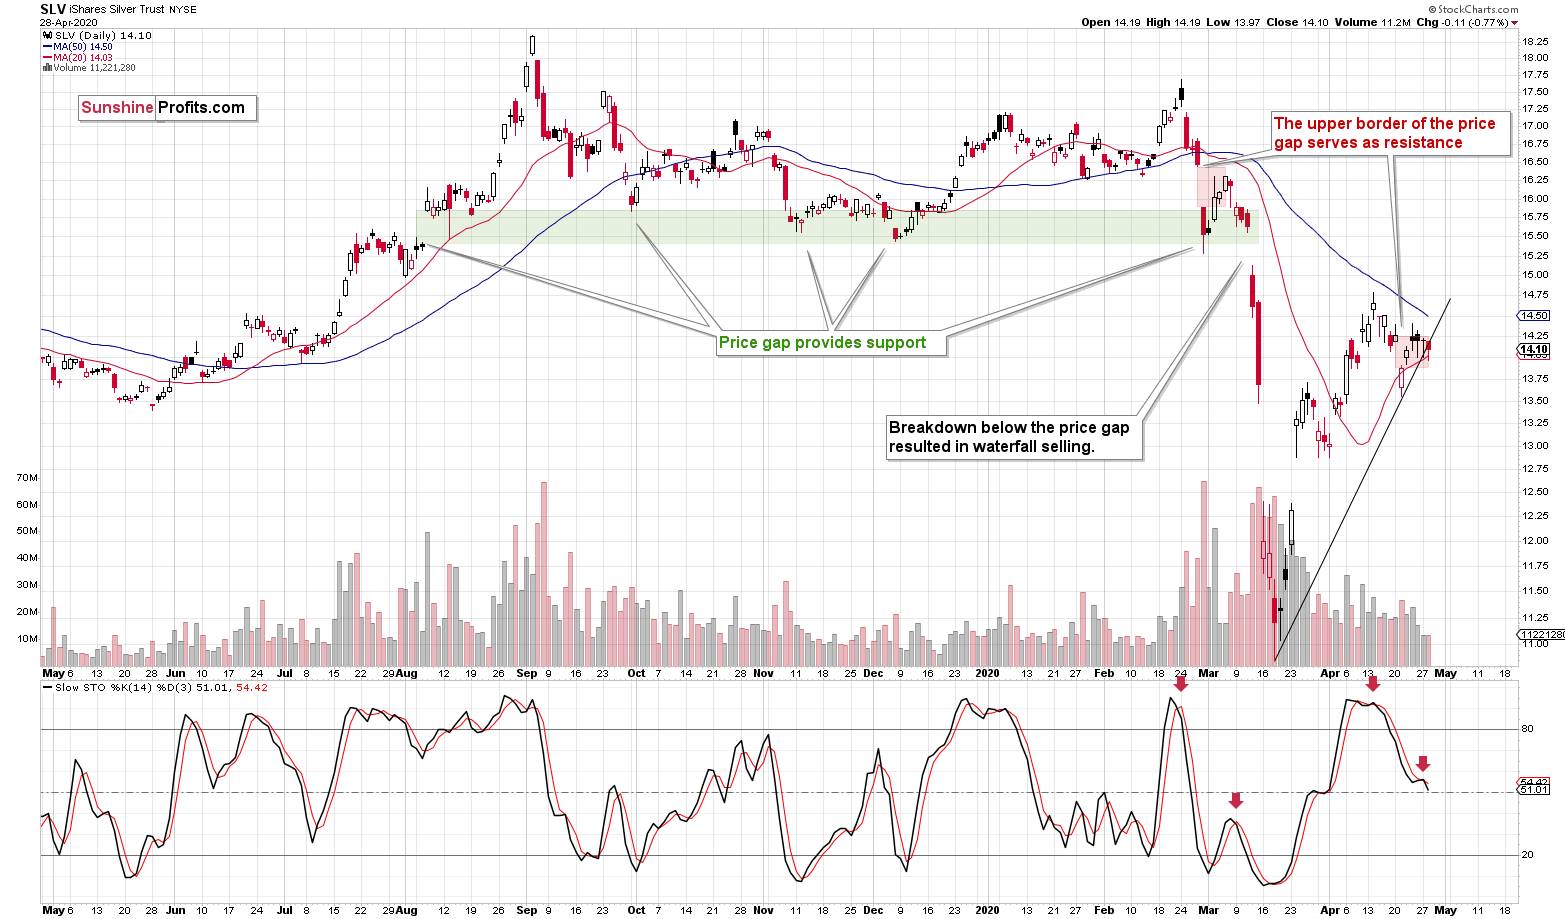
The important details that SLV show clearly that silver futures don't, are the price gaps and the volume levels.
The volume in the SLV ETF is now very low. It was relatively low also during the early-March correction and it was the calm before the storm. By itself, it wouldn't mean much, but since it's just one of the factors pointing to similarity between early March and the current situation, it's worth paying attention to it.
The price gaps are also important. The green rectangle shows just how important they can be. The price gap that formed in early August 2019 served as support several times. It was so important that when it was finally broken in March, the waterfall selling followed.
At this time, we also have a price gap in play, but it works in a different way. Namely, it's based on the Apr 20-21 price gap, and its upper border serves as resistance. This is important, because during the early-March correction, the upper border of the recent (Feb 27-28) price gap also served as resistance. This makes the two situations even more similar.
And what about the miners? Once again, the situation is just as we've described it yesterday.
Mining Stocks
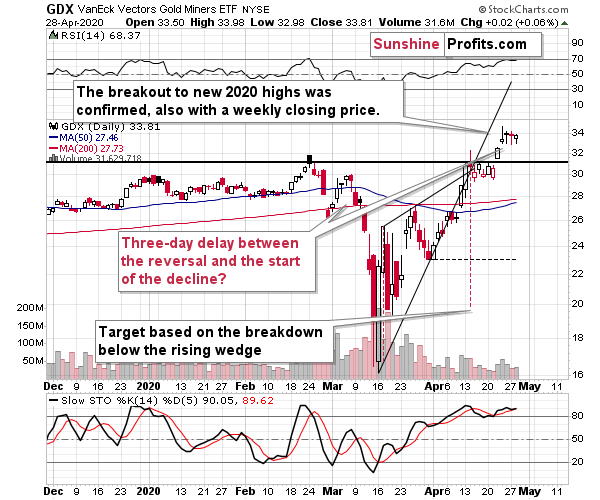
The GDX ETF managed to break above the previous 2020 highs and confirm this breakout in terms of three consecutive daily closes, and a weekly close. The above chart is now bullish for the mining stocks.
However, given how close the powerful long-term resistance [the 2016 top in the HUI Index] is, and what's likely ahead for the GLD ETF and the general stock market, we doubt that this breakout would be able to generate anything more than a 1-2 day upswing.
It seems that those who are more short-term oriented (or the more advanced traders) might want to limit their exposure to the mining stocks or the precious metals sector until the situation clarifies, while those who aren't might prefer to keep the short positions intact as it seems that within the next 1-3 weeks, gold miners will be much (!) lower.
Please note that in the first half of March, after the profound big-volume intraday reversal, there were three days after which GDX was trading relatively close to the intraday high. It was only after that time that the decline picked up. Well, we saw a relatively-big-volume intraday reversal on April 23rd and yesterday's close was the third close after that day. If history is to repeat to the letter, we should see a bigger decline in the miners today. If it is to only rhyme, we might see it tomorrow or on Friday.
Let's keep in mind that today is the Fed's interest rate decision (and the press conference), and tomorrow we get the analogous news from the ECB, which could trigger volatile moves.
Finally, before summarizing, we would like to reply to questions that we received recently.
From the Readers' Mailbag
Q: Assuming we hit ~$1600 in the next week or so, how long do you expect the dead-cat bounce to last? It was only 3 or 4 trading days in 2008...how long might it be in 2020? And once the final decline begins in earnest, how long can we expect that drop to take? I realize these are moving targets that develop organically, but any insight you can add would be very helpful.
A: Unfortunately, it's relatively unclear. The 2008 - 2020 link got distorted so it doesn't seem that we can make very precise predictions based on it. On one hand, it could be between a few hours and 3 days, similar to what happened in 2008, but it could also take a week or so, because of the decline in volatility that we saw recently (likely because of the lower upswing in the general stock market). In general, unless we see PMs clear strength in light of the developments in the USD Index, it's unlikely that we'll adjust our outlook during the correction.
Summary
Summing up, the outlook for the precious metals market remains bearish for the next few weeks, even though the next few days are relatively unclear. The general stock market appears to be ready to top this week and given that gold is declining along with the USD Index so far this week, it seems that the next big move lower in the entire precious metals sector is just around the corner.
The recent strength in the mining stocks doesn't seem to fit the bearish narrative, especially since the miners just confirmed their breakout above the previous 2020 high. Still, the flagship proxy for the gold stocks - the HUI Index - is almost right at its 2016 high, which provides a strong resistance, and the relative strength of the general stock market (which likely contributed to rising prices of miners) is likely close to being over.
Thus, it seems likely that we'll see the initial part of the next big mover lower later this week.
After the sell-off (that takes gold below $1,400), we expect the precious metals to rally significantly. The final decline might take as little as 1-3 weeks, so it's important to stay alert to any changes.
Most importantly - stay healthy and safe. We made a lot of money on the March decline and the subsequent rebound (it's initial part) price moves (and we'll likely make much more in the following weeks and months), but you have to be healthy to really enjoy the results.
By the way, we recently opened a possibility to extend one's subscription for a year with a 10% discount in the yearly subscription fee (the profits that you took have probably covered decades of subscription fees...). It also applies to our All-Inclusive Package (if you didn't know - we just made huge gains shorting crude oil and are also making money on both the decline and temporary rebound in stocks). The boring time in the PMs is over and the time to pay close attention to the market is here - it might be a good idea to secure more access while saving 10% at the same time.
Important: If your subscription got renewed recently, but you'd like to secure more access at a discount - please let us know, we'll make sure that the discount applies right away, while it's still active. Moreover, please note that you can secure more access than a year - if you secured a yearly access, and add more years to your subscription, each following year will be rewarded with an additional 10% discount (20% discount total). We would apply this discount manually - please contact us for details.
Secure more access at a discount.
As always, we'll keep you - our subscribers - informed.
To summarize:
Trading capital (supplementary part of the portfolio; our opinion): Full speculative short positions (250% of the full position) in mining stocks is justified from the risk to reward point of view with the following binding exit profit-take price levels:
Senior mining stocks (price levels for the GDX ETF): binding profit-take exit price: $10.32; stop-loss: none (the volatility is too big to justify a SL order in case of this particular trade); binding profit-take level for the DUST ETF: $231.75; stop-loss for the DUST ETF: none (the volatility is too big to justify a SL order in case of this particular trade)
Junior mining stocks (price levels for the GDXJ ETF): binding profit-take exit price: $9.57; stop-loss: none (the volatility is too big to justify a SL order in case of this particular trade); binding profit-take level for the JDST ETF: $284.25; stop-loss for the JDST ETF: none (the volatility is too big to justify a SL order in case of this particular trade)
For-your-information targets (our opinion; we continue to think that mining stocks are the preferred way of taking advantage of the upcoming price move, but if for whatever reason one wants / has to use silver or gold for this trade, we are providing the details anyway. In our view, silver has greater potential than gold does):
Silver futures downside profit-take exit price: $8.58 (the downside potential for silver is significant, but likely not as big as the one in the mining stocks)
Gold futures downside profit-take exit price: $1,382 (the target for gold is least clear; it might drop to even $1,170 or so; the downside potential for gold is significant, but likely not as big as the one in the mining stocks or silver)
Long-term capital (core part of the portfolio; our opinion): No positions (in other words: cash)
Insurance capital (core part of the portfolio; our opinion): Full position
Whether you already subscribed or not, we encourage you to find out how to make the most of our alerts and read our replies to the most common alert-and-gold-trading-related-questions.
Please note that the in the trading section we describe the situation for the day that the alert is posted. In other words, it we are writing about a speculative position, it means that it is up-to-date on the day it was posted. We are also featuring the initial target prices, so that you can decide whether keeping a position on a given day is something that is in tune with your approach (some moves are too small for medium-term traders and some might appear too big for day-traders).
Plus, you might want to read why our stop-loss orders are usually relatively far from the current price.
Please note that a full position doesn't mean using all of the capital for a given trade. You will find details on our thoughts on gold portfolio structuring in the Key Insights section on our website.
As a reminder - "initial target price" means exactly that - an "initial" one, it's not a price level at which we suggest closing positions. If this becomes the case (like it did in the previous trade) we will refer to these levels as levels of exit orders (exactly as we've done previously). Stop-loss levels, however, are naturally not "initial", but something that, in our opinion, might be entered as an order.
Since it is impossible to synchronize target prices and stop-loss levels for all the ETFs and ETNs with the main markets that we provide these levels for (gold, silver and mining stocks - the GDX ETF), the stop-loss levels and target prices for other ETNs and ETF (among other: UGLD, DGLD, USLV, DSLV, NUGT, DUST, JNUG, JDST) are provided as supplementary, and not as "final". This means that if a stop-loss or a target level is reached for any of the "additional instruments" (DGLD for instance), but not for the "main instrument" (gold in this case), we will view positions in both gold and DGLD as still open and the stop-loss for DGLD would have to be moved lower. On the other hand, if gold moves to a stop-loss level but DGLD doesn't, then we will view both positions (in gold and DGLD) as closed. In other words, since it's not possible to be 100% certain that each related instrument moves to a given level when the underlying instrument does, we can't provide levels that would be binding. The levels that we do provide are our best estimate of the levels that will correspond to the levels in the underlying assets, but it will be the underlying assets that one will need to focus on regarding the signs pointing to closing a given position or keeping it open. We might adjust the levels in the "additional instruments" without adjusting the levels in the "main instruments", which will simply mean that we have improved our estimation of these levels, not that we changed our outlook on the markets. We are already working on a tool that would update these levels on a daily basis for the most popular ETFs, ETNs and individual mining stocks.
Our preferred ways to invest in and to trade gold along with the reasoning can be found in the how to buy gold section. Additionally, our preferred ETFs and ETNs can be found in our Gold & Silver ETF Ranking.
As a reminder, Gold & Silver Trading Alerts are posted before or on each trading day (we usually post them before the opening bell, but we don't promise doing that each day). If there's anything urgent, we will send you an additional small alert before posting the main one.
Thank you.
Sincerely,
Przemyslaw Radomski, CFA
Editor-in-chief, Gold & Silver Fund Manager

