

Briefly: in our opinion, full (300% of the regular position size) speculative short positions in mining stocks are justified from the risk/reward point of view at the moment of publishing this Alert.
Evergrande. The topic everyone requested me to cover, so I will. But before I do, I would like to emphasize that I’ve been writing about it for months. No, not about Evergrande per se, but about the situation being similar to 2008. The exact trigger and the name of the company are not really relevant. What is important is that the storm has been brewing for some time, and now, when we finally see the straw that broke the camel’s neck, it seems like a game-changer. But it’s not a game-changer. It’s a milestone telling us that the game is going very similarly to how it was played 13 years ago (in 2008).
Can the markets repeat both previous patterns at the same time (2008 and 2013)? Sure, why not. The history doesn’t repeat itself to the letter, it rhymes instead. And the current rhyme is somewhat similar to both previous situations.
Previously, gold and gold stocks have been quite clear with the repeat of their respective 2011-2013 price actions. The USD Index is moving steadily (with corrections) higher this year, also similarly to what we saw then.
However, if the general stock market is about to plunge, then we might lean more toward its 2008 counterpart, as that was the key thing on the charts at that time (as far as the main markets are concerned). The USD Index soared at that time, which might happen this time as well. But the most important implication from the point of view of a precious metals investor and trader is the dramatic slide in mining stocks and in silver that we saw in 2008. Yes, I’ve been repeating that these two parts of the precious metals sector were likely to fall the most (perhaps miners first, silver a bit later – a’la 2020), but what we’re seeing now in the general stock market and what kind of news accompanies it (major bankruptcy threat related to the real estate market) has 2008 written all over it.
The Plunge Protection Team
And yet, there is one thing I haven’t considered previously that hit me today regarding Evergrande. There is something different this time that makes the declines in stocks and the precious metals sector (especially silver, gold stocks, and silver stocks) even more likely.
One might say that the thing that prevented the stock market from declining was the rising dashed line. Or the 50-day moving average. And they have likely indeed played an important part on a technical level. But the thing that really prevented the stock market from declining was… the issue of blame.
You know, it’s not rocket science that the stock markets are overheated. There are myriads of indicators pointing to the overbought status, and I’ve been featuring them for months. Furthermore, the authorities know that.
Earlier this year, the largest U.S. banks had to prove that they would be able to withstand a 55% crash in the stock market. Interesting, right? Of course, one could say that it was just a normal precautionary test, irrelevant to the authorities knowing that stocks will need to crash eventually.
If the Powers That Be know that stocks have to crash and that banks can take it, then it’s safe to let the markets do their thing, right?
Wrong. People might put the blame on those Powers, and the Powers wouldn’t like that, as they like votes, power, money, and such. Blame doesn’t go well with those.
So, if there is indeed the “Plunge Protection Team” that’s been actively working on keeping the stock market afloat until it’s obvious that the blame can be placed somewhere else, ideally on a political adversary, then they just had their dreams fulfilled.
The Evergrande Group – a Chinese real estate developer – is a perfect scapegoat here. Of course, the real reason that the stock markets got too high practically all over the world is caused by excessive money printing / stimulus of all kinds. But from the political point of view, it can now be narrated to be someone else’s fault.
“Yes, folks, it’s very unfortunate that you lost your retirement money, and your kids will have trouble finding jobs in this stagflation… But it’s all because of China! We did all we could, but they caused all this – we couldn’t prevent it despite all our best efforts. Good luck to you and vote for us again so that we may fight for your rights and your financial safety on your behalf!”
Or something along those lines. That’s what the narrative might be once the stock markets crash globally and once the real-life implications kick in.
I’m not sure if anyone already called it “the Chinese crisis”, but if not, please mark it in your calendars that I’m forecasting today (Sep. 21, 2021) that this name will emerge sooner or later. Also, please keep in mind that months ago, I wrote that bitcoin was topping (at least in the medium term) at about $50,000. It then moved higher somewhat, but overall, it seems that we’re seeing a broad top in this market. The rising USDX is unlikely to help it, either way.
Also, please don’t get me wrong. I’m not “cheering for China” here, defending China, etc. In fact, I’m not cheering at all. I’m just analyzing the situation as realistically (perhaps even “brutally”) as I can, and I’m reporting my findings to you, along with discussing the implications for the precious metals sector.
And the implications for the precious metals sector of the above are very bearish.
Where Are the Metals Headed?
Now, on a short-term basis, the reactions might be relatively chaotic, as on one hand, the situation getting out of hand might trigger safe-haven buying for gold, and on the other hand, it might trigger safe-haven buying for the USD Index. This might trigger quite many erratic price swings in the short run.
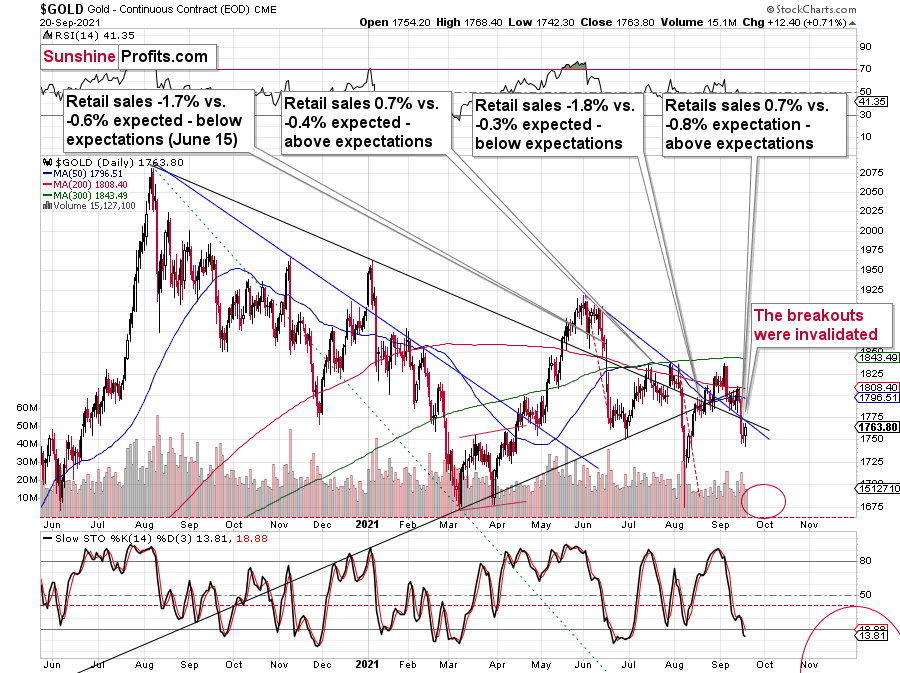
Gold moved higher by $12 yesterday, but this move seems to have just been a breather after a powerful daily decline.
Why? Because gold miners are confirming their breakdown and they completely ignored gold’s rally, for instance.
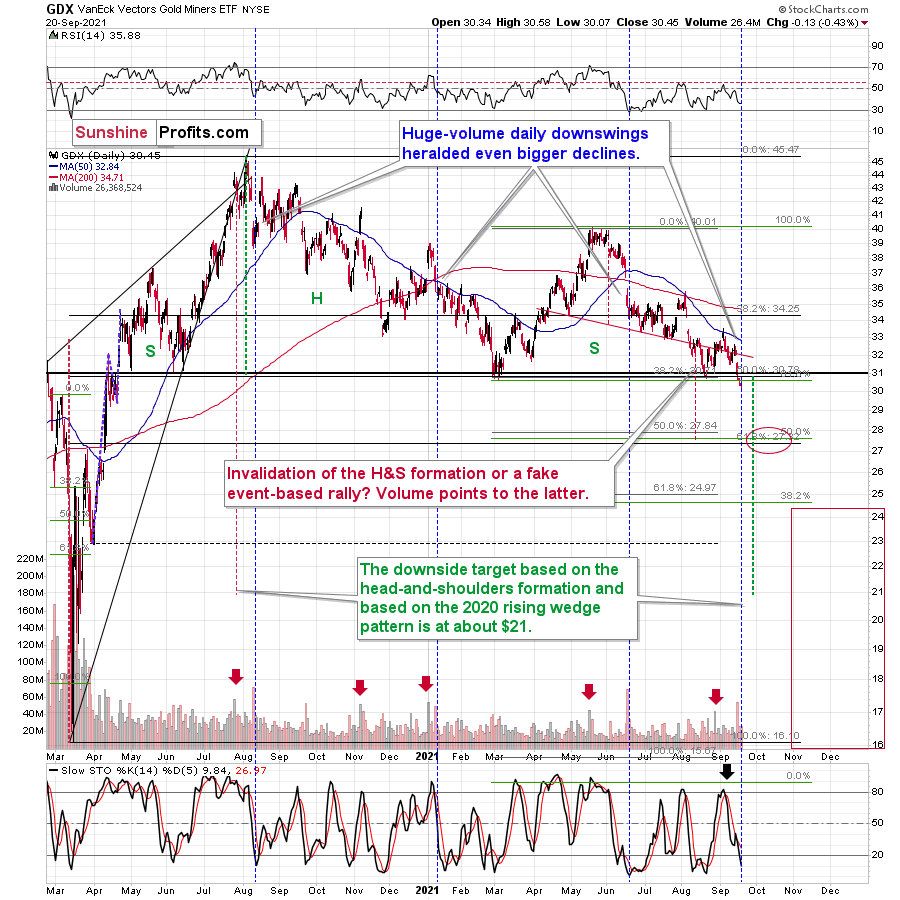
The GDX ETF closed below the previous 2021 lows for the second consecutive trading day. If we get a daily close below these lows today, the breakdown will be fully confirmed, and the road to new lows will be fully open.
Just as I wrote previously, the outlook for the precious metals market remains extremely bearish for the next several months.
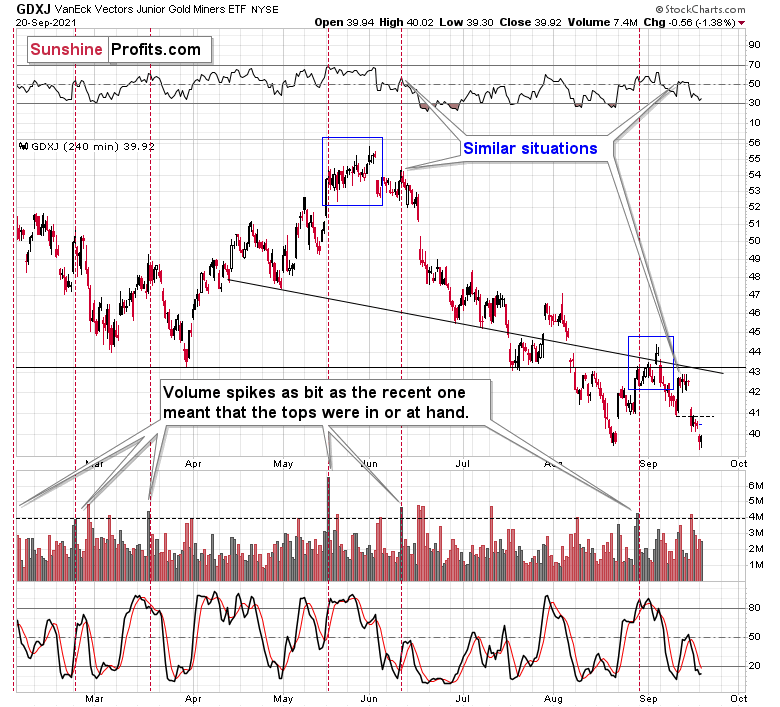
Junior miners moved lower yesterday, catching up with the GDX’s decline. The GDXJ didn’t close below the August lows yet, but it’s very close to them. The outlook for the junior mining stocks remains very bearish, especially given the likely declines in the general stock market. Remember how profoundly juniors plunged in 2020 when the general stock market declined? In my view, we’ll likely see something similar also this time.
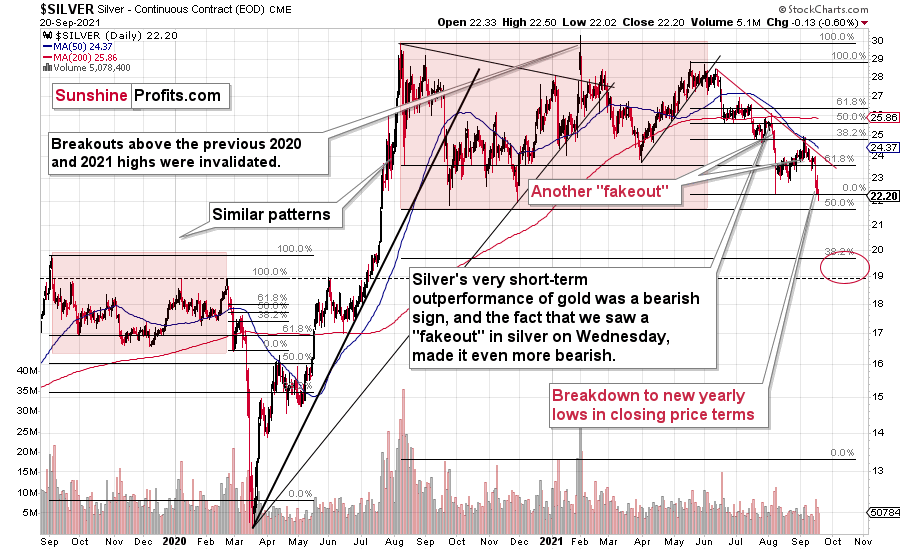
In yesterday’s analysis, I wrote that silver moved to a new yearly low in terms of the daily closing prices. This move was confirmed, and the bearish outlook was emphasized by the move to new intraday 2021 lows. The losses of those who purchased silver close to its yearly top are now very significant. And it’s going to get worse, as silver is likely to decline more – likely much more – before it rallies back up.
The USD Index suggests caution in the very short term, as it reversed before the end of yesterday’s session, and it did so after moving to its March highs.
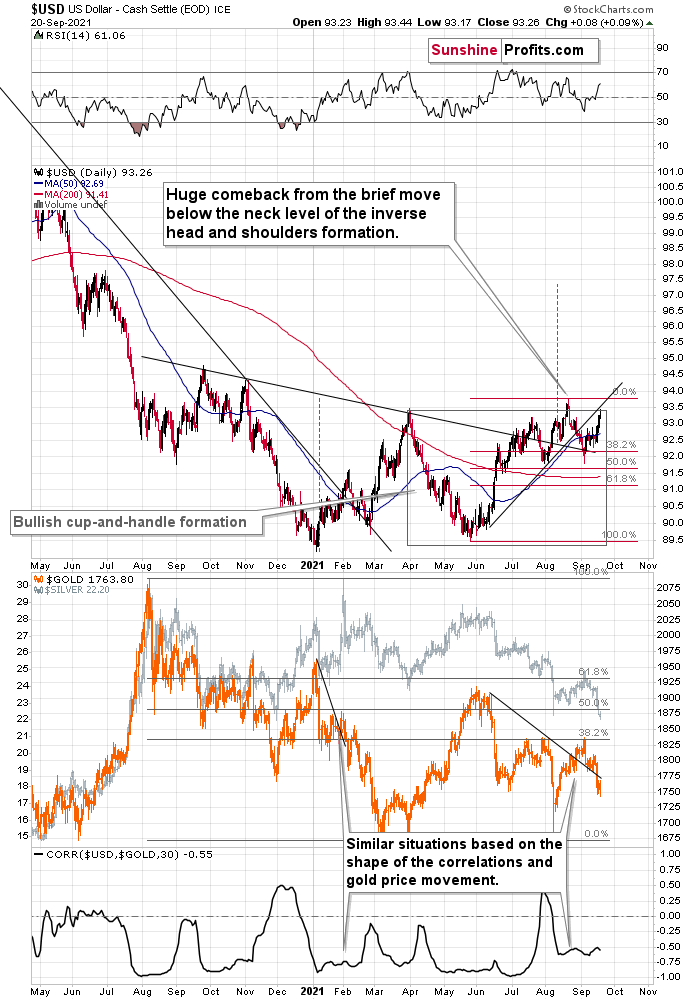
Indeed, the USD Index is declining in today’s pre-market trading. But does it change much? It doesn’t. Even if the USD Index declines a bit here (and PMs move a bit higher), it’s still likely to soar soon (and PMs are likely to plunge soon).
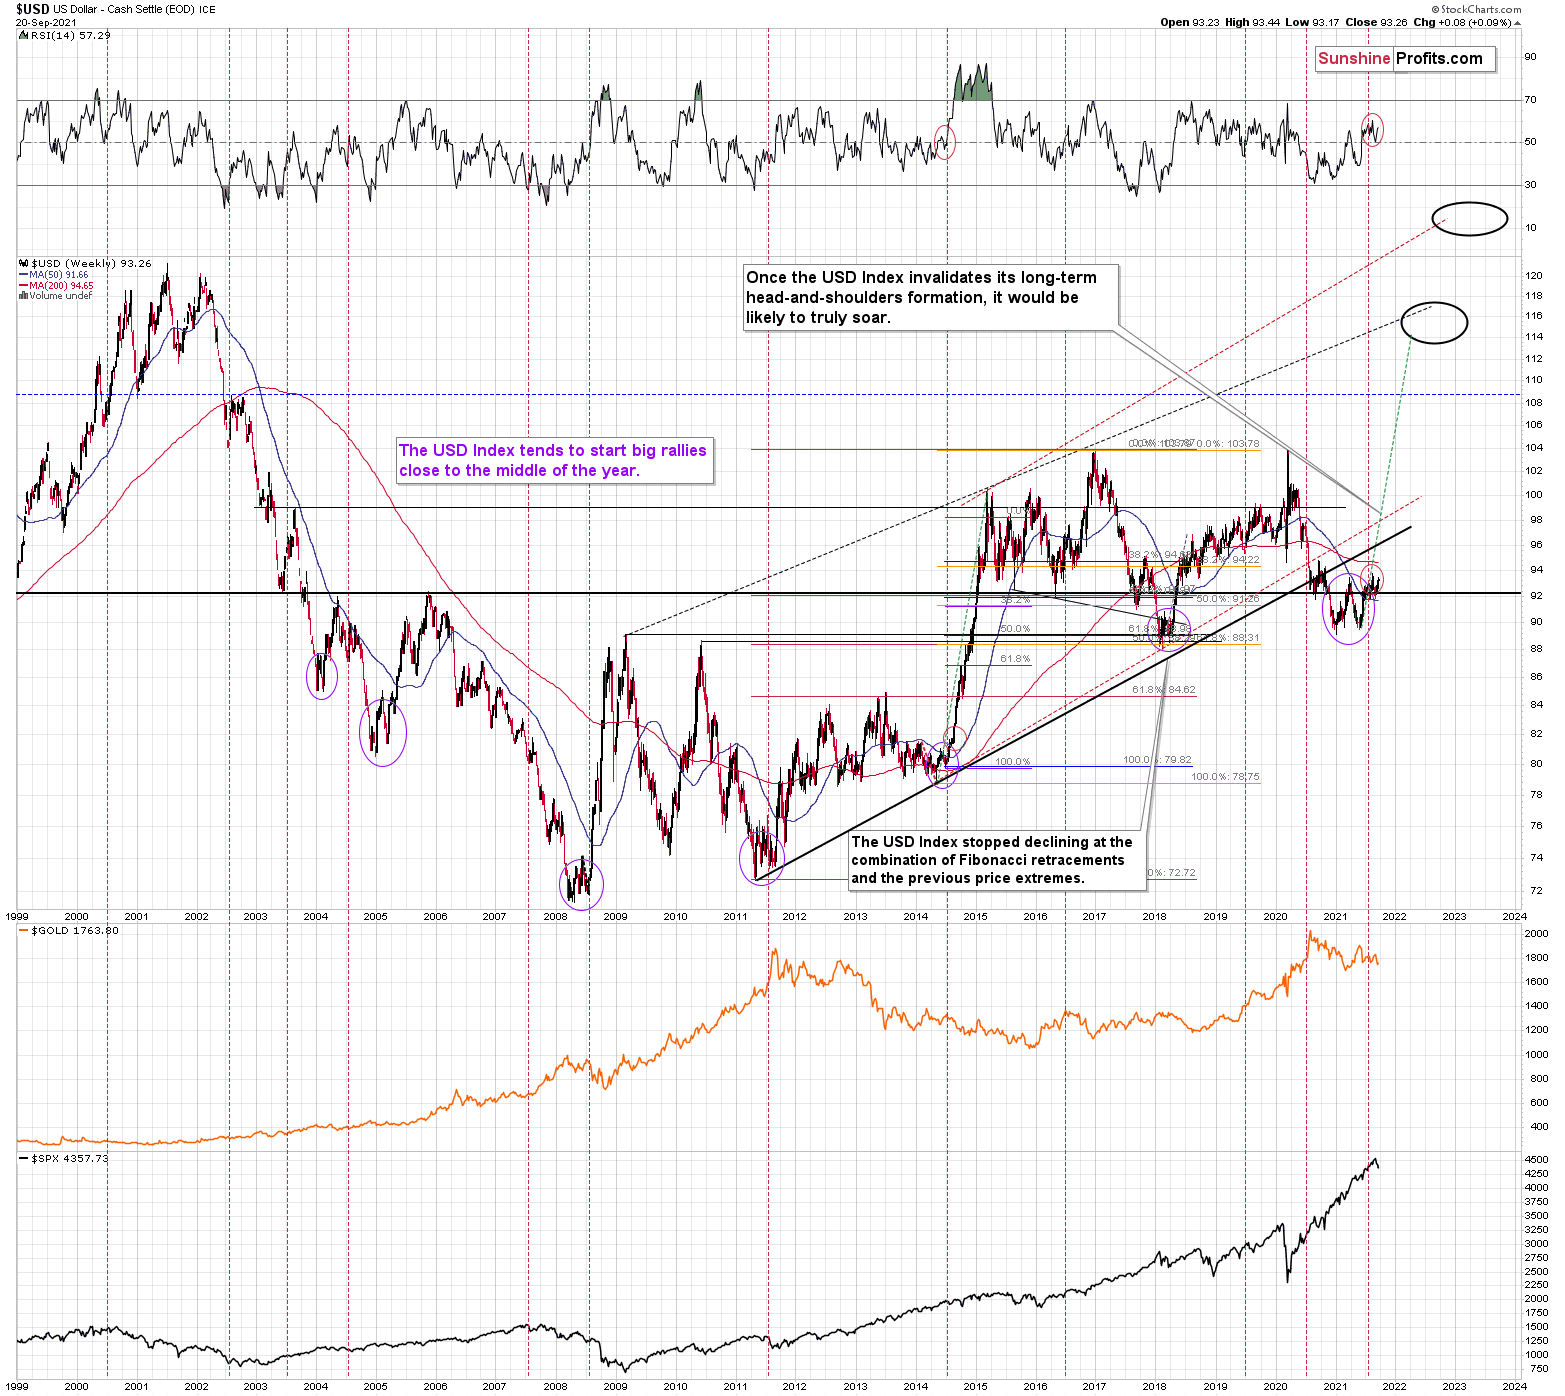
The long-term USD Index chart and the analogy to its previous performance after mid-year bottoms continue to have bullish implications for the medium term. In particular, the analogies to 2014 and 2008 are particularly bullish.
Having said that, let’s take a look at the precious metals sector from a more fundamental point of view.
The Gray Rhino (Part 2)
After Guo Shuqing, Chairman of the China Banking and Insurance Regulatory Commission, labeled China’s property market the “gray rhino” on Mar. 2, he warned of forthcoming calamities.
I wrote on Mar. 3:
The regulator told reporters that “we are really afraid the bubble for foreign financial assets will burst someday.” Also referring to China’s property bubble as the “gray rhino” – a highly probable, high impact, yet neglected threat – Shuqing added that “many people buy homes not to live in, but to invest or speculate. This is very dangerous.”
Well, fast forward roughly seven months, and the chickens have come home to roost. And with Evergrande – a Chinese property developer with more than $300 billion in liabilities – on the brink of bankruptcy, the mood music across the financial markets has turned increasingly somber.
To explain, the embattled entity elicits flashbacks of Lehman Brothers’ collapse in 2008. And while Chinese regulators will attempt to contain the damage, risks to Chinese GDP growth remain elevated. The Chinese economy was already slowing before the “gray rhino” appeared, and the situation puts Beijing in a bind:
- If the government bails out Evergrande, it will only add to the dislocations plaguing the Chinese property market.
- If the government doesn’t bail out Evergrande, liquidity could dry up and the contagion could spread across other areas of the Chinese economy.
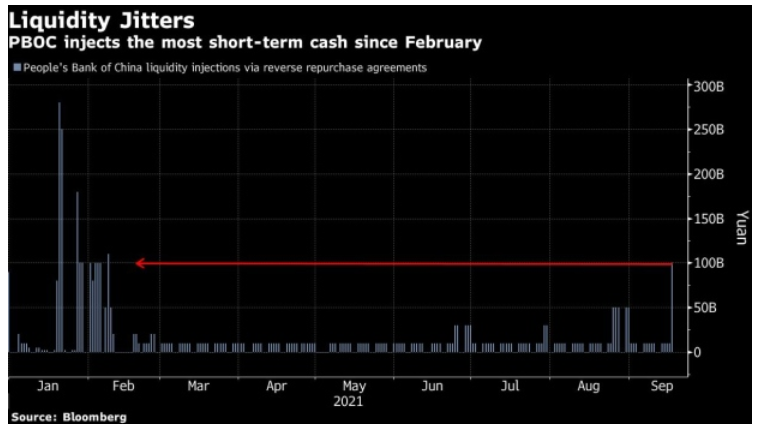
Beginning with the former, the People’s Bank of China (PBOC) injected $13.9 billion in liquidity on Sep. 17 to help calm investors’ nerves.
Please see below:
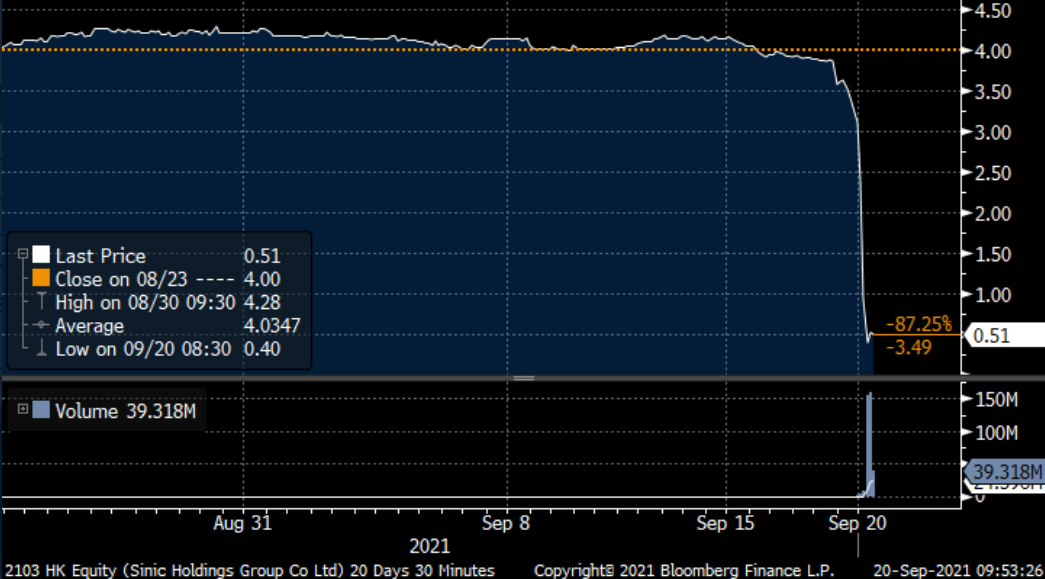
However, with Chinese authorities informing creditors that Evergrande will not make its interest payments on Sep. 24, option #2 is already intensifying. Case in point: with skittish investors shooting first and asking questions later, Chinese property developer Sinic had its stock halted on Sep. 20, and its shares have plunged by more than 87% over the last few days.
Please see below:
Spillover on the Junk Bond Market
Likewise, with fear spreading across China’s junk bond market, interest rates have surged and surpassed the highs set during the peak of the coronavirus crisis. For context, junk bonds have an embedded ‘credit spread’ that represents an additional interest rate in excess of the ‘risk-free rate’ (the interest rate on a sovereign bond of similar maturity) that compensates investors for the perceived risk. When credit spreads are rising, it means that investors fear potential defaults and, therefore, demand higher compensation to incur the risk.
Please see below:
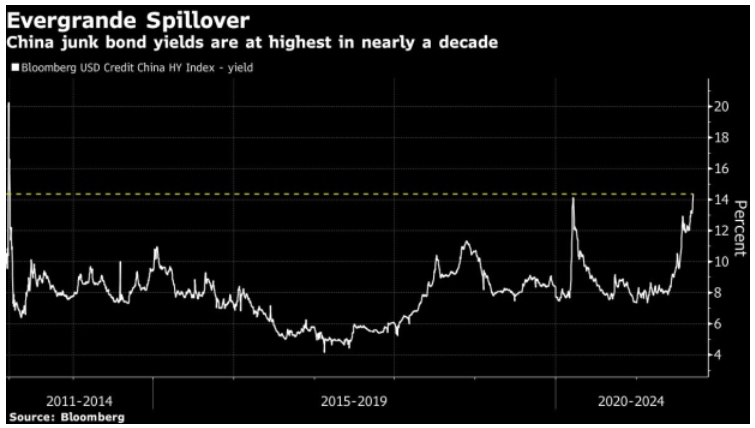
To explain, the white line above tracks the yield on China’s junk bond index. If you analyze the right side of the chart, you can see that interest rates are at a ~10-year high. Moreover, the surge only accelerates China’s problem, as other companies will find it challenging to access credit and the liquidity crunch could make refinancing existing debt extremely difficult.
If that wasn’t enough, China’s 5-year credit default swap (CDS) rate has also gone vertical. For context, the CDS allows buyers to hedge (or speculate on) a ‘credit event’ should an underlying company fail to meet its obligations. Analogous to insurance, it essentially protects the buyer when a default occurs. Moreover, with CDS sellers only earning the swap rate (the interest rate that compensates the seller for providing the insurance), surging swap rates are indicative of major financial stress.
Please see below:
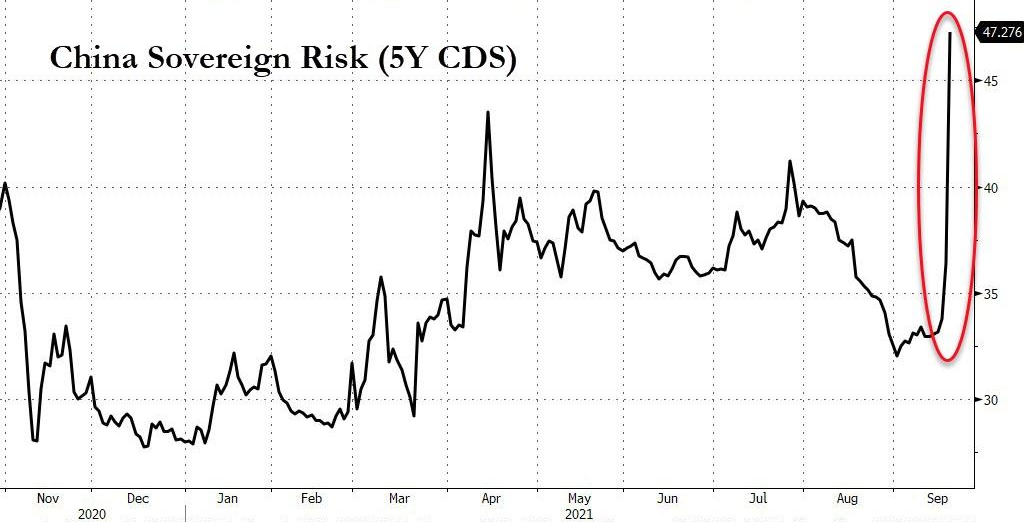 Source: Bloomberg/ZeroHedge
Will the Government Step In?
Moreover, as the drama unfolds, Goldman Sachs believes that the upheaval likely suggests “that housing activity may deteriorate further in the absence of the government providing a clear path toward an eventual resolution for Evergrande.” For context, real estate accounts for roughly 70% of Chinese household wealth, and thus, the property market is viewed by Chinese officials the same way the stock market is viewed by the Fed.
However, Goldman Sachs suggests that the damage should be contained if Chinese officials demonstrate political will. The investment bank told its clients:
“As our credit strategy team points out, Evergrande is large (total assets of RMB2tn, or 2% of China’s GDP) and complex (with over 200 offshore and nearly 2000 onshore wholly and non-wholly owned subsidiaries). Nonetheless, it accounts for only 4% of China’s total property sales and its 123,000 employees and 3.8 million contractors make up a fraction of China’s over 400 million urban labor force. In the event of an orderly default of Evergrande and limited spillovers to both the financial market and broader property sector, the macro impact should be manageable.”
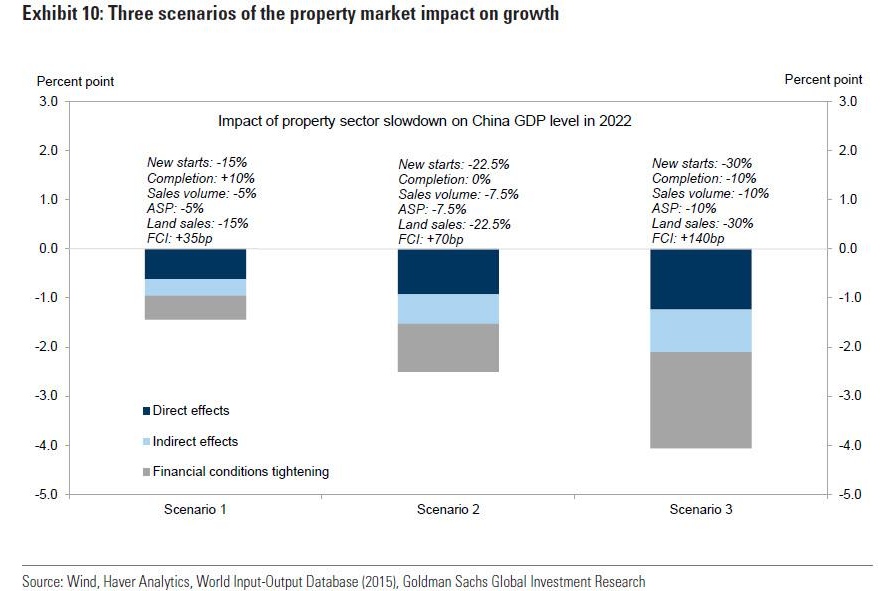
Thus, Goldman Sachs outlines three potential scenarios for how the Evergrande fallout could impact the Chinese economy:
- The shock could decrease 2022 Chinese GDP growth by 1.4%, with the direct effects from Evergrande leading to the decline .
- The shock could decrease 2022 Chinese GDP growth by 2.5%, with financial tightening and spillover effects (contagion) becoming more pronounced.
- The shock could decrease 2022 Chinese GDP growth by 4.1%, with the doomsday scenario underwritten by a massive liquidity crunch and virtually no assistance from Beijing.
Please see below:
And what’s the most likely outcome? Well, while the firm reiterated that “our baseline remains that any potential default or restructuring of Evergrande would be carefully managed by the government with limited contagion effect in both financial and property markets,” the group cautioned that “this would require a clear message from the government soon to shore up confidence and to stop the spillover effect, the absence of which we think poses a notable downside risk to growth in Q4 and next year.”
The bottom line? The ball is essentially in Beijing’s court. If Chinese officials bail out the embattled developer, the ‘money printing solves all problems’ approach will likely stop the hemorrhaging. However, it won’t alleviate the underlying problem and risks to the global economy still remain elevated:
- Declining property values in China will have a negative wealth effect and will likely weigh on consumer confidence. In turn, this could dampen Chinese GDP growth, and because China is the world’s second-largest economy, it could dampen global GDP growth.
- In a standard bankruptcy, equity holders are often wiped out. Thus, even if a bailout commences, let’s keep in mind that large Chinese and U.S. investors own Chinese stocks (think of BlackRock), and substantial losses should materialize.
- Chinese investors own a lot of foreign properties. Thus, if stress occurs on the mainland, large Chinese investors may have to sell their foreign assets to shore up their domestic accounts. As a result, this could weigh on property values in regions like Europe, the U.S. and Canada.
- No bailout means that all bets are off.
Finally, while we wait for Beijing’s response, how could the Evergrande fallout affect the PMs? Well, for one, while gold benefited from the safe-haven bid on Sep. 20, it’s important to remember that silver, the GDX ETF and the GDXJ ETF (our short position) all ended the day in the red. Second, when the dot-com bubble burst (2000), the housing market collapsed (2008) and the coronavirus crisis struck (2020), gold suffered mightily. Thus, event-driven rallies often have a short shelf life and liquidity events (panic selling of stocks) often hurts the yellow metal more than it helps.
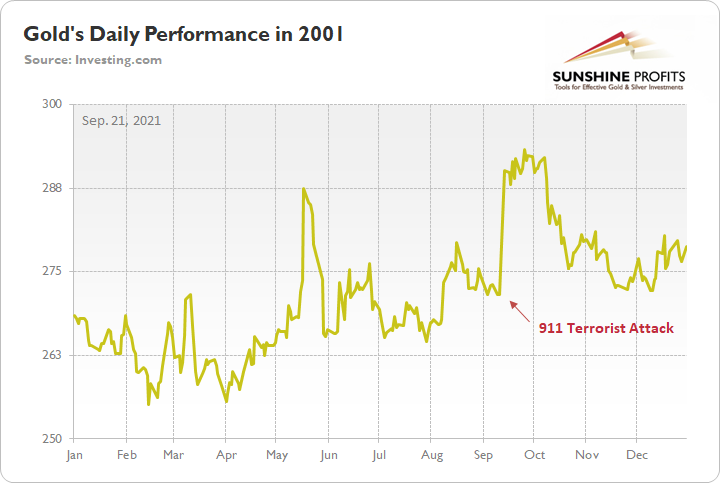
As evidence, when the Twin Towers fell roughly 20 years ago, gold spiked on Sep. 11, 2001. However, it wasn’t long before the momentum fizzled, and the yellow metal nearly retraced all of the gains by early December. Thus, when it comes to forecasting higher gold prices, Black Swan events are often more semblance than substance.
In conclusion, gold outperformed on Sep. 20, despite the dam breaking and a sea of red flooding the financial markets. And while the Evergrande saga remains investors’ greatest tail risk, until/unless the Chinese government steps in, the potential catastrophe is still bearish for gold (due to a likely increase in the USD Index), and more importantly, the GDXJ ETF. Conversely, if cooler heads prevail, and the situation resolves itself, the state of play remains as it was; the GDXJ ETF was in a downtrend before Evergrande struck, and will likely remain in a downtrend during and after a resolution is finalized. As a result, the medium-term outlook for the PMs remains unchanged, and lower prices should materialize over the next few months.
Taking a brutal / more realistic view of the situation, it could be the case that Evergrande started the massive stock market decline, as it was convenient for the Powers That Be to finally let stocks decline after they found a perfect scapegoat. And if the general stock market is about to slide, then the precious metals market is likely to fall hard too, especially silver and mining stocks.
Please keep in mind what I’ve been writing about many times before – that the precious metals sector is likely to bottom about 3.5 months after the general stock market tops. Now, IF the precious metals market is going to top in mid-December or late-December, then the “ideal” time for the stock market to top would be in early September. And – based on the recent decline – it seems that’s exactly what happened.
Overview of the Upcoming Part of the Decline
- It seems to me that the corrective upswing in gold is over, and the big decline seems to be already underway.
- It seems that the first stop for gold will be close to its previous 2021 lows, slightly below $1,700. Then it will likely correct a bit, but it’s unclear if I want to exit or reverse the current short position based on that – it depends on the number and the nature of the bullish indications that we get at that time.
- After the above-mentioned correction, we’re likely to see a powerful slide, perhaps close to the 2020 low ($1,450 - $1,500).
- If we see a situation where miners slide in a meaningful and volatile way while silver doesn’t (it just declines moderately), I plan to switch from short positions in miners to short positions in silver. At this time, it’s too early to say at what price levels this could take place, and if we get this kind of opportunity at all – perhaps with gold close to $1,600.
- I plan to exit all remaining short positions when gold shows substantial strength relative to the USD Index while the latter is still rallying. This might take place with gold close to $1,350 - $1,400. I expect silver to fall the hardest in the final part of the move. This moment (when gold performs very strongly against the rallying USD and miners are strong relative to gold after its substantial decline) is likely to be the best entry point for long-term investments, in my view. This might also happen with gold close to $1,375, but it’s too early to say with certainty at this time. I expect the final bottom to take place near the end of the year, perhaps in mid-December.
- As a confirmation for the above, I will use the (upcoming or perhaps we have already seen it?) top in the general stock market as the starting point for the three-month countdown. The reason is that after the 1929 top, gold miners declined for about three months after the general stock market started to slide. We also saw some confirmations of this theory based on the analogy to 2008. All in all, the precious metals sector is likely to bottom about three months after the general stock market tops.
- The above is based on the information available today, and it might change in the following days/weeks.
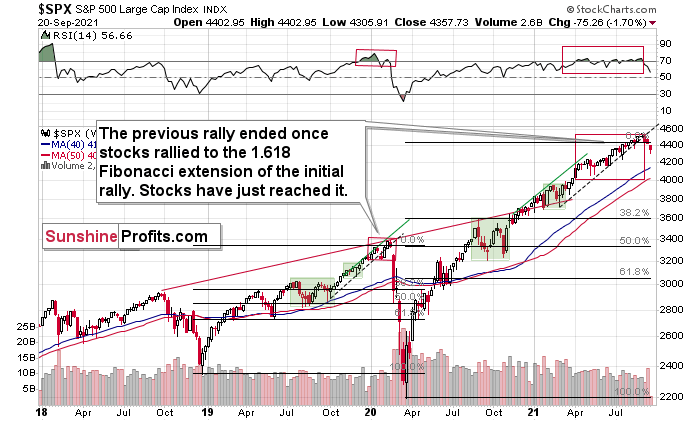
You will find my general overview of the outlook for gold on the chart below:
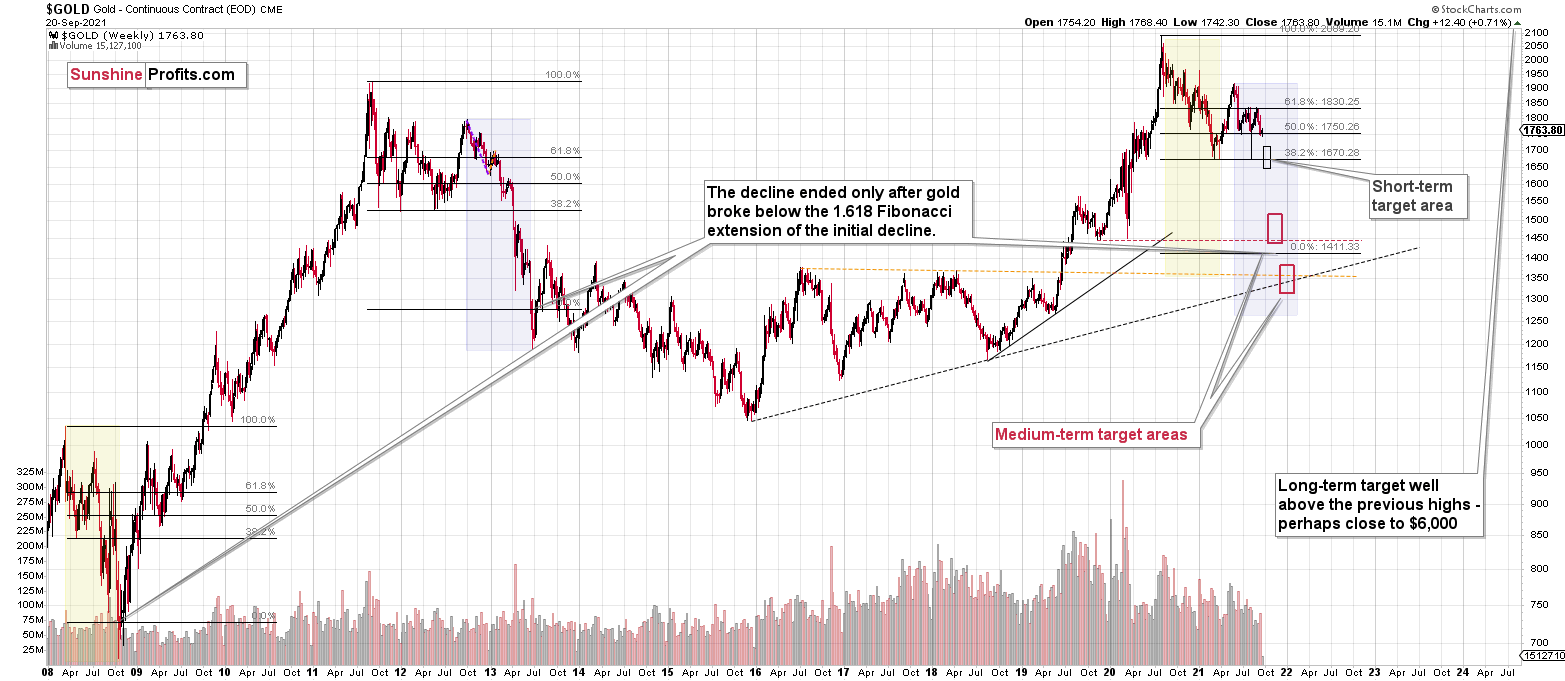
Please note that the above timing details are relatively broad and “for general overview only” – so that you know more or less what I think and how volatile I think the moves are likely to be – on an approximate basis. These time targets are not binding or clear enough for me to think that they should be used for purchasing options, warrants or similar instruments.
Summary
To summarize, the outlook for the precious metals sector remains extremely bearish for the next few months.
The decline to new lows in the GDX and silver as well as the strength that we saw in the USD Index were important short-term confirmations for the bearish case, but the key two long-term factors remain the analogy to 2013 in gold and the broad head and shoulders pattern in the HUI Index. Both suggest much lower prices ahead.
It seems that our profits from the short positions are going to become truly epic in the following weeks.
After the sell-off (that takes gold to about $1,350 - $1,500), I expect the precious metals to rally significantly. The final part of the decline might take as little as 1-5 weeks, so it's important to stay alert to any changes.
Most importantly, please stay healthy and safe. We made a lot of money last March and this March, and it seems that we’re about to make much more on the upcoming decline, but you have to be healthy to enjoy the results.
As always, we'll keep you - our subscribers - informed.
By the way, we’re currently providing you with the possibility to extend your subscription by a year, two years or even three years with a special 20% discount. This discount can be applied right away, without the need to wait for your next renewal – if you choose to secure your premium access and complete the payment upfront. The boring time in the PMs is definitely over, and the time to pay close attention to the market is here. Naturally, it’s your capital, and the choice is up to you, but it seems that it might be a good idea to secure more premium access now while saving 20% at the same time. Our support team will be happy to assist you in the above-described upgrade at preferential terms – if you’d like to proceed, please contact us.
To summarize:
Trading capital (supplementary part of the portfolio; our opinion): Full speculative short positions (300% of the full position) in mining stocks are justified from the risk to reward point of view with the following binding exit profit-take price levels:
Mining stocks (price levels for the GDXJ ETF): binding profit-take exit price: $35.73; stop-loss: none (the volatility is too big to justify a stop-loss order in case of this particular trade)
Alternatively, if one seeks leverage, we’re providing the binding profit-take levels for the JDST (2x leveraged) and GDXD (3x leveraged – which is not suggested for most traders/investors due to the significant leverage). The binding profit-take level for the JDST: $16.96; stop-loss for the JDST: none (the volatility is too big to justify a SL order in case of this particular trade); binding profit-take level for the GDXD: $35.46; stop-loss for the GDXD: none (the volatility is too big to justify a SL order in case of this particular trade).
For-your-information targets (our opinion; we continue to think that mining stocks are the preferred way of taking advantage of the upcoming price move, but if for whatever reason one wants / has to use silver or gold for this trade, we are providing the details anyway.):
Silver futures upside profit-take exit price: unclear at this time - initially, it might be a good idea to exit, when gold moves to $1,683
Gold futures upside profit-take exit price: $1,683
HGD.TO – alternative (Canadian) inverse 2x leveraged gold stocks ETF – the upside profit-take exit price: $11.38
Long-term capital (core part of the portfolio; our opinion): No positions (in other words: cash
Insurance capital (core part of the portfolio; our opinion): Full position
Whether you already subscribed or not, we encourage you to find out how to make the most of our alerts and read our replies to the most common alert-and-gold-trading-related-questions.
Please note that we describe the situation for the day that the alert is posted in the trading section. In other words, if we are writing about a speculative position, it means that it is up-to-date on the day it was posted. We are also featuring the initial target prices to decide whether keeping a position on a given day is in tune with your approach (some moves are too small for medium-term traders, and some might appear too big for day-traders).
Additionally, you might want to read why our stop-loss orders are usually relatively far from the current price.
Please note that a full position doesn't mean using all of the capital for a given trade. You will find details on our thoughts on gold portfolio structuring in the Key Insights section on our website.
As a reminder - "initial target price" means exactly that - an "initial" one. It's not a price level at which we suggest closing positions. If this becomes the case (like it did in the previous trade), we will refer to these levels as levels of exit orders (exactly as we've done previously). Stop-loss levels, however, are naturally not "initial", but something that, in our opinion, might be entered as an order.
Since it is impossible to synchronize target prices and stop-loss levels for all the ETFs and ETNs with the main markets that we provide these levels for (gold, silver and mining stocks - the GDX ETF), the stop-loss levels and target prices for other ETNs and ETF (among other: UGL, GLL, AGQ, ZSL, NUGT, DUST, JNUG, JDST) are provided as supplementary, and not as "final". This means that if a stop-loss or a target level is reached for any of the "additional instruments" (GLL for instance), but not for the "main instrument" (gold in this case), we will view positions in both gold and GLL as still open and the stop-loss for GLL would have to be moved lower. On the other hand, if gold moves to a stop-loss level but GLL doesn't, then we will view both positions (in gold and GLL) as closed. In other words, since it's not possible to be 100% certain that each related instrument moves to a given level when the underlying instrument does, we can't provide levels that would be binding. The levels that we do provide are our best estimate of the levels that will correspond to the levels in the underlying assets, but it will be the underlying assets that one will need to focus on regarding the signs pointing to closing a given position or keeping it open. We might adjust the levels in the "additional instruments" without adjusting the levels in the "main instruments", which will simply mean that we have improved our estimation of these levels, not that we changed our outlook on the markets. We are already working on a tool that would update these levels daily for the most popular ETFs, ETNs and individual mining stocks.
Our preferred ways to invest in and to trade gold along with the reasoning can be found in the how to buy gold section. Furthermore, our preferred ETFs and ETNs can be found in our Gold & Silver ETF Ranking.
As a reminder, Gold & Silver Trading Alerts are posted before or on each trading day (we usually post them before the opening bell, but we don't promise doing that each day). If there's anything urgent, we will send you an additional small alert before posting the main one.
Thank you.
Przemyslaw Radomski, CFA
Founder, Editor-in-chief

