

Briefly: in our opinion, full (300% of the regular position size) speculative short positions in junior mining stocks are justified from the risk/reward point of view at the moment of publishing this Alert.
The precious metal sector declined a bit yesterday (gold and silver just slightly, mining stocks more visibly), which served as yet another confirmation of the points that I’ve been making previously. Practically the entire yesterday’s big analysis remains up-to-date, so if you haven’t had the chance to read it yet, I encourage you to do so today.
In today’s analysis, I would like to draw your attention to something that’s extremely important but that might be hidden in plain sight.
It’s the way gold stocks perform relative to gold. More precisely, how they fail to perform.
This is an important sign, and I have written about it on multiple occasions. However, what might not be obvious is that the implications of the relative strength or lack thereof are exponentially more important if the same indication is repeated over and over again. At some point, the day-to-day weakness becomes a medium-term trend, and that’s when it becomes really meaningful.
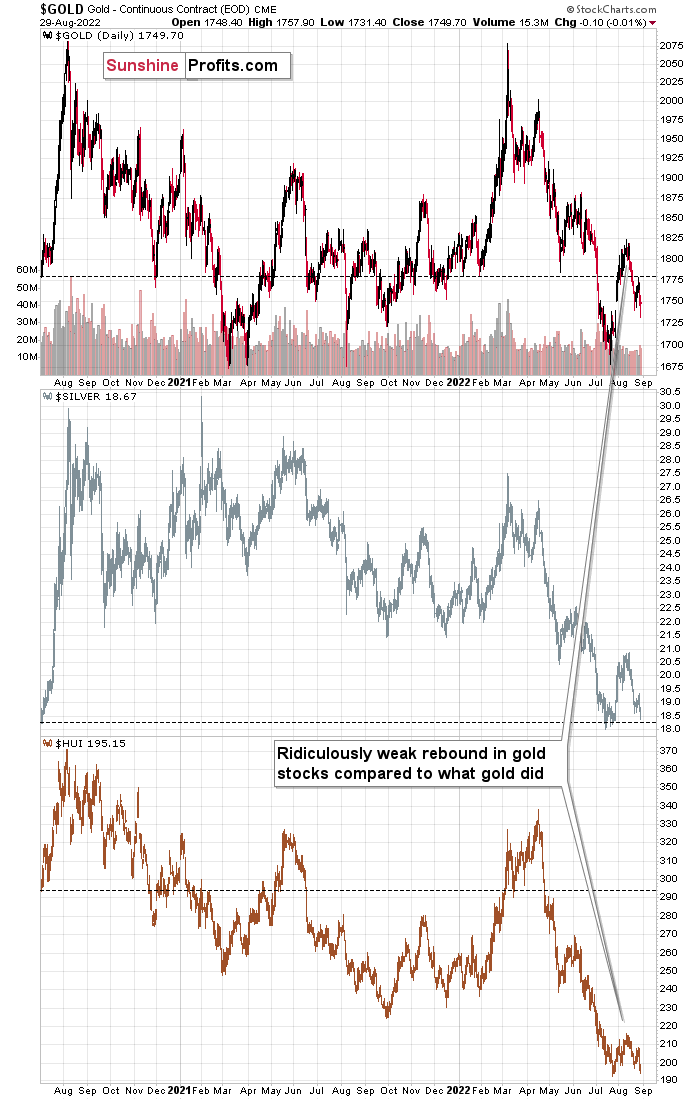
Gold and silver are currently more or less where they were trading about two years ago (before the final part of the mid-2020 rally).
What about gold stocks? The HUI Index would have to rally by almost 50% in order to get back to those analogous price levels!
Gold stocks usually lead gold higher and lower (there are some short-term exceptions, but they are not really applicable right now), and there’s no doubt that miners currently lead gold lower.
Please consider the size of the recent corrective upswing in gold, then in silver, and next, please look at how “much” gold stocks rallied.
Laughable, isn’t it?
Not only that – gold stocks already gave away almost the entire rally, even though gold is only about halfway down.
If you think that this is extremely bearish, then… Of course, you’re right. However, the situation is actually even more extreme than that.
You see, that’s the same thing we saw on the precious metals market in 2013, right before the biggest part of the slide!
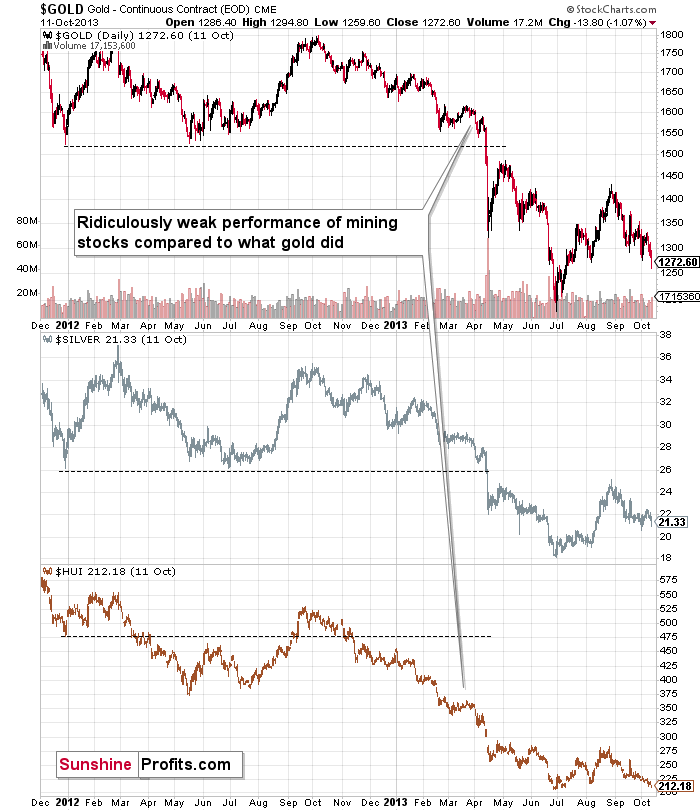
While gold was still in a medium-term horizontal trading pattern, gold stocks were already in a medium-term downtrend – just like what we see right now and what we’ve been seeing in the previous months.
Yes, the profits on our short positions increased once again yesterday, but the above tells us that it’s small potatoes compared to what’s to come. As always, I can’t make any guarantees with regard to price moves or profitability. However, I do think that the upcoming slide will truly be epic. Ever wanted to get back in time and not miss the profits on the 2008 and 2013 declines? Time travel is not yet included in our services, but the current slide is – in my opinion – the next best way to fulfill this wish.
If you can’t or don’t want to profit from declining mining stock prices, I also have good news. Please keep in mind that the decline is not likely to last forever. Based on how the precious metals sector declined in 2008 and 2013, and based on multiple other indications, it seems that we’ll see a major bottom this year. While higher prices are encouraging, please note that there are two moments that determine a given trade’s or investment’s profitability – it’s not just the exit price, but also the entry price.
Thanks to declines and lower prices, one can get in at much lower levels and thus greatly increase the profits (again, I’m not guaranteeing any profits or market performance – nobody can guarantee it) from the entire huge rally that’s likely to take place in the following years.
The “mother of all buying opportunities” in the precious metals sector is likely not here yet, but it’s likely to present itself in the not-too-distant future. Stay tuned!
Having said that, let’s take a look at the markets from a more fundamental point of view.
The Hangover
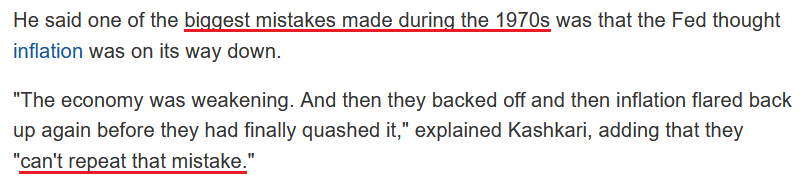
With investors still rattled from Fed Chairman Jerome Powell's hawkish Jackson Hole speech, the S&P 500 and the GDXJ ETF continued their declines on Aug. 29. Moreover, Minneapolis Fed President Neel Kashkari added to the anxiety when he said:
I was "actually happy to see how Chair Powell's Jackson Hole speech was received," as it highlighted investors' belief that the Fed is serious about achieving its 2% inflation goal. Furthermore, he noted he "certainly was not excited" when the stock market ignored the Fed's cries and rallied in the weeks prior.
As such, my comments from Apr. 6 continue to prove prescient:
Please remember that the Fed needs to slow the U.S. economy to calm inflation, and rising asset prices are mutually exclusive to this goal. Therefore, officials should keep hammering the financial markets until investors finally get the message.
Moreover, with the Fed in inflation-fighting mode and reformed doves warning that the U.S. economy “could teeter” as the drama unfolds, the reality is that there is no easy solution to the Fed’s problem. To calm inflation, it has to kill demand. If that occurs, investors should suffer a severe crisis of confidence.
To that point, while I’ve warned repeatedly that a hyperinflationary collapse is much worse than a rate-hike-induced recession, Kashkari echoed Powell’s words and made the point for me on Aug. 29.
Please see below:
 Source: Investing.com
Thus, with Fed officials highlighting the fundamental realities that should plague asset prices in the months ahead, the medium-term outlooks for gold, silver, mining stocks, and the S&P 500 are profoundly bearish.
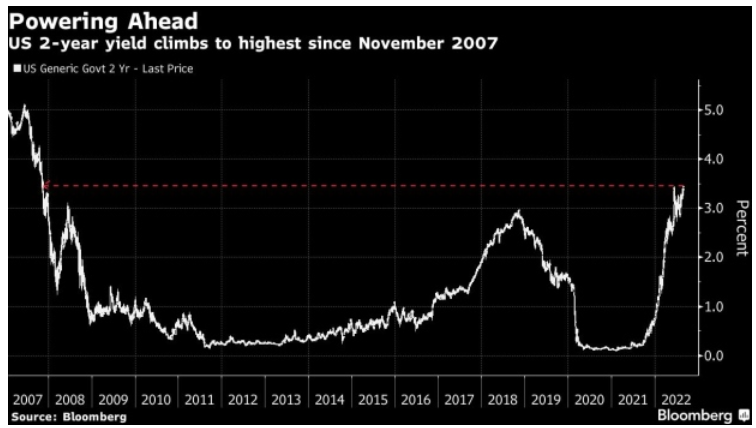
Furthermore, with the front-end of the U.S. yield curve re-pricing to reflect these realities, the U.S. 2-Year Treasury yield soared to its highest level since 2007.
Please see below:
Likewise, while the benchmark has gone vertical in 2022, I warned on Dec. 23, 2021 that investors were ignoring inflation at their own peril. I wrote:
Please note that when the Fed called inflation “transitory,” I wrote for months that officials were misreading the data. As a result, I don’t have a horse in this race. However, now, they likely have it right. Thus, if investors assume that the Fed won’t tighten, their bets will likely go bust in 2022.
In addition, with the medium-term outlook profoundly bullish for Fed policy and U.S. real yields, Stephen Miller, an investment consultant at GSFM, said on Aug. 28 that “I can’t see anything other than the dollar going higher. U.S. rates are going to go higher than in Europe and the U.K. because they both face economic dysfunction that complicates the capacity of central banks there to be as aggressive as the Fed.”
Thus, with the consensus coming around to our way of thinking, gold, silver, and mining stocks are unlikely to perform well in a world of tighter financial conditions. Moreover, with the U.S. 10-Year real yield climbing to 0.54% on Aug. 29, the metric should surpass 1% before it’s all said and done.
A Major Problem
With the post-GFC crowd assuming the slightest economic weakness would elicit a pivot from the Fed, they lack insight into the destructive nature of inflation. For example, I wrote on Aug. 9:
The idea that the Fed can pivot and inflation will subside may be the biggest bubble in the financial markets. Not only does it lack economic logic, but it is antithetical to historical precedent.
 Source: U.S. Fed
To that point, with Powell citing Volcker and highlighting how inflation will eventually come for the U.S. labor market, his comments on Aug. 26 signal that he understands the consequences of “stop-go” monetary policy.
Please see below:
 Source: U.S. Fed
Thus, with the 2022 Fed turning back the clock to the 1980s, I've warned on numerous occasions that inflation is the biggest risk to the U.S. economy, not higher interest rates; and with Powell nodding in agreement, the performance of assets is secondary to America's long-term health. Therefore, the bulls don't realize that inflation is a profound evil, and the Fed's medium-term battle will be one of attrition.
Yet, the underlying scars of waiting too long to raise interest rates are already starting to show. For example, I've noted how recent business surveys show growth decelerating sharply, while inflation and employment remain uplifted. For context, I explained the lagged relationship on Aug. 16. I wrote:
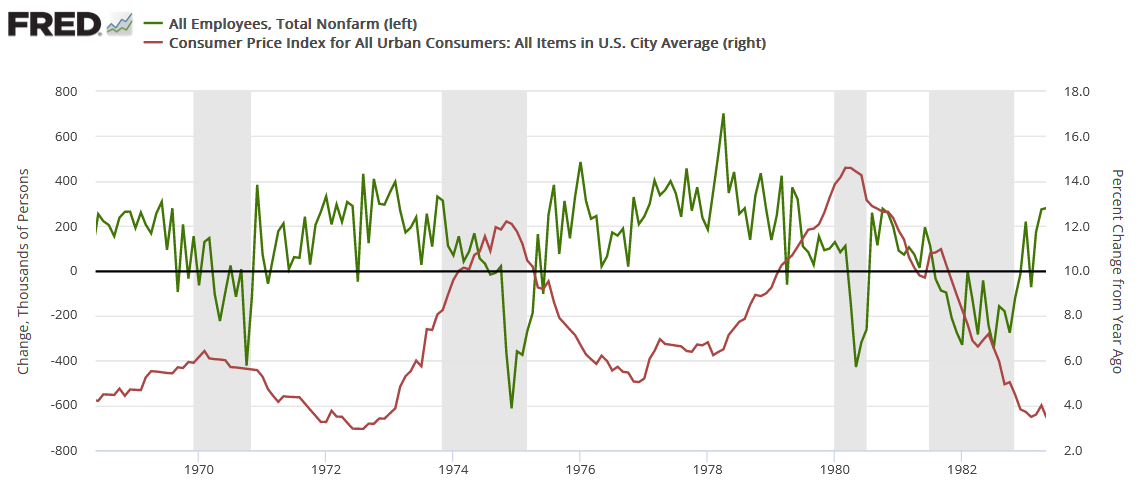
The red line above tracks the year-over-year (YoY) percentage change in the headline CPI, while the green line above tracks the monthly change in U.S. nonfarm payrolls. For context, the consensus cites near-record job openings and robust payrolls growth as evidence for why only a mild recession can occur (if one occurs at all).
However, the chart above highlights how unanchored inflation torpedoed that narrative in the 1970s. If you analyze the shaded gray areas (recessions), notice how the green line remained positive during the early stages of the recessions in 1970, 1974, and 1980. In a nutshell: monthly payroll growth stayed positive during the outset of all three recessions.
However, if you focus your attention on the sharp drops in the green line near the end of the 1970, 1974, and 1980 recessions (negative monthly payrolls prints), you can see that reality re-emerged and the U.S. labor market suffered mightily. Moreover, negative payrolls growth was also present during the 1982 recession, but inflation was declining at that time.
As such, the current economic backdrop is fraught with similar issues. The Dallas Fed released its Texas Manufacturing Outlook Survey on Aug. 29, and output continues to head in the wrong direction.
Please see below:
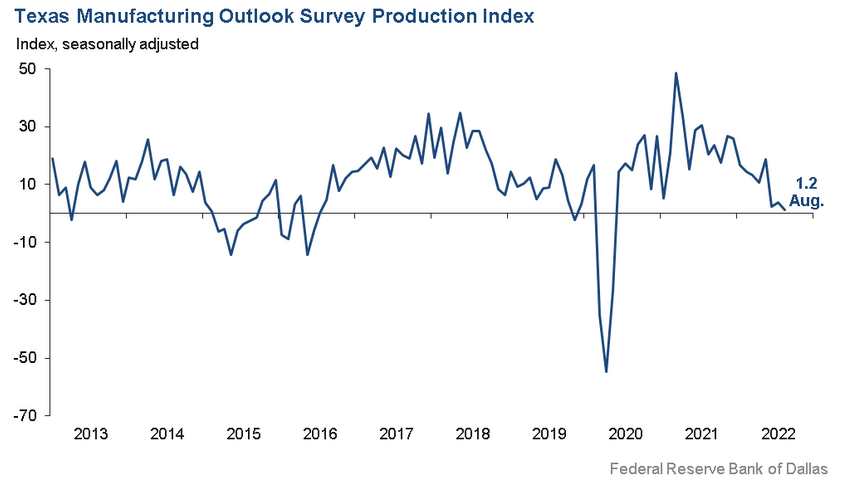
However, the report revealed:
“Labor market measures continued to indicate robust employment growth and longer workweeks. The employment index ticked down two points to 15.6, a reading significantly above its series average of 7.8. Twenty-seven percent of firms noted net hiring, while 12 percent noted net layoffs. The hours worked index pushed up five points to 14.4.”
In addition:
“Prices and wages continued to increase, though price pressures moderated. The raw materials prices index fell four points to 34.4, a reading still above its average of 28.1 but far below its high of 83.3 last November. The finished goods prices index also moved down, from 29.3 to 26.8. The wages and benefits index, however, pushed higher in August to 45.8.”
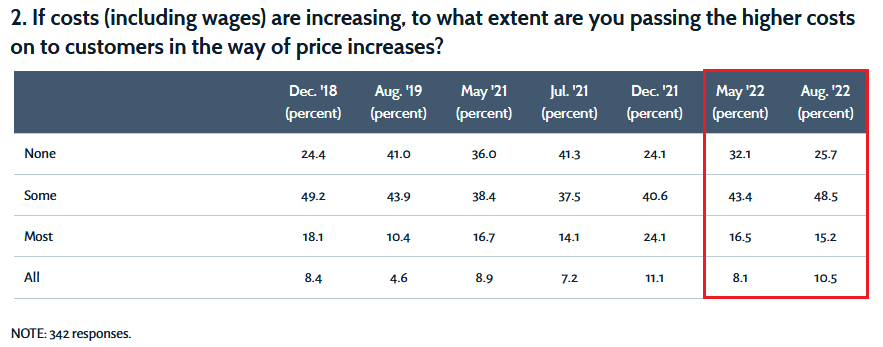
As a result, ominous winds continue to blow across the U.S. economy, as growth abates from abnormally high levels while inflation and employment remain at abnormally high levels. As further evidence, this month’s special questions highlight how more Dallas manufacturers are passing on higher costs to their customers.
Please see below:
 Source: Dallas Fed
To explain, the “None” row shows that the percentage of Dallas manufacturers not passing on higher costs declined from 32.1% in May to 25.7% in August. Therefore, the percentage of Dallas manufacturers increasing their output prices increased from ~67.9% in May to ~74.3% in August.
Thus, the consensus materially underestimates the Fed’s inflation fight. Moreover, every bout of high inflation since 1954 has ended in a recession. As such, asset prices need to decline substantially from their current levels to reflect their current fundamental values.
The Bottom Line
While Powell's wake-up call has shifted sentiment across the financial markets, the bulls' spirit won't die easily. Moreover, with the Atlanta Fed projecting third-quarter real GDP growth of 1.6%, it's far from the levels that would coincide with a collapse in asset prices.
However, it's important to distinguish where we are from where we're likely going. With demand more resilient than the consensus realizes, quelling inflation should prove challenging for the Fed. As a result, while the futures market has priced in a peak U.S. federal funds rate (FFR) of 3.84% in April 2023, the expectation is still too low. Therefore, more hawkish re-pricing should occur in the months ahead, and a realization is profoundly bearish for the PMs and the S&P 500.
In conclusion, the PMs declined on Aug. 29 and the GDXJ ETF underperformed its peers. Moreover, with the fundamental challenges intensifying and the consensus slowly realizing that unanchored inflation won't solve itself, lower lows should confront gold, silver, and mining stocks over the medium term. As such, their outlooks for the months ahead remain bearish.
Overview of the Upcoming Part of the Decline
- It seems to me that the corrective upswing is over, and that the next big move lower is already underway.
- If we see a situation where miners slide in a meaningful and volatile way while silver doesn’t (it just declines moderately), I plan to – once again – switch from short positions in miners to short positions in silver. At this time, it’s too early to say at what price levels this could take place and if we get this kind of opportunity at all – perhaps with gold prices close to $1,600.
- I plan to exit all remaining short positions once gold shows substantial strength relative to the USD Index while the latter is still rallying. This may be the case with gold prices close to $1,400. I expect silver to fall the hardest in the final part of the move. This moment (when gold performs very strongly against the rallying USD and miners are strong relative to gold after its substantial decline) is likely to be the best entry point for long-term investments, in my view. This can also happen with gold close to $1,400, but at the moment it’s too early to say with certainty.
- The above is based on the information available today, and it might change in the following days/weeks.
You will find my general overview of the outlook for gold on the chart below:
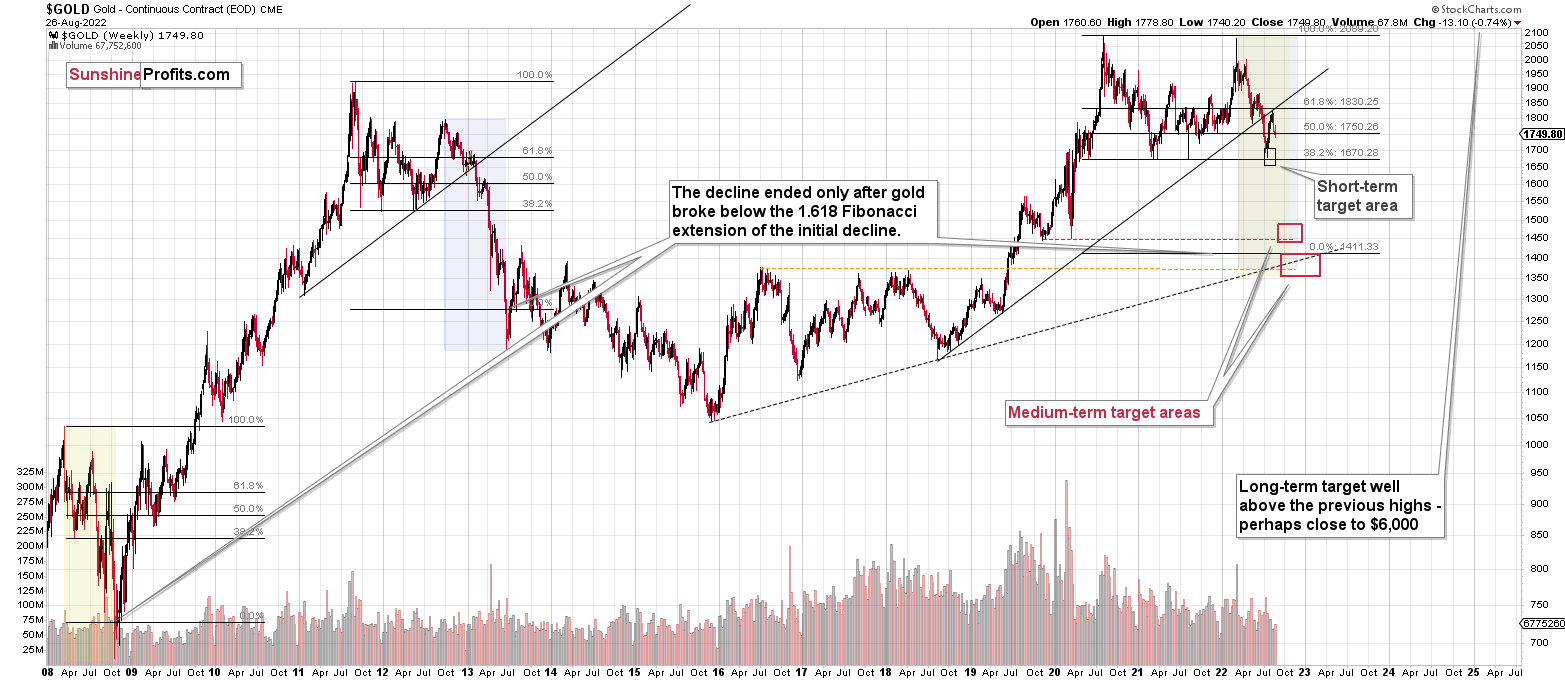
Please note that the above timing details are relatively broad and “for general overview only” – so that you know more or less what I think and how volatile I think the moves are likely to be – on an approximate basis. These time targets are not binding nor clear enough for me to think that they should be used for purchasing options, warrants, or similar instruments.
Letters to the Editor
Q: I would like to start by congratulating you on the accuracy of your calls. It is very impressive. As I was reading your analysis today, I think that you believe we will see lower lows in TLT. I just want to confirm that I am understanding you correctly. If you are expecting lower lows in TLT, would you expect them around the same time that gold bottoms?
Thank you.
A: The lower lows in TLT are a tough call. TLT is 20+ year Treasuries, and the Fed can’t control long-term rates even if it raises short-term rates much higher. It’s unclear.
However, it’s quite possible that the precious metals sector will reverse before other markets. At least before stocks and the USD Index. It’s quite likely that PMs will reverse before the rates do as well. Why would this be the case? Because, ultimately, when stocks truly plunge, people will seek a safe-haven, and this kind of demand will likely kick-in for the precious metals sector.
Indeed, in 2008, PMs bottomed well ahead of stocks – and I expect to see something similar in the not-too-distant future.
Summary
Summing up, it seems that the corrective upswing is over, which means that the powerful medium-term downtrend can now resume.
You have been profiting from how this situation develops practically throughout the entire year, and the above indicates (I’m not making any guarantees, of course) that the biggest gains are likely just ahead.
After the final sell-off (that takes gold to about $1,350-$1,500), I expect the precious metals to rally significantly. The final part of the decline might take as little as 1-5 weeks, so it's important to stay alert to any changes.
As always, we'll keep you – our subscribers – informed.
To summarize:
Trading capital (supplementary part of the portfolio; our opinion): Full speculative short positions (300% of the full position) in junior mining stocks are justified from the risk to reward point of view with the following binding exit profit-take price levels:
Mining stocks (price levels for the GDXJ ETF): binding profit-take exit price: $20.32; stop-loss: none (the volatility is too big to justify a stop-loss order in case of this particular trade)
Alternatively, if one seeks leverage, we’re providing the binding profit-take levels for the JDST (2x leveraged). The binding profit-take level for the JDST: $29.87; stop-loss for the JDST: none (the volatility is too big to justify a SL order in case of this particular trade).
For-your-information targets (our opinion; we continue to think that mining stocks are the preferred way of taking advantage of the upcoming price move, but if for whatever reason one wants / has to use silver or gold for this trade, we are providing the details anyway.):
Silver futures downside profit-take exit price: $12.32
SLV profit-take exit price: $11.32
ZSL profit-take exit price: $79.87
Gold futures downside profit-take exit price: $1,504
HGD.TO – alternative (Canadian) 2x inverse leveraged gold stocks ETF – the upside profit-take exit price: $19.87
HZD.TO – alternative (Canadian) 2x inverse leveraged silver ETF – the upside profit-take exit price: $49.87
Long-term capital (core part of the portfolio; our opinion): No positions (in other words: cash)
Insurance capital (core part of the portfolio; our opinion): Full position
Whether you’ve already subscribed or not, we encourage you to find out how to make the most of our alerts and read our replies to the most common alert-and-gold-trading-related-questions.
Please note that we describe the situation for the day that the alert is posted in the trading section. In other words, if we are writing about a speculative position, it means that it is up-to-date on the day it was posted. We are also featuring the initial target prices to decide whether keeping a position on a given day is in tune with your approach (some moves are too small for medium-term traders, and some might appear too big for day-traders).
Additionally, you might want to read why our stop-loss orders are usually relatively far from the current price.
Please note that a full position doesn't mean using all of the capital for a given trade. You will find details on our thoughts on gold portfolio structuring in the Key Insights section on our website.
As a reminder - "initial target price" means exactly that - an "initial" one. It's not a price level at which we suggest closing positions. If this becomes the case (as it did in the previous trade), we will refer to these levels as levels of exit orders (exactly as we've done previously). Stop-loss levels, however, are naturally not "initial", but something that, in our opinion, might be entered as an order.
Since it is impossible to synchronize target prices and stop-loss levels for all the ETFs and ETNs with the main markets that we provide these levels for (gold, silver and mining stocks - the GDX ETF), the stop-loss levels and target prices for other ETNs and ETF (among other: UGL, GLL, AGQ, ZSL, NUGT, DUST, JNUG, JDST) are provided as supplementary, and not as "final". This means that if a stop-loss or a target level is reached for any of the "additional instruments" (GLL for instance), but not for the "main instrument" (gold in this case), we will view positions in both gold and GLL as still open and the stop-loss for GLL would have to be moved lower. On the other hand, if gold moves to a stop-loss level but GLL doesn't, then we will view both positions (in gold and GLL) as closed. In other words, since it's not possible to be 100% certain that each related instrument moves to a given level when the underlying instrument does, we can't provide levels that would be binding. The levels that we do provide are our best estimate of the levels that will correspond to the levels in the underlying assets, but it will be the underlying assets that one will need to focus on regarding the signs pointing to closing a given position or keeping it open. We might adjust the levels in the "additional instruments" without adjusting the levels in the "main instruments", which will simply mean that we have improved our estimation of these levels, not that we changed our outlook on the markets. We are already working on a tool that would update these levels daily for the most popular ETFs, ETNs and individual mining stocks.
Our preferred ways to invest in and to trade gold along with the reasoning can be found in the how to buy gold section. Furthermore, our preferred ETFs and ETNs can be found in our Gold & Silver ETF Ranking.
As a reminder, Gold & Silver Trading Alerts are posted before or on each trading day (we usually post them before the opening bell, but we don't promise doing that each day). If there's anything urgent, we will send you an additional small alert before posting the main one.
Thank you.
Przemyslaw Radomski, CFA
Founder, Editor-in-chief

