

Briefly: in our opinion, full (300% of the regular position size) speculative short positions in mining stocks are justified from the risk/reward point of view at the moment of publishing this Alert.
Hey, you want to hear a joke that’s just not funny?
Gold miners’ performance.
I told you it wasn’t funny. It’s very informative though.
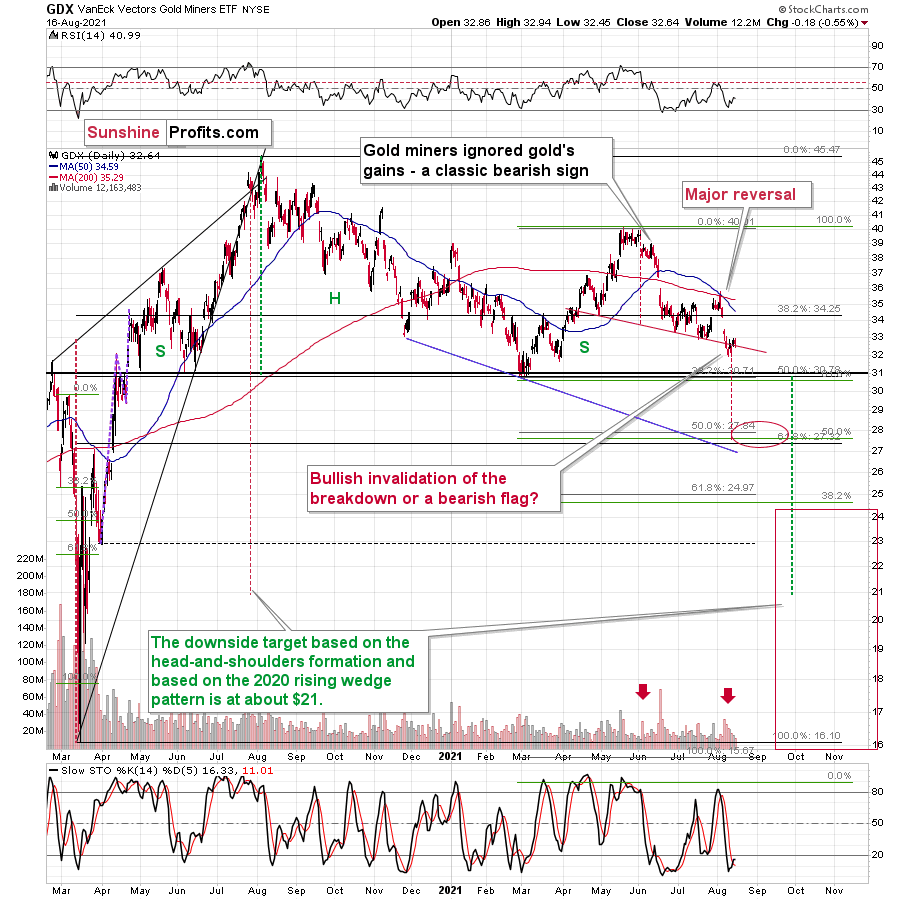
With gold stocks completely ignoring gold’s gains, the myriads of factors that I’ve been discussing for weeks might not have been in place, and the outlook for the precious metals sector would be bearish anyway. Gold stocks’ weakness is so ubiquitous and so extreme that it’s a critical sell signal on its own.
It was just yesterday when I emphasized that it was yet another week when the HUI Index – the flagship proxy for the gold – declined by about 5 points while gold moved higher by about $15, and yesterday we saw exactly the same kind of performance.
Gold ended yesterday’s session $11.60 higher, and what did gold stocks do? The HUI Index was down by 1.21 (0.48%), the GDX ETF was down by $0.18 (0.55%), and the GDXJ ETF was down by 0.45 (1.05% – so, profits on our short position have increased further).
Sometimes gold stocks take the lead of the general stock market, which… makes yesterday’s decline even more bearish because the general stock market ended yesterday’s session higher.
Gold miners sell gold and/or discover it to develop a given property and sell gold later. If the price of gold increases, it’s obvious that the prices of gold stocks’ shares should increase, as their current or future profits depend on gold’s price. Sure, miners will sell gold at a future price, not today’s price, but a higher price today means higher price expectations in the future, so it doesn’t really matter that there’s this delay. Gold price up should equal gold stocks’ prices up. If it doesn’t, it means that something is very wrong.
The thing that’s very wrong is that the precious metals market hasn’t yet completed its final decline and therefore it’s reluctant to respond to bullish indications. What we’re seeing in gold stocks is a screaming and extreme sign that the sector is going to decline in the following weeks and months. And it’s not the first time we’ve seen something like that! We saw exactly the same thing in 2013 before a massive slide.
Yes, the fundamental situation for gold, in the long run, is very positive. Yes, it’s even more positive for silver. And yes – right after the bottom, gold stocks are likely to outperform gold and soar profoundly.
BUT.
It’s not likely to happen until we see a huge price decline first. And it’s this huge price decline that we’re very likely to profit from even before we get to this mother-of-all-buying-opportunities. And what’s best is that thanks to the profits on the short position, we’ll most likely be able to buy even more extremely discounted gold, silver, and mining stocks.
Give the Charts a Look
Let’s jump into the short-term charts for details of what happened yesterday, starting with senior mining stocks.
The small decline seems irrelevant, but it is very bearish when one compares it with what happened in gold.
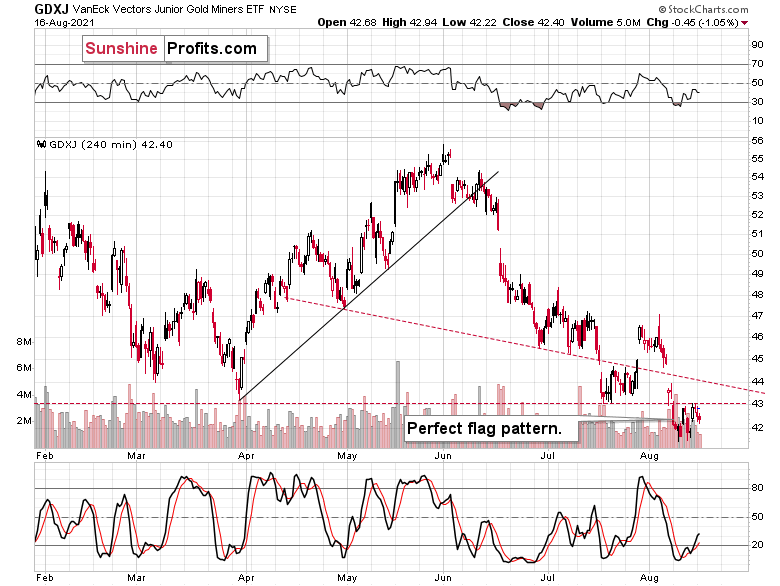
The same goes for the junior gold miners, which declined even more than seniors.
Please note how perfect the verification of the breakdown to new yearly lows was. The GDXJ moved back and forth in a classic ABC format and thus created a flag pattern right below the previously broken support level which –this way – was verified as resistance. The volume was low, which means that the market is simply waiting for another downleg.
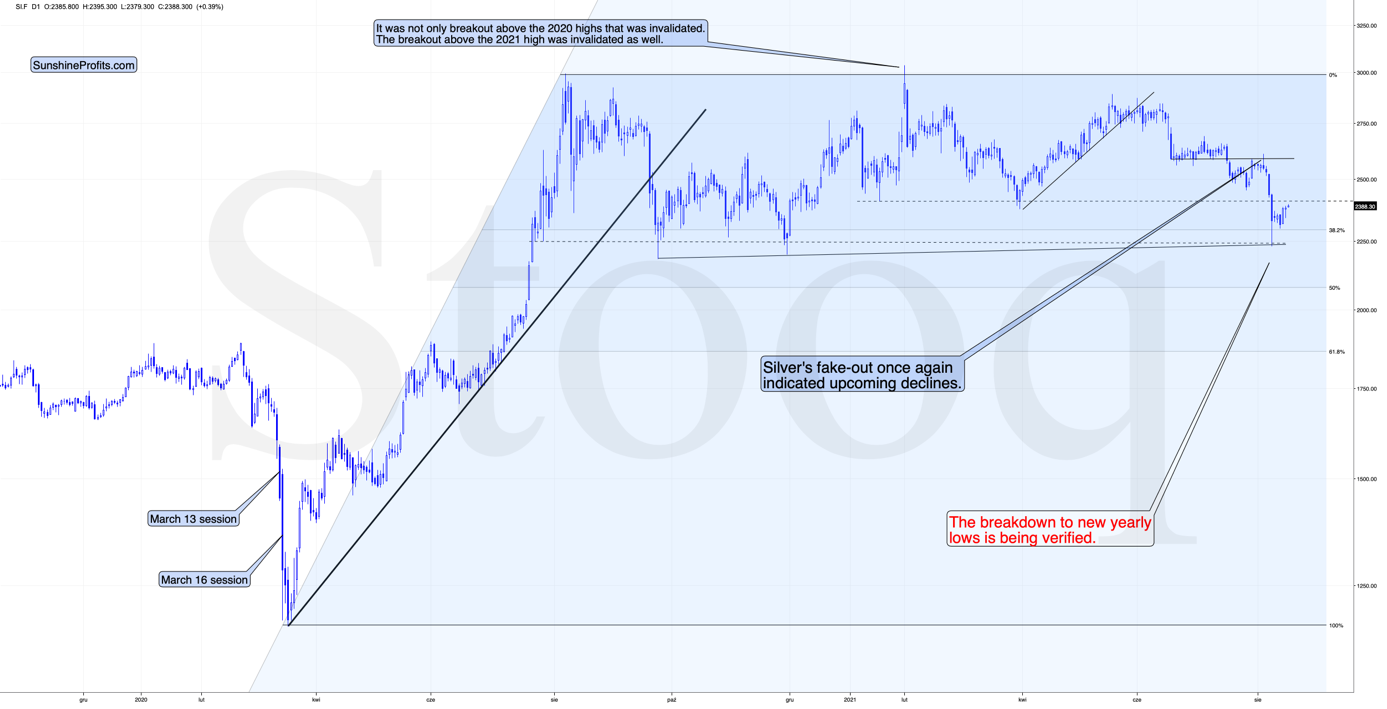
Silver has also confirmed the breakdown to new 2021 lows. Even though it came back up after declining profoundly, it didn’t move back above the previous 2021 lows in terms of the closing prices, nor did it move back above January intraday lows.
That’s a very bearish price action.
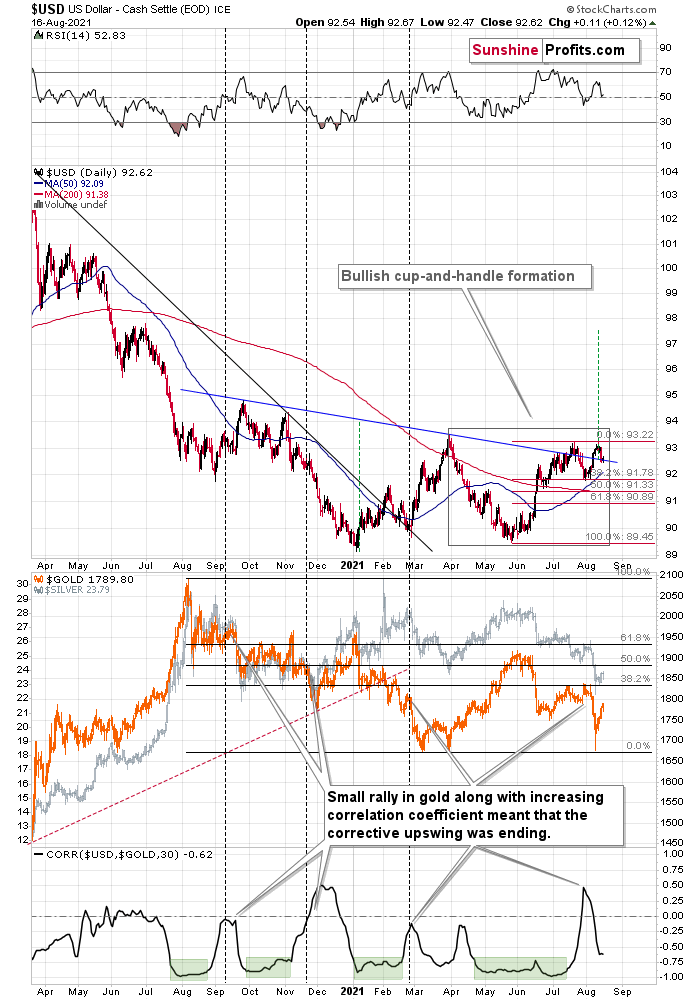
After surging above the neckline of its inverse (bullish) head & shoulders pattern, the USD Index backtested the breakout last week. In other words, the breakout was confirmed, and, so far this week, the USD Index has been moving slightly higher, further validating the above
Hold My Cup!
Please note that in addition to the inverse head-and-shoulders pattern in the USD Index, we can also see a bullish cup-and-handle pattern that I marked with a grey rectangle. This pattern confirms the bullish outlook for the US currency. Once the index gets above the previous 2021 highs, it’s likely to soar visibly once again – quite likely to the 97-98 range.
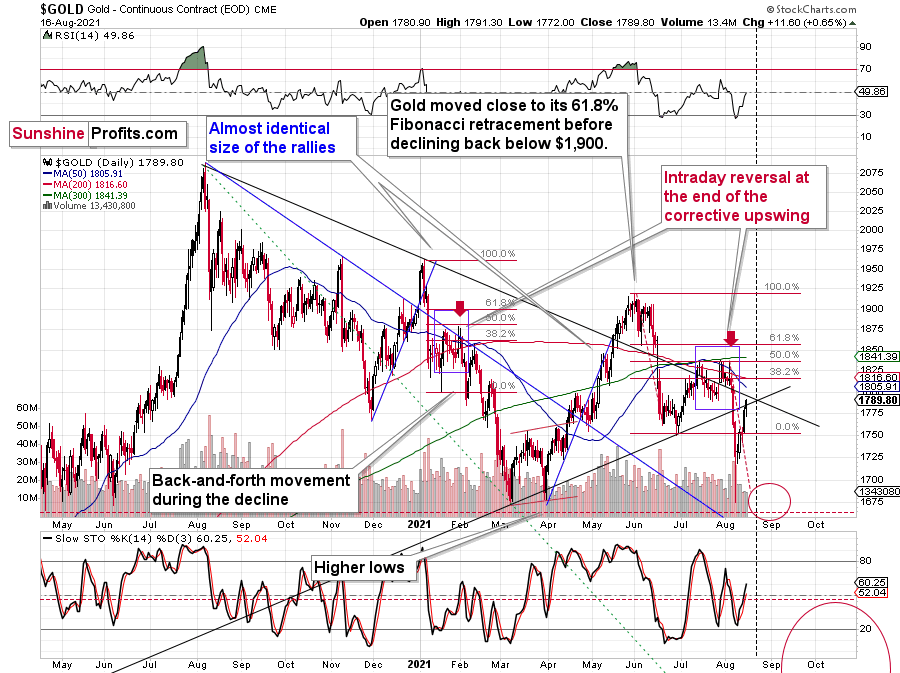
As I wrote earlier today, gold ended yesterday’s session $11.60 higher, and it has moved up by $6 so far today. Does it change much? While I honestly admit that this correction is a bit bigger than I expected it to be, it doesn’t change anything with regard to the outlook. It’s still just a corrective upswing within a bigger downtrend, in my view. And since the next triangle-vertex-based reversal is just around the corner (early next week), it wouldn’t be surprising to see a back and forth movement this week or even slightly higher gold prices. I don’t think it would change much though.
The short-term resistance is provided by the declining black line, as well as the mid-July lows and the $1,800 level, which is natural resistance, as it’s a round number.
Also, please note that gold has been mostly repeating its early-2021 performance. After declining sharply (January and June) and forming a double bottom with the second bottom slightly lower, it then corrected half of the decline forming more than one top close to the 50% retracement, and then declined sharply once again.
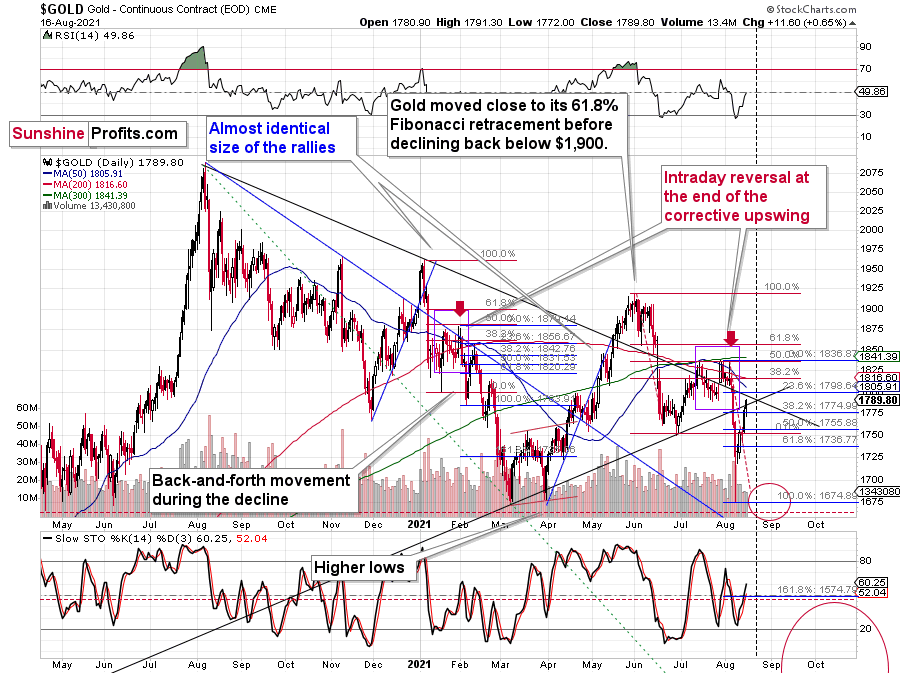
Back in February 2021, gold corrected about 76.4% of the decline (which is a less popular but still a Fibonacci retracement level – marked with blue). Right now, this retracement is just below the $1,800 mark. So, if history rhymes once again, gold will be likely to move close to $1,800 and then decline once again. At the moment of writing these words, gold is trading at $1,795 after having moved to $1797.15. So, the top could be in, and even if it’s not, it seems that it’s at hand.
Having said that, let’s take a look at the markets from a more fundamental angle.
Guilty Until Proven Innocent
With the ‘peak inflation’ narrative merging with the Delta variant, the economic disruption has the U.S. 10-Year Treasury yield patiently waiting for another upside (or downside) catalyst. However, while the deflationists focus all of their attention on used cars and trucks, lodging away from home (hotels, motels, etc.) and airfares – the areas of the Consumer Price Index (CPI) that are considered “transitory” – I’ve warned on several occasions that the Commodity Producer Price Index (PPI) is the most important indicator of where the inflation story is headed.
To explain, I wrote on Jun. 15:
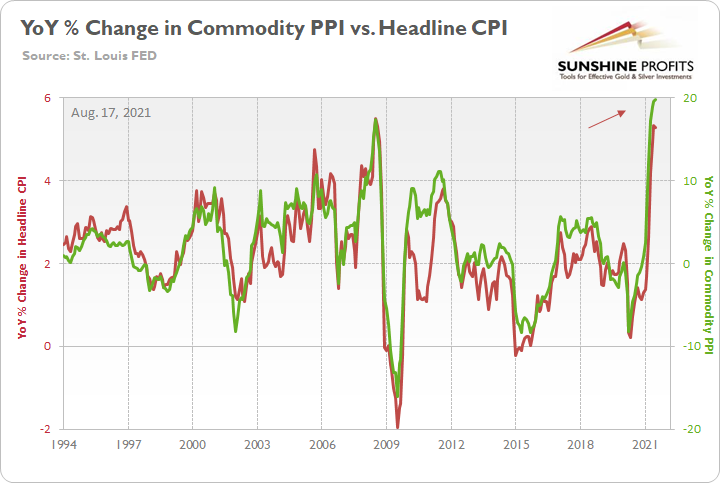
The commodity PPI often leads the headline CPI and that’s why tracking its movement is so important. If we analyze the performance of the pair during the inflationary surges of the 1970s and the early 1980s, it’s clear that the relationship has stood the test of time.
Please see below:
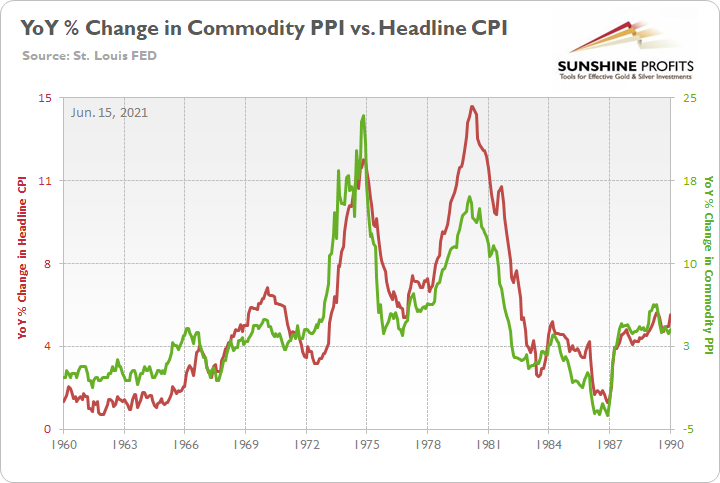
To explain, the green line above tracks the year-over-year (YoY) percentage change in the commodity PPI, while the red line above tracks the YoY percentage change in the headline CPI. If you analyze the relationship, you can see that the pair have a close connection.
More importantly, though, during the historical inflationary downpour, the month-over-month (MoM) percentage change in the commodity PPI never declined by more than 1.68%.
Please see below:
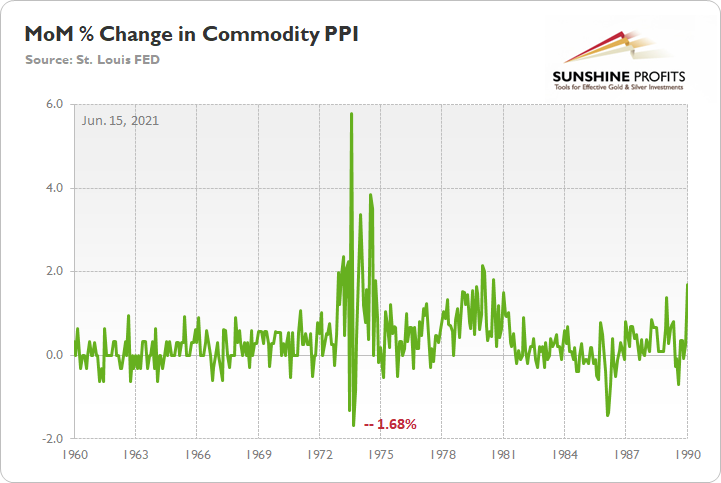
To explain, the green line above tracks the MoM percentage change in the commodity PPI. And if you compare the two MoM spikes in the commodity PPI to the two YoY spikes in the first chart above (focus your attention on the highs between 1972-1975 and 1978-1981), you can see that MoM resiliency helped sustain the YoY surges. In addition, during the roughly nine-year bout of inflation, the commodity PPI dipped in-and-out of negative territory but never fell off of a cliff.
Back to the present, with the commodity PPI rising by 1.2% MoM and 19.8% YoY (highest since 1974) on Aug. 12, the inflationary pressures remain abundant. Moreover, with the commodity PPI rising MoM in March, April, May, June and July 2021, the YoY percentage increase in July was actually higher than it was during the lockdown periods (“base effects”) of March, April and May 2020. Thus, input inflation is still accelerating even though “base effects” are no longer relevant. And with the merry-go-round still turning, the commodity PPI implies a headline CPI print of roughly 5.25% to 5.75% when the data is released on Sep. 14.
Please see below:
However, if inflation is so widespread, then why is the bond market happily watching its purchasing power whittle away? Well, for one, with the U.S. Federal Reserve’s (FED) reverse repurchase agreements (another $1.036 trillion sold on Aug. 16) draining liquidity from the system and the FED poised to taper its asset purchases in the coming months, bond investors have positioned for a significant slowdown in the U.S. economy. As a result, they’re willing to overlook inflation and, instead, position for a prospective economic collapse.
10-Year Treasury and Delta
However, while the data will ultimately determine the outcome in the coming months, the U.S. 10-Year Treasury yield may have already bottomed at roughly 1.1276%.
Please see below:
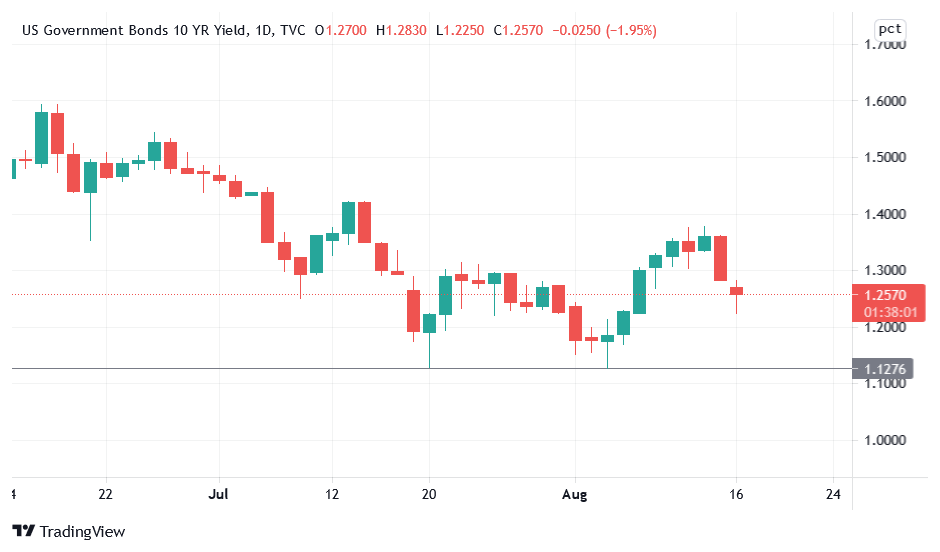
Second, with the Delta variant disrupting economic activity, the U.S. 10-Year Treasury yield lacks short-term upside catalysts. For example, U.S. states have re-imposed mask mandates (even for the vaccinated), prominent companies have delayed employees’ return to the office (Facebook, Chevron, BlackRock, etc.) and the University of Michigan’s Consumer Sentiment Index (released on Aug. 13) fell off a cliff.
An excerpt from the report read:
“Consumers reported a stunning loss of confidence in the first half of August. The Consumer Sentiment Index fell by 13.5% from July, to a level that was just below the April 2020 low of 71.8. Over the past half century, the Sentiment Index has only recorded larger losses in six other surveys, all connected to sudden negative changes in the economy.”
However:
“Consumers have correctly reasoned that the economy's performance will be diminished over the next several months, but the extraordinary surge in negative economic assessments also reflects an emotional response, mainly from dashed hopes that the pandemic would soon end. In the months ahead, it is likely that consumers will again voice more reasonable expectations, and with control of the Delta variant, shift toward outright optimism.”
Likewise, the fundamental section of the daily Gold & Silver Trading Alert includes a lot of data from reputable business reports. For example, I often include data from the regional FED banks’ surveys (New York, Richmond, Dallas, etc.), the PMI data from the ISM and IHS Markit as well as small businesses updates from the NFIB. However, it’s important to remember that the data reflects MoM changes. As such, if businesses are more optimistic in July than in June, the headline indices increase. Conversely, if businesses are more pessimistic in July than in June, the headline indices decrease. Thus, with the Delta variant surging since late July, MoM readings in August will likely decelerate and keep a lid on the U.S. 10-Year Treasury yield.
We Have a New Wave. But Do We Really?
However, with a depressed reading in one month offering an easier hurdle to overcome in the following month, once the negativity peaks, the lower readings will make it easier to produce higher highs over the medium term. Case in point: while the U.K. has been one of the hardest-hit regions by the Delta variant, the trend of ‘burning hot, but fast’ seems to be playing out. For example, if you analyze the right side of the chart below, you can see that after an initial surge, U.K. cases stabilized, and the deceleration began.
Please see below:
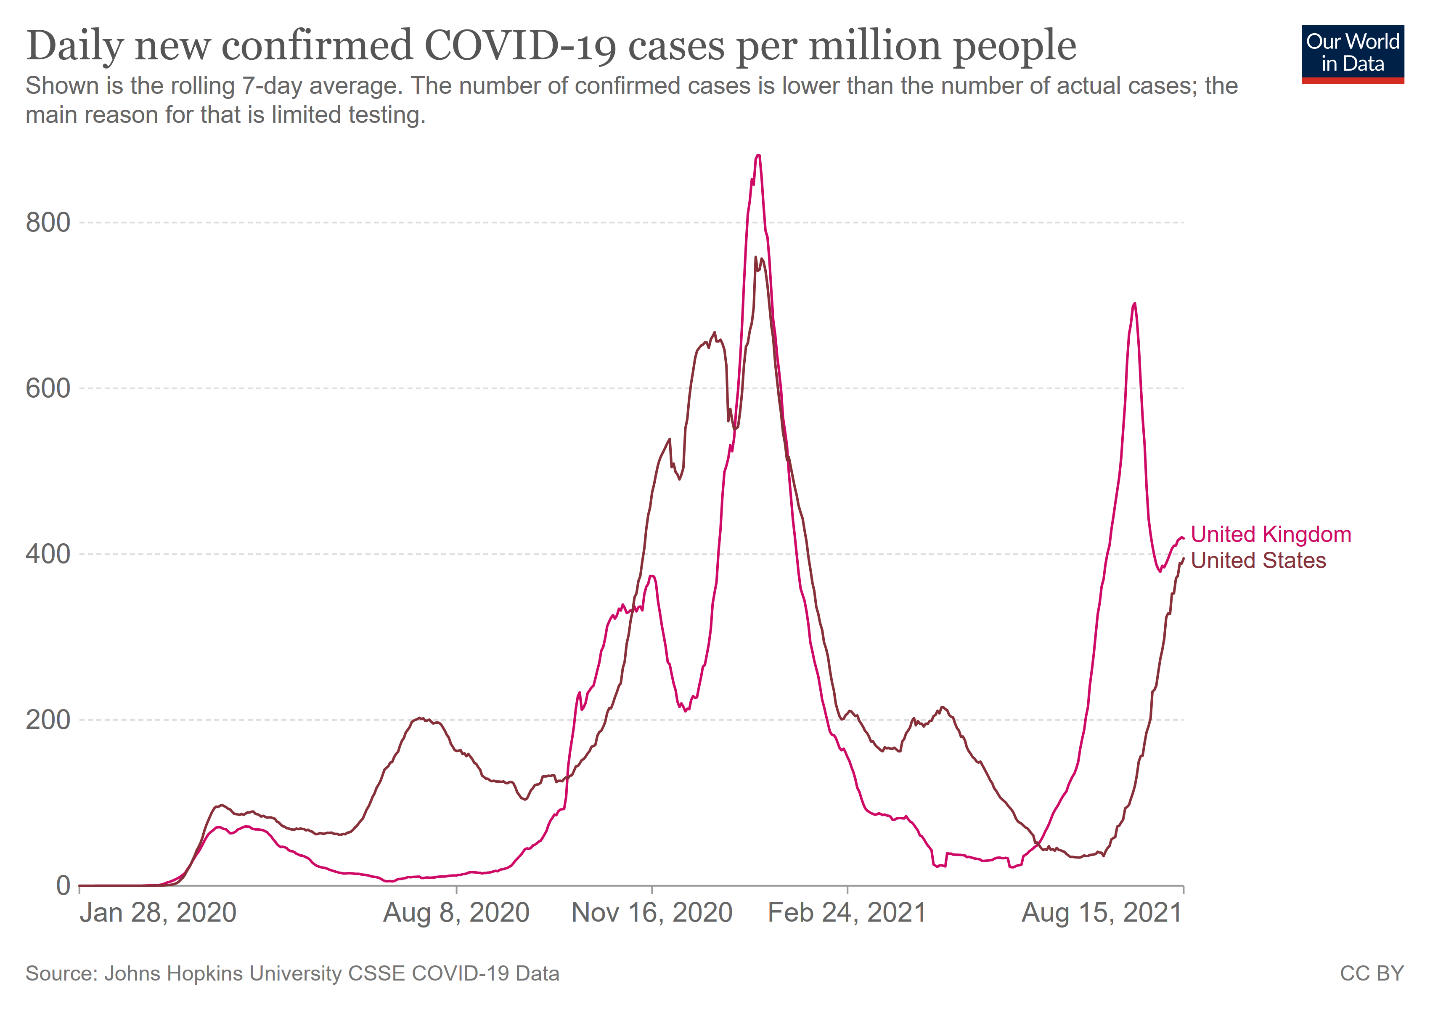
More importantly, though, while daily cases raged, daily hospitalizations in the U.K. remained low, and that indicates that vaccinations are having their desired effect and / OR that the herd immunity actually kicked in, and that the situation improved greatly mostly regardless of the vaccines. Either way, it seems that the threat this time is much lower than it was in 2020. For context, while it may seem from the chart below that the U.S. has a severe problem, it’s important to remember that there are roughly 330 million people in the U.S. and roughly 68 million people in the UK. As a result, hospitalizations as a percentage of the U.S. population are currently ~0.023% and hospitalizations as a percentage of the UK population are currently ~0.0086%.
Please see below:
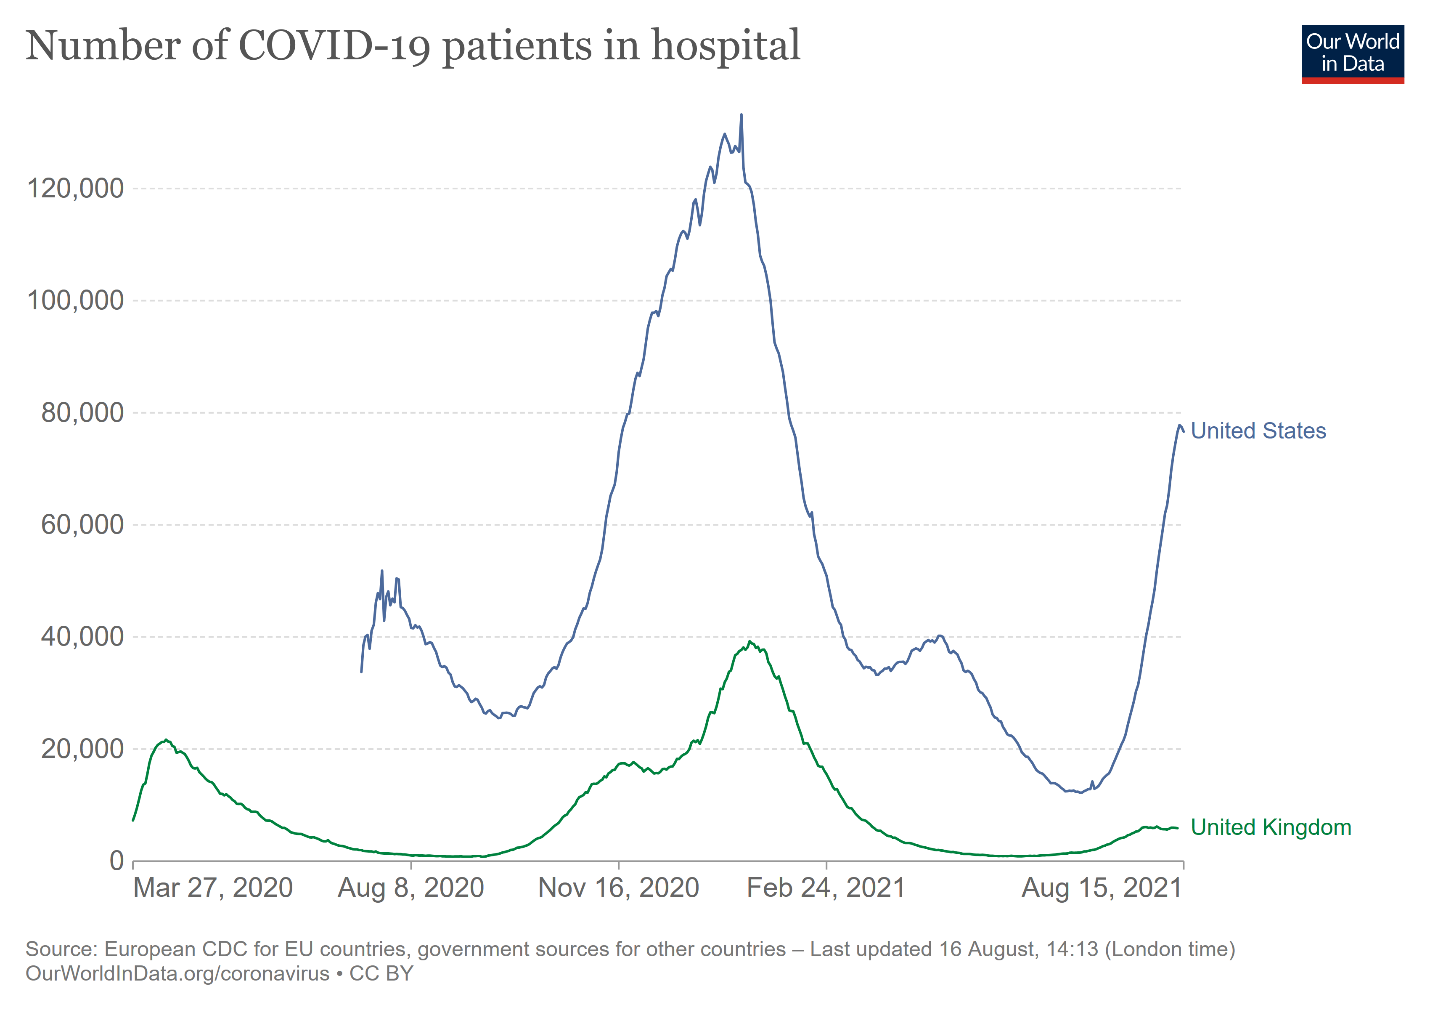
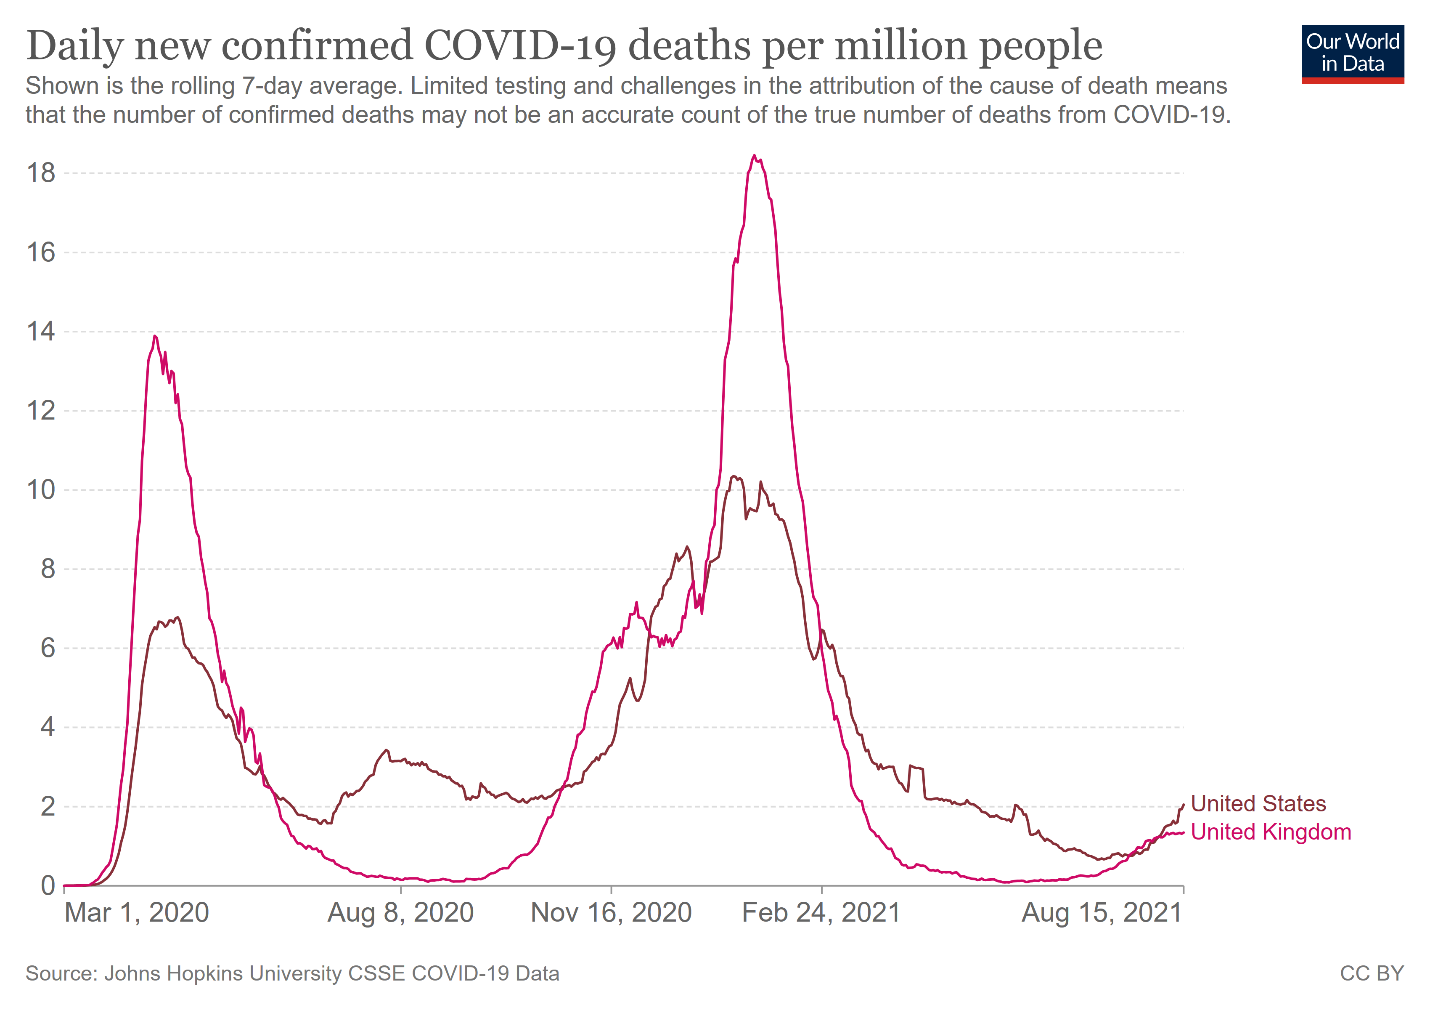
Even more revealing, while the UK’s vaccination rate is roughly 70%, and the U.S.’s is roughly 59% (the U.S. is playing catch-up), deaths in both regions have remained extremely low. As a result, it’s another indication that the recent surge in cases is much different than the health crisis that erupted in 2020.
What’s more, while Florida has been the epicenter of the recent spike, the seven-day average case counts across Florida’s largest counties are showing some signs of deceleration.
Please see below:
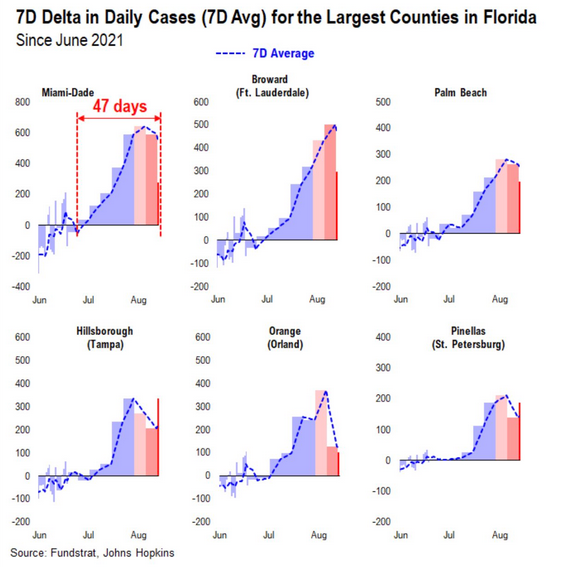
On top of that, while the fully-vaccinated population rate is roughly 50% in Florida and 54% in California, the L.A. County Department of Public Health found that fully-vaccinated individuals haven’t been affected by the Delta variant. Thus, as U.S. vaccination rates accelerate, the economic impact of the Delta variant should decelerate.
Please see below:
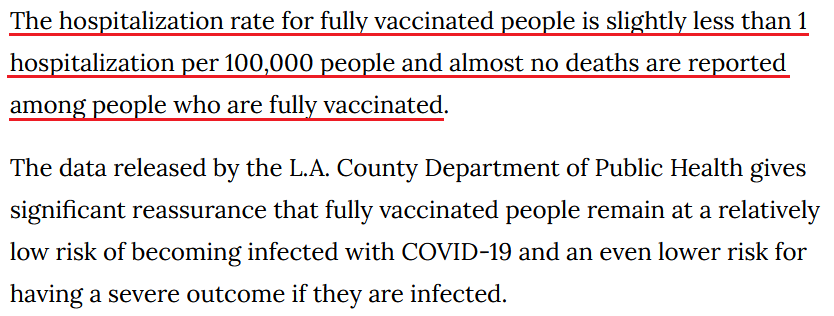 Source: KTLA
The bottom line? The U.S. 10-Year Treasury yield weighed down by rational skepticism, the FED’s liquidity drain, taper timeline and the Delta variant have depressed economic sentiment. As a result, the U.S. economy will have to prove its durability and bond investors will not give it the benefit of the doubt. However, while the impact of the Delta variant remains real, it’s likely another bump in the road. And once vaccination rates progress to the point where the reopening can occur in full (or we are already there as the key is the herd immunity that was achieved regardless of the vaccinations), sustained labor market progress and renewed economic momentum will likely confront the bond market over the medium term. As a result, the mosaic of fundamentals implies a medium-term target for the U.S. 10-Year Treasury yield of 1.75%.
Finally, let’s keep in mind that it’s actually the fear of the consequences of the pandemic that really matters as far as price changes are concerned. And the fear was mostly absent even during the second wave of the coronavirus. The first wave (first half of 2020) sparked immense fear, and the markets reacted profoundly. The second wave generated only a small amount of fear. And this time, it seems to me that whatever happens (unless it’s epic, and I don’t expect it to be), it will be mostly ignored. In other words, I don’t think that paying a lot of attention to the Covid-19 cases is justified anymore. The real-life consequences of the pandemic are likely close to being over, and the fear thereof is probably almost over.
In conclusion, gold and the gold miners went their separate ways once again on Aug. 16, with the latter accelerating their underperformance. And with the PMs unable to gain any sustained momentum even with the Delta variant raging, and turmoil erupting in Afghanistan, their medium-term outlooks remain profoundly bearish. With the U.S. 10-Year Treasury yield still trading at an all-time low relative to realized inflation, an uptick in real yields could add to the PMs’ ills. Furthermore, if the Delta variant fades and U.S. nonfarm payrolls accelerate in September, the FED’s taper timeline may ratchet up once again.
Overview of the Upcoming Part of the Decline
- The corrective upswing in gold is over, and the big decline seems to be already underway.
- After miners slide in a meaningful and volatile way, but silver doesn’t (and it just declines moderately), I plan to switch from short positions in miners to short positions in silver. At this time, it’s too early to say at what price levels this would take place – perhaps with gold close to $1,600. I plan to exit those short positions when gold shows substantial strength relative to the USD Index, while the latter is still rallying. This might take place with gold close to $1,350 - $1,500 and the entire decline (from above $1,900 to about $1,475) would be likely to take place within 6-20 weeks, and I would expect silver to fall the hardest in the final part of the move. This moment (when gold performs very strongly against the rallying USD and miners are strong relative to gold – after gold has already declined substantially) is likely to be the best entry point for long-term investments, in my view. This might also happen with gold close to $1,475, but it’s too early to say with certainty at this time.
- As a confirmation for the above, I will use the (upcoming or perhaps we have already seen it?) top in the general stock market as the starting point for the three-month countdown. The reason is that after the 1929 top, gold miners declined for about three months after the general stock market started to slide. We also saw some confirmations of this theory based on the analogy to 2008. All in all, the precious metals sector would be likely to bottom about three months after the general stock market tops.
- The above is based on the information available today, and it might change in the following days/weeks.
Please note that the above timing details are relatively broad and “for general overview only” – so that you know more or less what I think and how volatile I think the moves are likely to be – on an approximate basis. These time targets are not binding or clear enough for me to think that they should be used for purchasing options, warrants or similar instruments.
Letters to the Editor
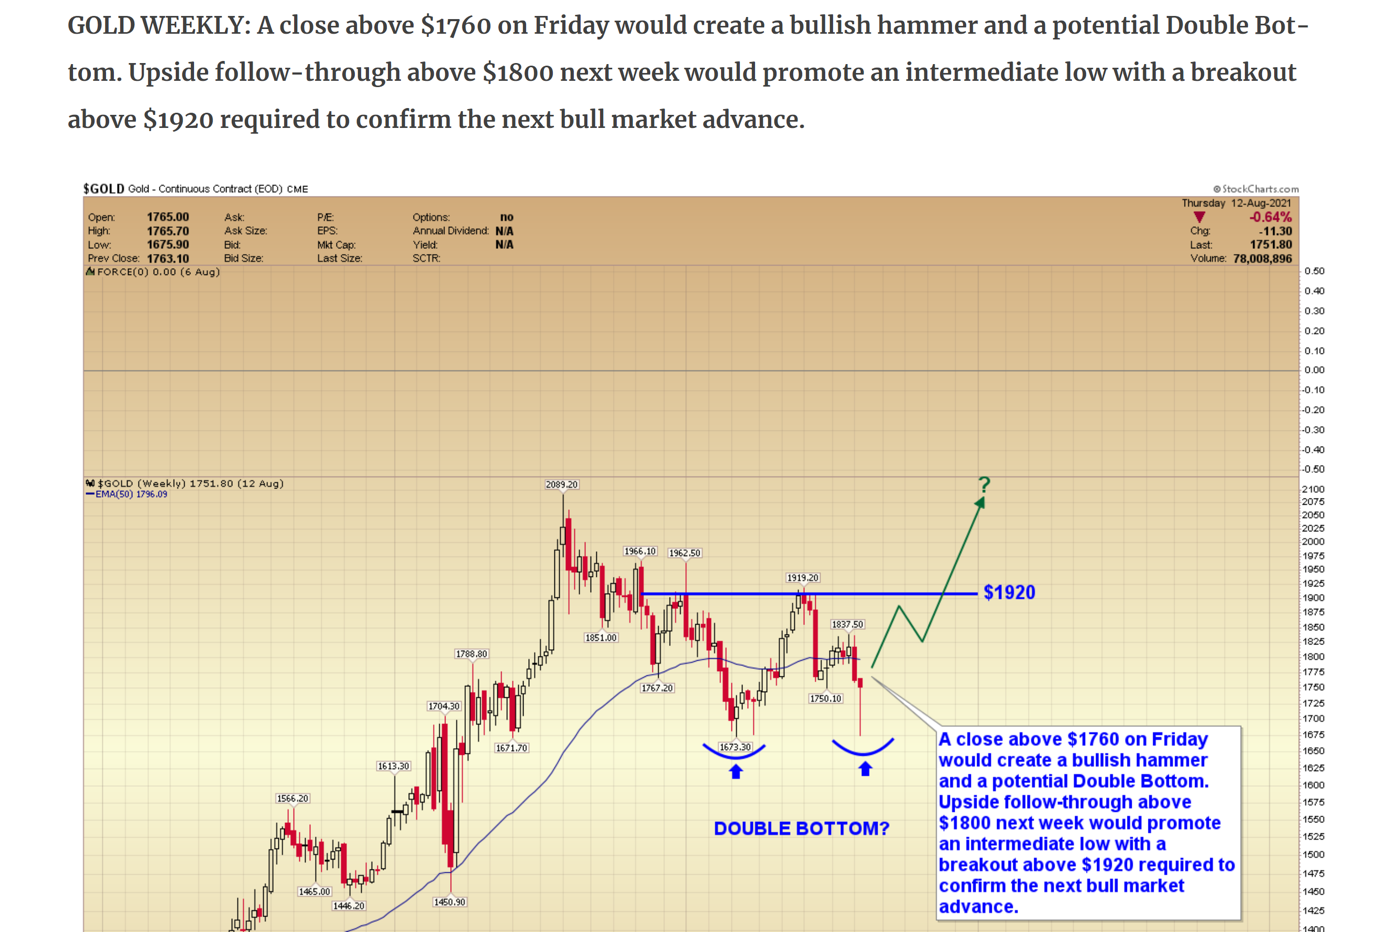
Q: Thanks for the detailed daily analysis. I would appreciate it if you could comment on the bullish hammer (weekly chart) below. The author seems to be "always bullish" in gold, but the weekly candle close left me a bit intrigued.
Thanks for your time.
A: I commented on that bullish hammer candlestick yesterday. The flagship analyses, such as yesterday’s issue, are long, so it’s sometimes difficult to find a specific feature. Here’s a quote of the relevant part:
As further evidence, the breakdown is even clearer when we zoom in on the weekly chart. If you analyze the weakness below, you can see that the yellow metal remains firmly below the thick black line. Moreover, while gold rose slightly above the dashed rising support line (which connects the intraday lows), the latter is not as important as the former. More importantly, though, major reversals are validated when they occur on high volume. And given the minimal euphoria that we witnessed last week, the bullish fervor simply wasn’t there. Thus, while the yellow metal recorded a bullish hammer (reversal) candlestick last week – which often predicts trend reversals – the relatively weak volume should make one not accept the bullish candlestick at its face value. Especially that other markets didn’t confirm gold’s reversal.
What’s more, despite the ‘flash crash’ and all of the volatility that surrounded the precious metals last week, gold only rose by ~$15. And with gold mining stocks drastically underperforming the yellow metal – which is one of the most important indicators of medium-term declines – the relative weakness signals that lower lows will likely materialize over the next few weeks/months.
Please see below:
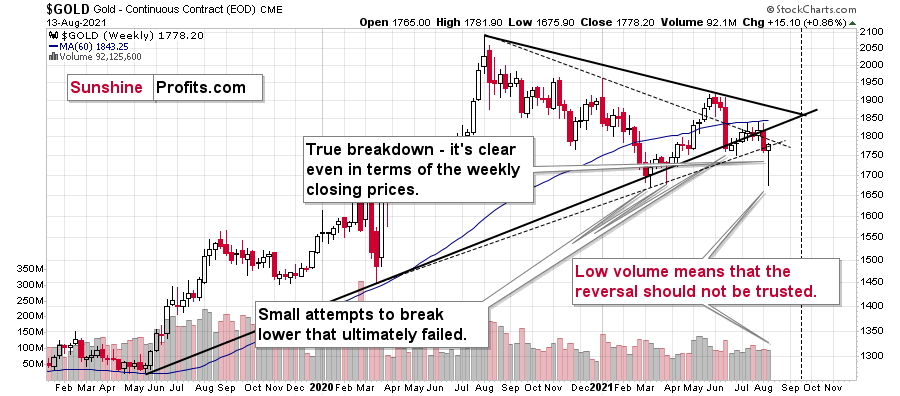
The “other markets” that didn’t confirm gold’s reversal are silver, mining stocks and also the USD Index. In particular, junior miners and silver verified the breakdowns below their previous 2021 lows, while the USD Index verified the breakout above its inverse head-and-shoulders pattern. It ended Friday’s session at the neckline, not below it. All this indicates that gold’s performance last week was much more accidental than game-changing. In particular, the fact that gold stocks declined while gold rallied ~$15 makes the outlook bearish, not bullish, despite the hammer reversal candlestick.
Here's one additional thing that’s worth to keep in mind. We are in the analogy to the 2012-2013 decline, so let’s check if there was any weekly reversal back then, and if so, what followed it.
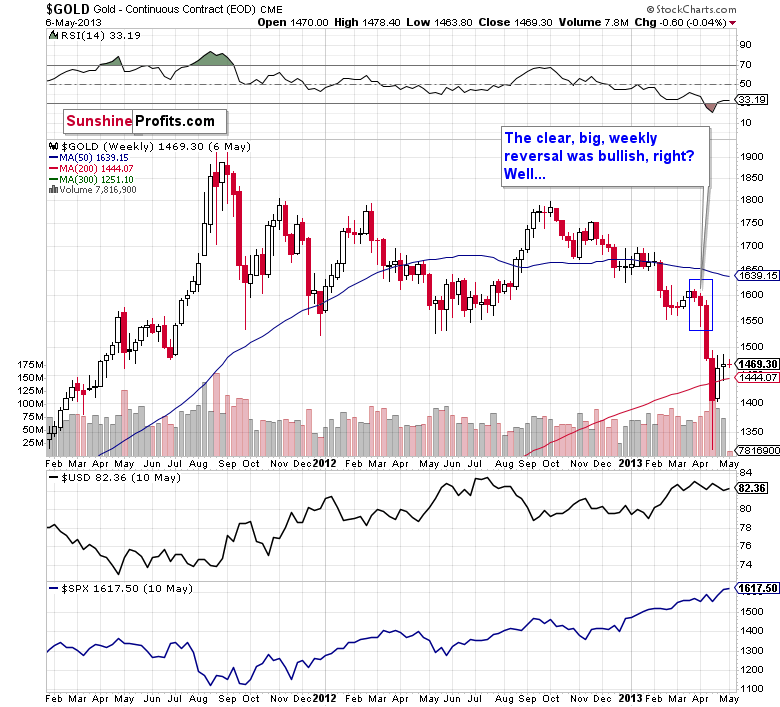
Well… there was just one clear weekly reversal that we saw in the first half of 2013. And we saw it right before the biggest part of the decline. It was a fake reversal that just tricked people into believing that the bottom was in. It wasn’t in. It was far from it.
Now, I’m not saying that gold will definitely plunge this week. The history doesn’t repeat itself to the letter – it rather rhymes. Consequently, it could be the case that we see some more back and forth trading. However, gold stocks’ performance is extremely clear as to what the next big move is going to be. And small strength here is likely to be very temporary.
On a side note, you wrote about the author being “always bullish” on gold, which reminded me that people on some forums claim that I’m always bearish on gold. If you encounter those comments and want to correct them, here’s a link to the analysis where I bought gold miners practically right at the bottom, on March 4, 2021. I’m not sure if the discussion would be effective, though, as it seems to me that many of those who write such things have the “my mind is made up, don’t confuse me with facts” mentality.
Q (actually, multiple questions; I will answer them one by one): On a weekly time frame, gold formed a massive bull candle. Does this indicate a gold rally ahead? What do you think of reversal areas/prices of gold in case there is a short-term bounce?
A1: I commented on that above, and I discussed the upside targets in the main part of the analysis.
Do you have an area of price where gold shorts need to be closed?
A2: Yes, you will find it in the “Trading” section, below the summary. It’s at $1,683 (the same level at which those shorting gold took profits recently). If it’s a stop-loss level that you’re asking about, then no, we don’t have one for this trade. I base my trades mostly on other factors than the price of the given asset (for example, its relative performance), so it is rarely the case that the price level itself could change the outlook. It could be the case every now and then, but it’s not the case this time. As a reminder, I’m not featuring a short position in gold, but a short position in gold junior mining stocks, as I think the risk to reward ratio in the latter is much more promising. The details for gold/silver are for your information only – in case you really want to use the metals instead of miners or are simply unable to short junior miners.
Also, the Covid cases in the USA are increasing, don't you think this could put upward pressure on gold and downward pressure on yields?
Finally, what is your medium-to-long-term view on the US10 year yield? Yields could crash if poor economic data pours in the coming months, which I think is highly unlikely.
So, most likely, yields are going to bottom in the coming months. What area do you think they might find floor? Can you do an analysis on the US10 year yield curve next week along with gold?
A3: I discussed most of the above in today’s fundamental section, and I will feature the 10-year yield chart in tomorrow’s technical section. I hope you found that analysis useful.
Summary
To summarize, the corrective upswing in gold is over, and it seems that the big downswing in gold, silver, and mining stocks is already underway. I previously warned you that “the next few days may (!) bring some back-and-forth action instead of the decline’s continuation,” and I also wrote that it was unlikely that this would take place for long. It seems that it is exactly what happened – we saw some back and forth action, and while gold’s last week’s performance might seem bullish at first glance, neither gold’s volume, nor action in silver nor mining stocks confirm it. In fact, silver’s and junior miners’ breakdowns to new yearly lows were confirmed.
Based on the self-similar pattern in gold (similarity is mostly to the 2011-2013 period), gold is likely to decline to its previous 2021 lows relatively soon, even if it doesn’t happen right away. Based on the analogies to the recent past, it seems quite likely that gold will move lower in the following days and bottom in the second half of August.
It seems that our profits from the short position in the junior mining stocks are going to grow substantially in the following weeks.
After the sell-off (that takes gold to about $1,350 - $1,500), I expect the precious metals to rally significantly. The final part of the decline might take as little as 1-5 weeks, so it's important to stay alert to any changes.
Most importantly, please stay healthy and safe. We made a lot of money last March and this March, and it seems that we’re about to make much more on the upcoming decline, but you have to be healthy to enjoy the results.
As always, we'll keep you - our subscribers - informed.
To summarize:
Trading capital (supplementary part of the portfolio; our opinion): Full speculative short positions (300% of the full position) in mining stocks are justified from the risk to reward point of view with the following binding exit profit-take price levels:
Mining stocks (price levels for the GDXJ ETF): binding profit-take exit price: $37.12; stop-loss: none (the volatility is too big to justify a stop-loss order in case of this particular trade)
Alternatively, if one seeks leverage, we’re providing the binding profit-take levels for the JDST (2x leveraged) and GDXD (3x leveraged – which is not suggested for most traders/investors due to the significant leverage). The binding profit-take level for the JDST: $15.96; stop-loss for the JDST: none (the volatility is too big to justify a SL order in case of this particular trade); binding profit-take level for the GDXD: $37.02; stop-loss for the GDXD: none (the volatility is too big to justify a SL order in case of this particular trade).
For-your-information targets (our opinion; we continue to think that mining stocks are the preferred way of taking advantage of the upcoming price move, but if for whatever reason one wants / has to use silver or gold for this trade, we are providing the details anyway.):
Silver futures upside profit-take exit price: unclear at this time - initially, it might be a good idea to exit, when gold moves to $1,683
Gold futures upside profit-take exit price: $1,683
HGD.TO – alternative (Canadian) inverse 2x leveraged gold stocks ETF – the upside profit-take exit price: $12.88
Long-term capital (core part of the portfolio; our opinion): No positions (in other words: cash
Insurance capital (core part of the portfolio; our opinion): Full position
Whether you already subscribed or not, we encourage you to find out how to make the most of our alerts and read our replies to the most common alert-and-gold-trading-related-questions.
Please note that we describe the situation for the day that the alert is posted in the trading section. In other words, if we are writing about a speculative position, it means that it is up-to-date on the day it was posted. We are also featuring the initial target prices to decide whether keeping a position on a given day is in tune with your approach (some moves are too small for medium-term traders, and some might appear too big for day-traders).
Additionally, you might want to read why our stop-loss orders are usually relatively far from the current price.
Please note that a full position doesn't mean using all of the capital for a given trade. You will find details on our thoughts on gold portfolio structuring in the Key Insights section on our website.
As a reminder - "initial target price" means exactly that - an "initial" one. It's not a price level at which we suggest closing positions. If this becomes the case (like it did in the previous trade), we will refer to these levels as levels of exit orders (exactly as we've done previously). Stop-loss levels, however, are naturally not "initial", but something that, in our opinion, might be entered as an order.
Since it is impossible to synchronize target prices and stop-loss levels for all the ETFs and ETNs with the main markets that we provide these levels for (gold, silver and mining stocks - the GDX ETF), the stop-loss levels and target prices for other ETNs and ETF (among other: UGL, GLL, AGQ, ZSL, NUGT, DUST, JNUG, JDST) are provided as supplementary, and not as "final". This means that if a stop-loss or a target level is reached for any of the "additional instruments" (GLL for instance), but not for the "main instrument" (gold in this case), we will view positions in both gold and GLL as still open and the stop-loss for GLL would have to be moved lower. On the other hand, if gold moves to a stop-loss level but GLL doesn't, then we will view both positions (in gold and GLL) as closed. In other words, since it's not possible to be 100% certain that each related instrument moves to a given level when the underlying instrument does, we can't provide levels that would be binding. The levels that we do provide are our best estimate of the levels that will correspond to the levels in the underlying assets, but it will be the underlying assets that one will need to focus on regarding the signs pointing to closing a given position or keeping it open. We might adjust the levels in the "additional instruments" without adjusting the levels in the "main instruments", which will simply mean that we have improved our estimation of these levels, not that we changed our outlook on the markets. We are already working on a tool that would update these levels daily for the most popular ETFs, ETNs and individual mining stocks.
Our preferred ways to invest in and to trade gold along with the reasoning can be found in the how to buy gold section. Furthermore, our preferred ETFs and ETNs can be found in our Gold & Silver ETF Ranking.
As a reminder, Gold & Silver Trading Alerts are posted before or on each trading day (we usually post them before the opening bell, but we don't promise doing that each day). If there's anything urgent, we will send you an additional small alert before posting the main one.
Thank you.
Przemyslaw Radomski, CFA
Founder, Editor-in-chief

