

Briefly: in our opinion, full (250% of the regular size of the position) speculative short positions in gold, silver and mining stocks are justified from the risk/reward perspective at the moment of publishing this alert.
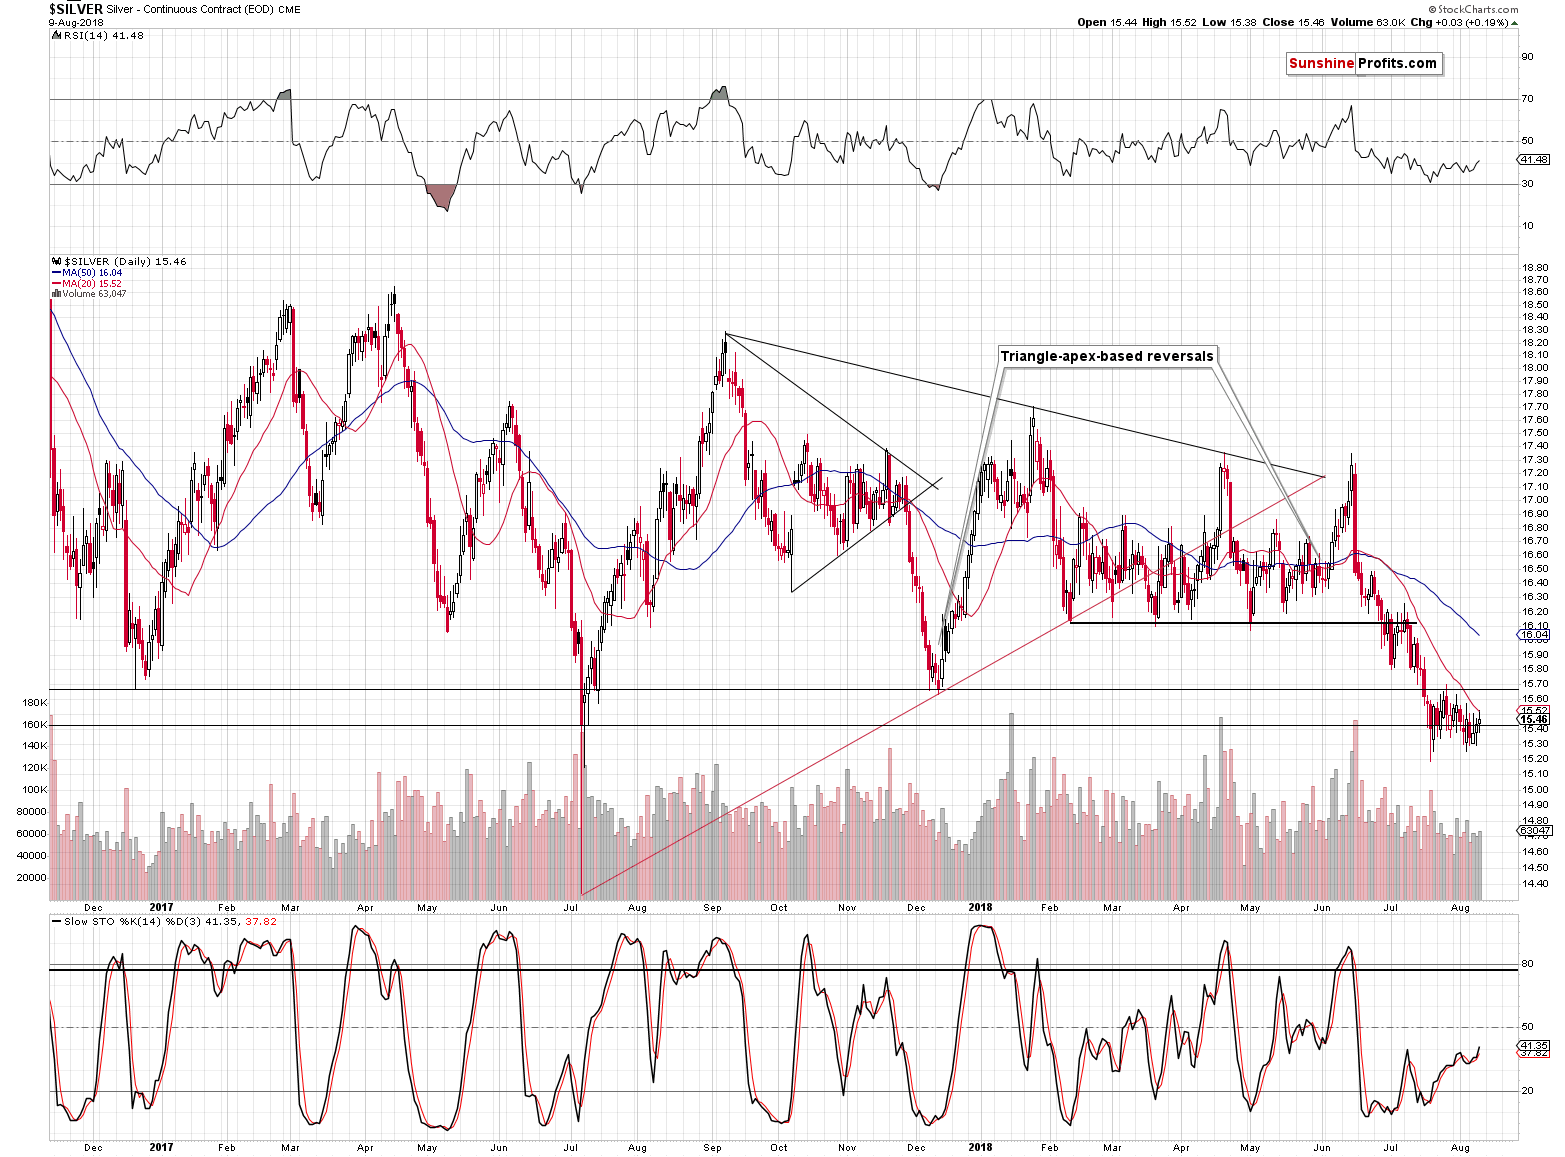
In Wednesday’s analysis, we discussed the breakdown in silver and how the white metal managed to close below the $15.43 level (July 2017 bottom) for two days in a row for the first time since early 2016. The move was not fully verified by the 3-day rule on the third day, silver closed right at the $15.43. Yesterday – on day four – silver closed above this important support and thus the breakdown was invalidated. That’s a classic buy signal, which suggests that a big rebound is just around the corner. But is it?
Let’s take a look at the silver chart for more details (charts courtesy of http://stockcharts.com).
In yesterday’s Alert, we wrote the following:
If silver closes below $15.43 today, the breakdown will be confirmed, if it closes above it, it will be invalidated. If the invalidation is significant, it will likely serve as a buy signal.
The invalidation wasn’t significant. Silver closed only 3 cents higher, which is next to nothing. And it’s trading below $15.30 at the moment of writing these words. This is the opposite of significant invalidation.
What we saw was either an invalidation that failed to trigger a rally and we have a new breakdown today, or we didn’t see a real invalidation so far, as it was too small and not accompanied by any confirmations.
In both cases, the outlook doesn’t change and our previous comments remain up-to-date:
Invalidations tend to be followed by rapid reactions. We are definitely missing it in silver. If the white metal wanted to soar from here, it would already be soaring, just like what happened after the sharp turnaround in July 2017. Nothing like that is happening and it seems that the decline has further to go.
Silvers’ move higher is not only missing bullish confirmations, it was actually accompanied by more bearish signs.
Precious Metals’ Relative Performance
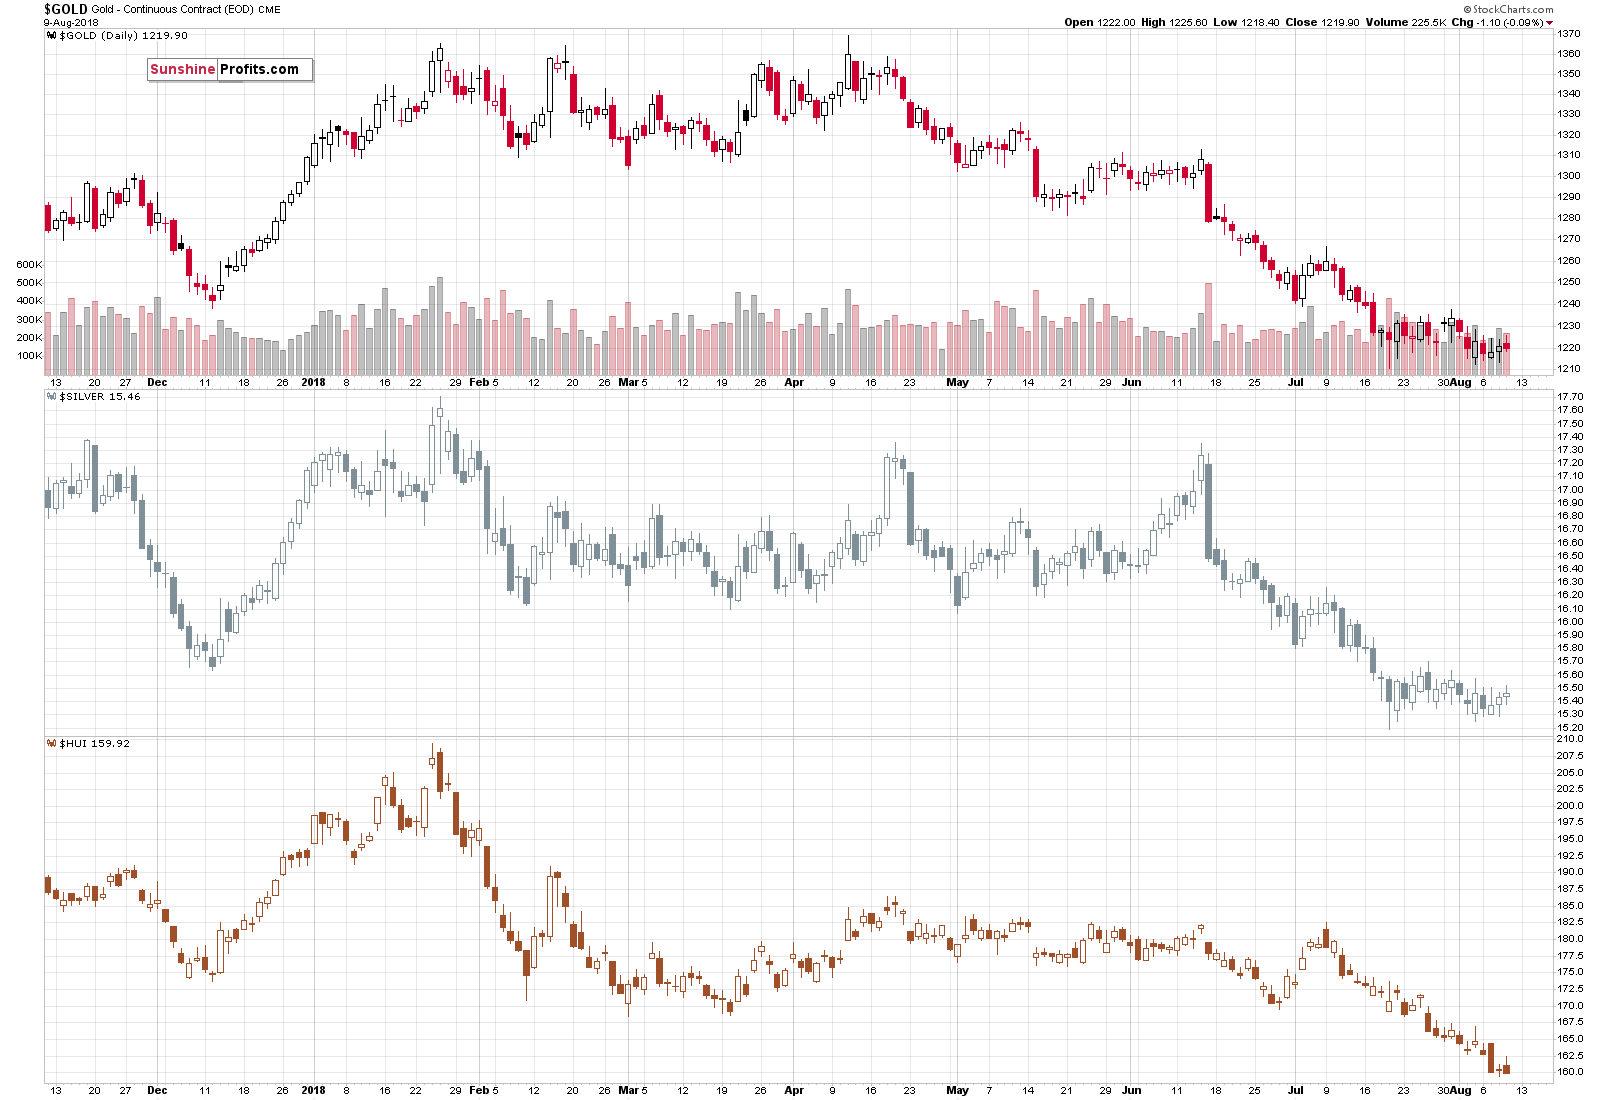
As you can see on the above chart, gold stocks have once again underperformed by moving to new lows, while silver was the strongest out of the gold, silver, and miners trio. We wrote about it numerous times, and we’ll write it again, because seeing this factor again makes the bearish case stronger. Silver tends to outperform, and miners tend to underperform gold right before declines. The bigger the scale, the stronger the signal and the implications. We saw the above bearish relativity-based sign multiple times in the past weeks, which makes the outlook very bearish.
Gold Stocks Breakdown
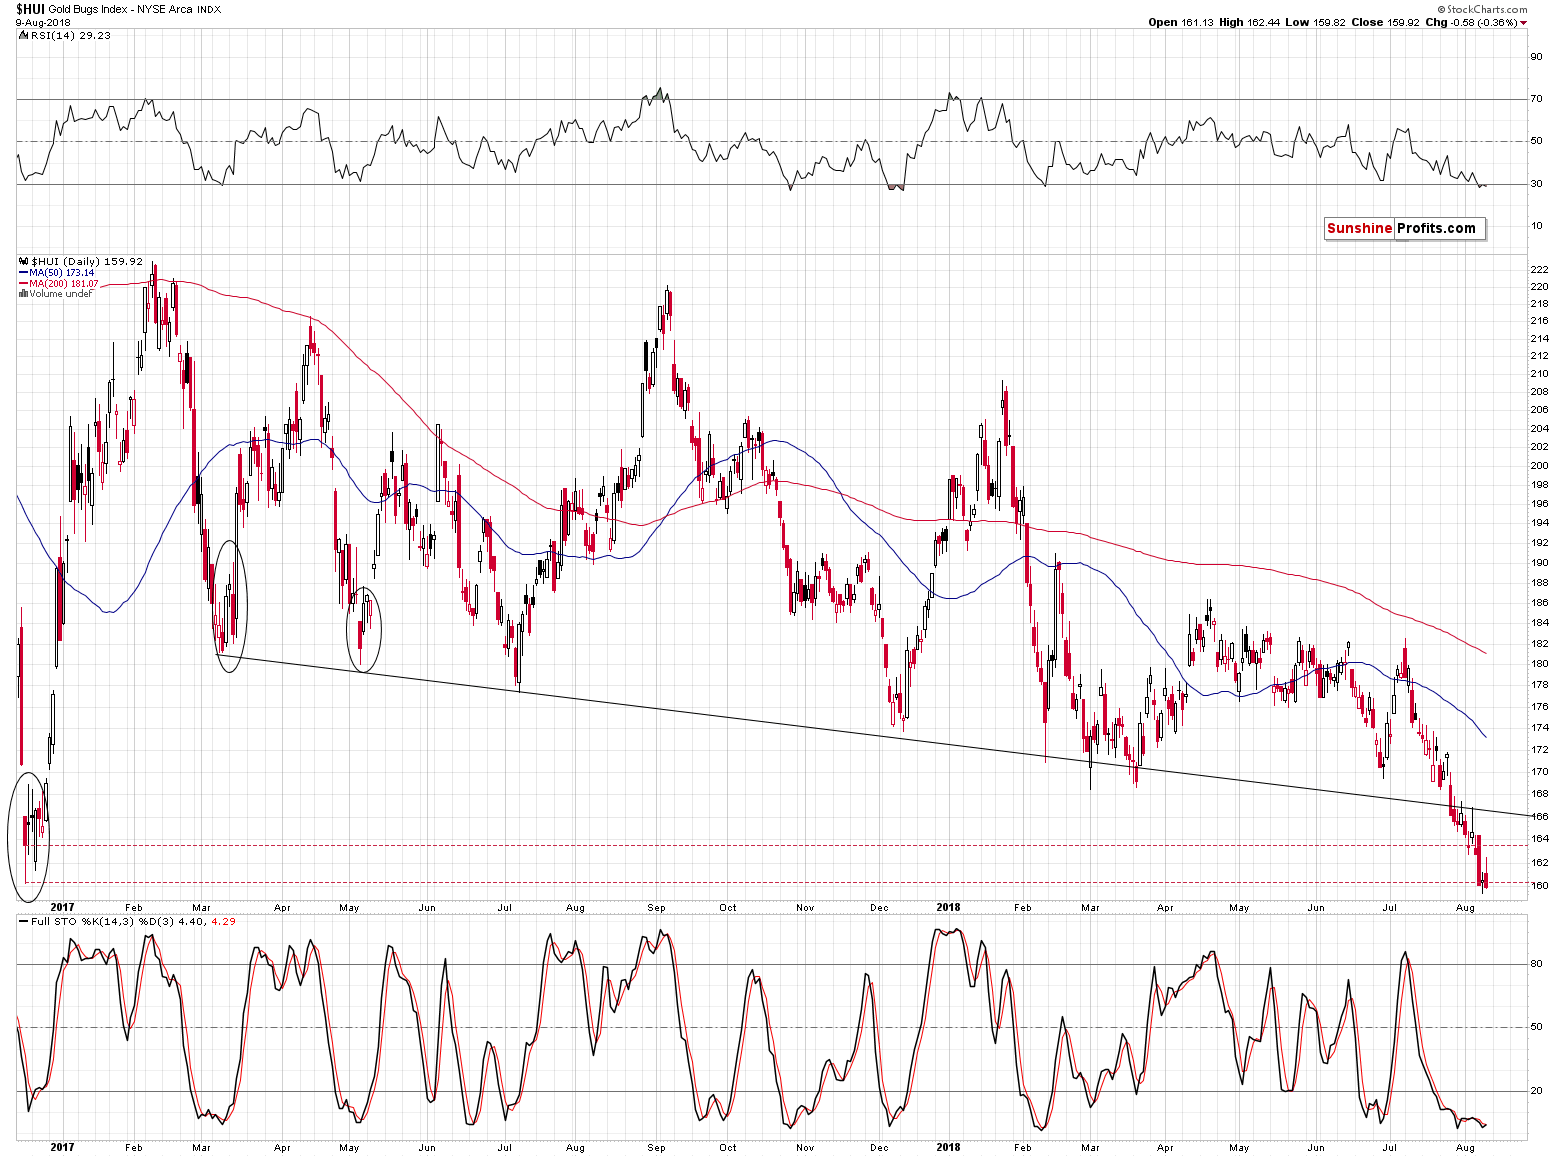
Despite the early-session strength, gold stocks ended the day lower – at new 2018 lows, which is another bearish sign. There was an attempt for the gold stock bulls to trigger a rally and they were overwhelmed by the sellers.
In terms of the daily closing prices, the breakdown below the late 2016 low is now more than confirmed and since the HUI Index is also below the late-2016 low in intraday terms, the situation is even more bearish.
But is there any sign that the decline is really going to accelerate now?
Enter the USD Index.
Soaring USD and Its Implications
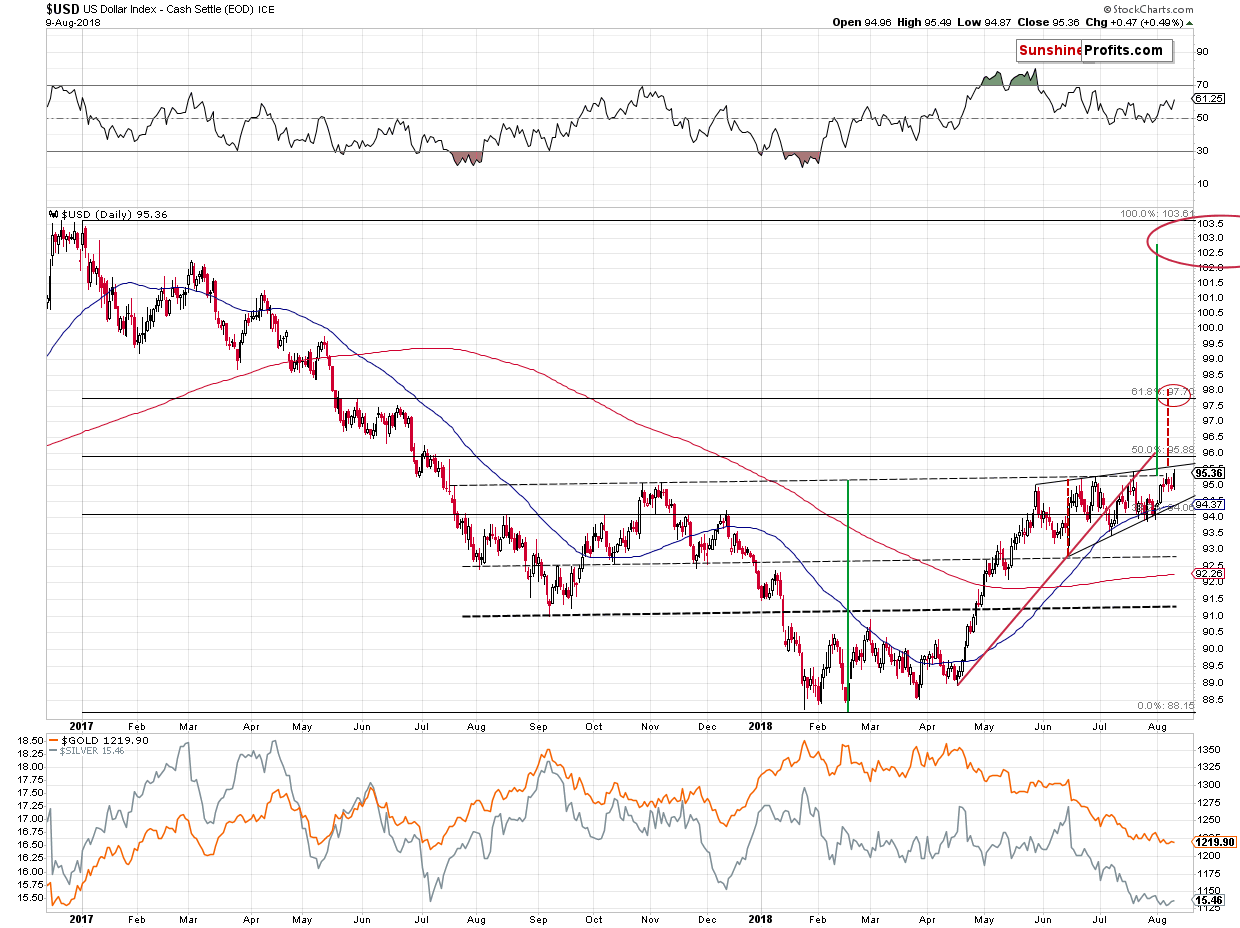
The USD Index moved higher yesterday and it’s rallying also today. It’s now practically right at the upper border of the rising wedge pattern and it’s above the neck level of the reverse head-and-shoulders formation. Technically, this means that the big reverse H&S pattern was just completed. However, the breakout above the neck level is not yet confirmed, so it’s too early to say that the implications are extremely bullish.The outlook has definitely improved, though.
In other words, our Monday’s comments are up-to-date:
The USD Index has been moving back and forth since late May. Under normal conditions, gold and silver should have been trading back and forth as well, mimicking the U.S. currency. But that’s not what happened. Gold is almost $100 lower than it was in late May and silver declined substantially as well. This shows great weakness of the precious metals sector and vulnerability to further declines if the USD Index was to continue its medium-term rally.
The thing is that it is indeed likely to continue its big, medium-term rally based on the analogy to the previous sharp upswings, especially the one that we saw in 2014.
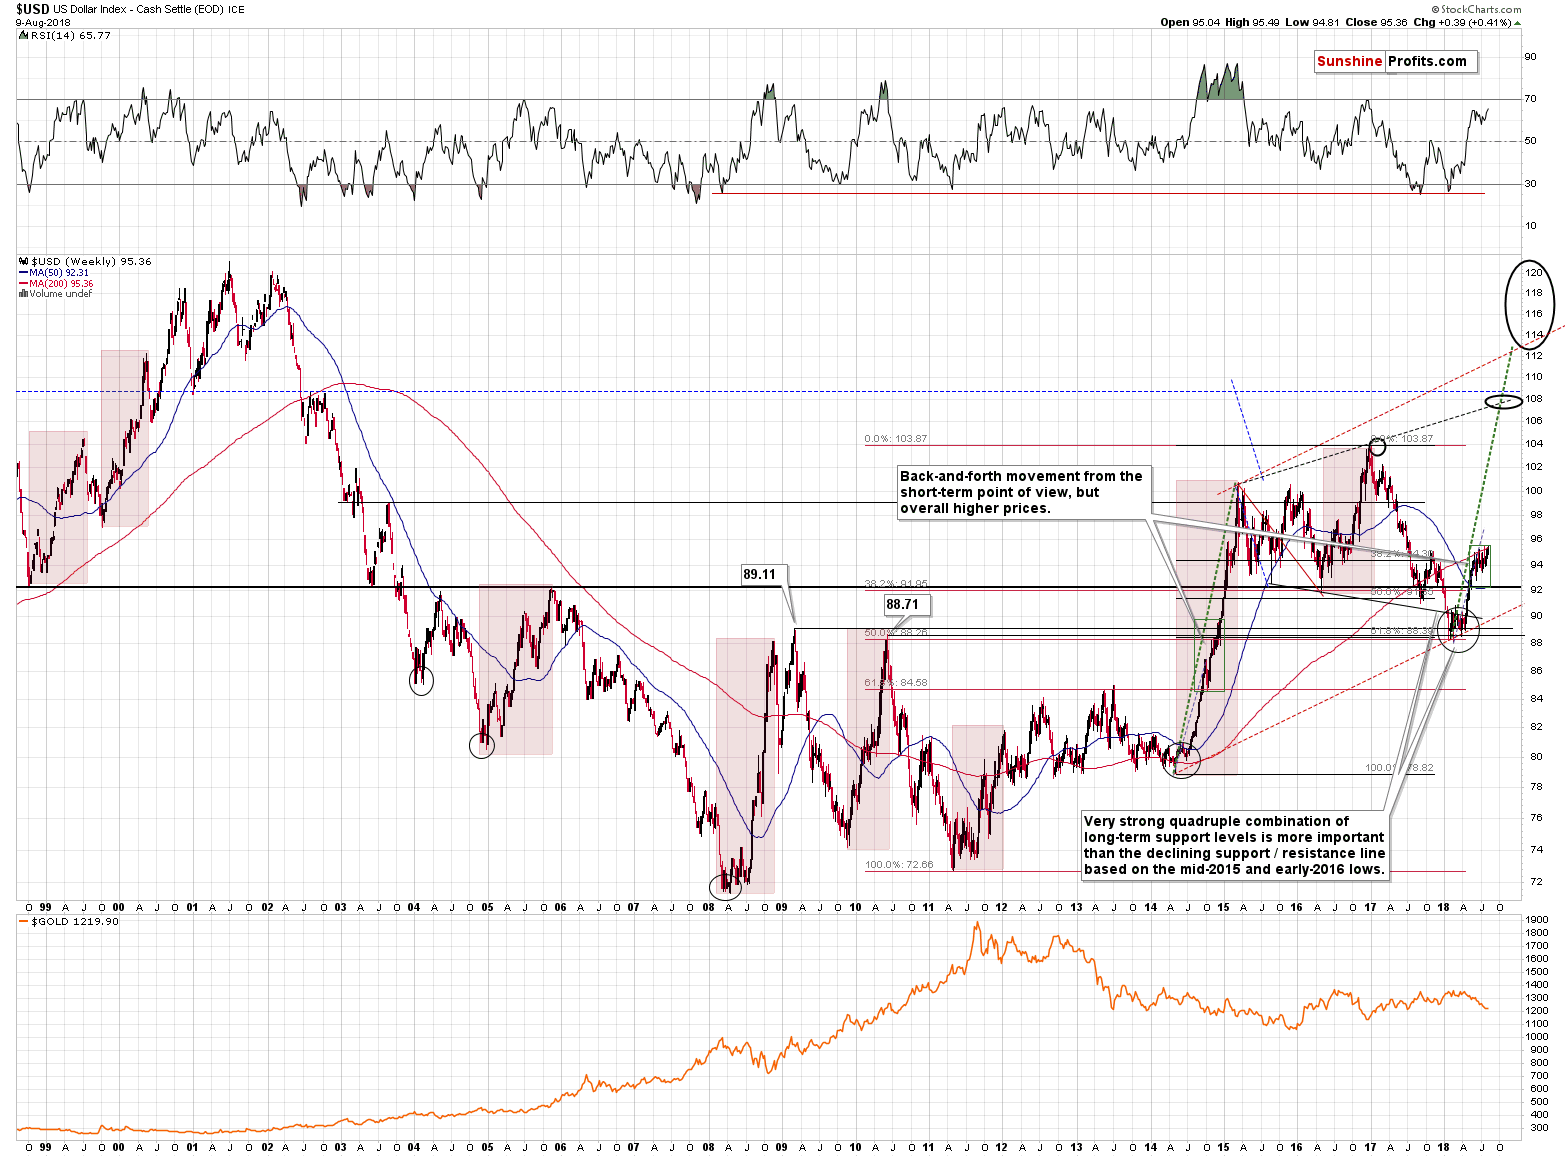
We marked the medium-term rallies from the past two decades with red rectangles, but – based on the USD’s performance in the previous months – the only rallies that were very similar to the current medium-term rally were the ones that started in 2008, late 2009, and in 2014. They all had some short-term consolidations along the way, but they were very brief (from the long-term point of view) and followed by moves that were similar to those that preceded the consolidations.
In this case, the preceding move is the April – May rally. The short-term USD chart provides more indications for a repeat of this upswing.
The USDX is still not above the upper border of the wedge pattern (black lines on the above short-term USD chart), but when it moves above the border, then it’s likely to rally as high as the height of the pattern suggests – to about 98. Consequently, this is our next short-term target, especially that it approximately corresponds to the 61.8% Fibonacci retracement based on the entire 2017 – 2018 decline and the late May 2017 top.
But that’s not all. If the USD Index moves higher (for instance as indicated above) and we see a confirmed breakout above the July 2018 highs, it will mean that a reverse head and shoulders (September 2017 bottom and the current consolidation being the shoulders and the early 2018 bottom being the head) is completed and the implications will be very bullish for the USDX and very bearish for the precious metals market.
Naturally, the formation will become a bullish development only after it is completed (…). We would like to stress that viewing incomplete patterns as already meaningful ones is a serious logical mistake. Please watch out for analysts that make it.
(…) The targets based on the head and shoulder patterns are created by copying the size of the head and adding it to the moment of the breakdown / breakout. Sounds familiar? It’s essentially the repeat of the preceding move and that’s exactly what we’re expecting to see based on the similarity to the previous medium-term USD rallies.
We marked this technique with green lines on the USD’s short-term chart. It points to a target just below 103, which means that we should be prepared to see the USD Index back at its 2017 highs. Naturally, this would have a devastating effect on the precious metals prices.
Summary
Summing up, the outlook for the precious metals sector is extremely bearish and there are signs that we’re on the verge of seeing another big wave down and that the next local bottom is going to form in about 2 weeks. In other words, it seems that our sizable profits on the short positions are going to become even bigger shortly.
As always, we’ll keep you – our subscribers – informed.
To summarize:
Trading capital (supplementary part of the portfolio; our opinion): Full short positions (250% of the full position) in gold, silver and mining stocks are justified from the risk/reward perspective with the following stop-loss orders and exit profit-take price levels:
- Gold: profit-take exit price: $1,062; stop-loss: $1,272; initial target price for the DGLD ETN: $82.96; stop-loss for the DGLD ETN $46.38
- Silver: profit-take exit price: $12.72; stop-loss: $16.46; initial target price for the DSLV ETN: $46.97; stop-loss for the DSLV ETN $24.07
- Mining stocks (price levels for the GDX ETF): profit-take exit price: $13.12; stop-loss: $23.64; initial target price for the DUST ETF: $80.97; stop-loss for the DUST ETF $20.87
In case one wants to bet on junior mining stocks’ prices (we do not suggest doing so – we think senior mining stocks are more predictable in the case of short-term trades – if one wants to do it anyway, we provide the details), here are the stop-loss details and initial target prices:
- GDXJ ETF: profit-take exit price: $17.52; stop-loss: $34.82
- JDST ETF: initial target price: $154.97 stop-loss: $42.78
Long-term capital (core part of the portfolio; our opinion): No positions (in other words: cash)
Insurance capital (core part of the portfolio; our opinion): Full position
Important Details for New Subscribers
Whether you already subscribed or not, we encourage you to find out how to make the most of our alerts and read our replies to the most common alert-and-gold-trading-related-questions.
Please note that the in the trading section we describe the situation for the day that the alert is posted. In other words, it we are writing about a speculative position, it means that it is up-to-date on the day it was posted. We are also featuring the initial target prices, so that you can decide whether keeping a position on a given day is something that is in tune with your approach (some moves are too small for medium-term traders and some might appear too big for day-traders).
Plus, you might want to read why our stop-loss orders are usually relatively far from the current price.
Please note that a full position doesn’t mean using all of the capital for a given trade. You will find details on our thoughts on gold portfolio structuring in the Key Insights section on our website.
As a reminder – “initial target price” means exactly that – an “initial” one, it’s not a price level at which we suggest closing positions. If this becomes the case (like it did in the previous trade) we will refer to these levels as levels of exit orders (exactly as we’ve done previously). Stop-loss levels, however, are naturally not “initial”, but something that, in our opinion, might be entered as an order.
Since it is impossible to synchronize target prices and stop-loss levels for all the ETFs and ETNs with the main markets that we provide these levels for (gold, silver and mining stocks – the GDX ETF), the stop-loss levels and target prices for other ETNs and ETF (among other: UGLD, DGLD, USLV, DSLV, NUGT, DUST, JNUG, JDST) are provided as supplementary, and not as “final”. This means that if a stop-loss or a target level is reached for any of the “additional instruments” (DGLD for instance), but not for the “main instrument” (gold in this case), we will view positions in both gold and DGLD as still open and the stop-loss for DGLD would have to be moved lower. On the other hand, if gold moves to a stop-loss level but DGLD doesn’t, then we will view both positions (in gold and DGLD) as closed. In other words, since it’s not possible to be 100% certain that each related instrument moves to a given level when the underlying instrument does, we can’t provide levels that would be binding. The levels that we do provide are our best estimate of the levels that will correspond to the levels in the underlying assets, but it will be the underlying assets that one will need to focus on regarding the signs pointing to closing a given position or keeping it open. We might adjust the levels in the “additional instruments” without adjusting the levels in the “main instruments”, which will simply mean that we have improved our estimation of these levels, not that we changed our outlook on the markets. We are already working on a tool that would update these levels on a daily basis for the most popular ETFs, ETNs and individual mining stocks.
Our preferred ways to invest in and to trade gold along with the reasoning can be found in the how to buy gold section. Additionally, our preferred ETFs and ETNs can be found in our Gold & Silver ETF Ranking.
As a reminder, Gold & Silver Trading Alerts are posted before or on each trading day (we usually post them before the opening bell, but we don't promise doing that each day). If there's anything urgent, we will send you an additional small alert before posting the main one.
=====
Latest Free Trading Alerts:
Inflation came back. The Fed met its 2-percent target for the first time for years. Will it make gold shine? We invite you to read our today’s article about the rising inflationary pressures in the US economy and find out whether it will boost the gold prices.
=====
Hand-picked precious-metals-related links:
PRECIOUS-Gold slips as Turkish currency crisis bolsters the dollar
=====
In other news:
Fed's Evans sees one or two more rate hikes in 2018 as reasonable
Stocks dive, euro falls, as Turkey turmoil ripples out
Dollar hits 13-month peak, yen also bullish as appetite for risk deteriorates
Japan dodges a recession, but it's not in the clear yet
Is The Volatility Index Actually Useful In Measuring Volatility?
Interest rates will stay low for 20 years, says Bank of England expert
Oil dips on trade dispute, but Iran sanctions tighten outlook
The World Bank is preparing for the world's first blockchain bond
=====
Thank you.
Sincerely,
Przemyslaw Radomski, CFA
Founder, Editor-in-chief, Gold & Silver Fund Manager
Gold & Silver Trading Alerts
Forex Trading Alerts
Oil Investment Updates
Oil Trading Alerts

