

Briefly: in our opinion, full (250% of the regular size of the position) speculative short positions in gold, silver and mining stocks are justified from the risk/reward perspective at the moment of publishing this alert.
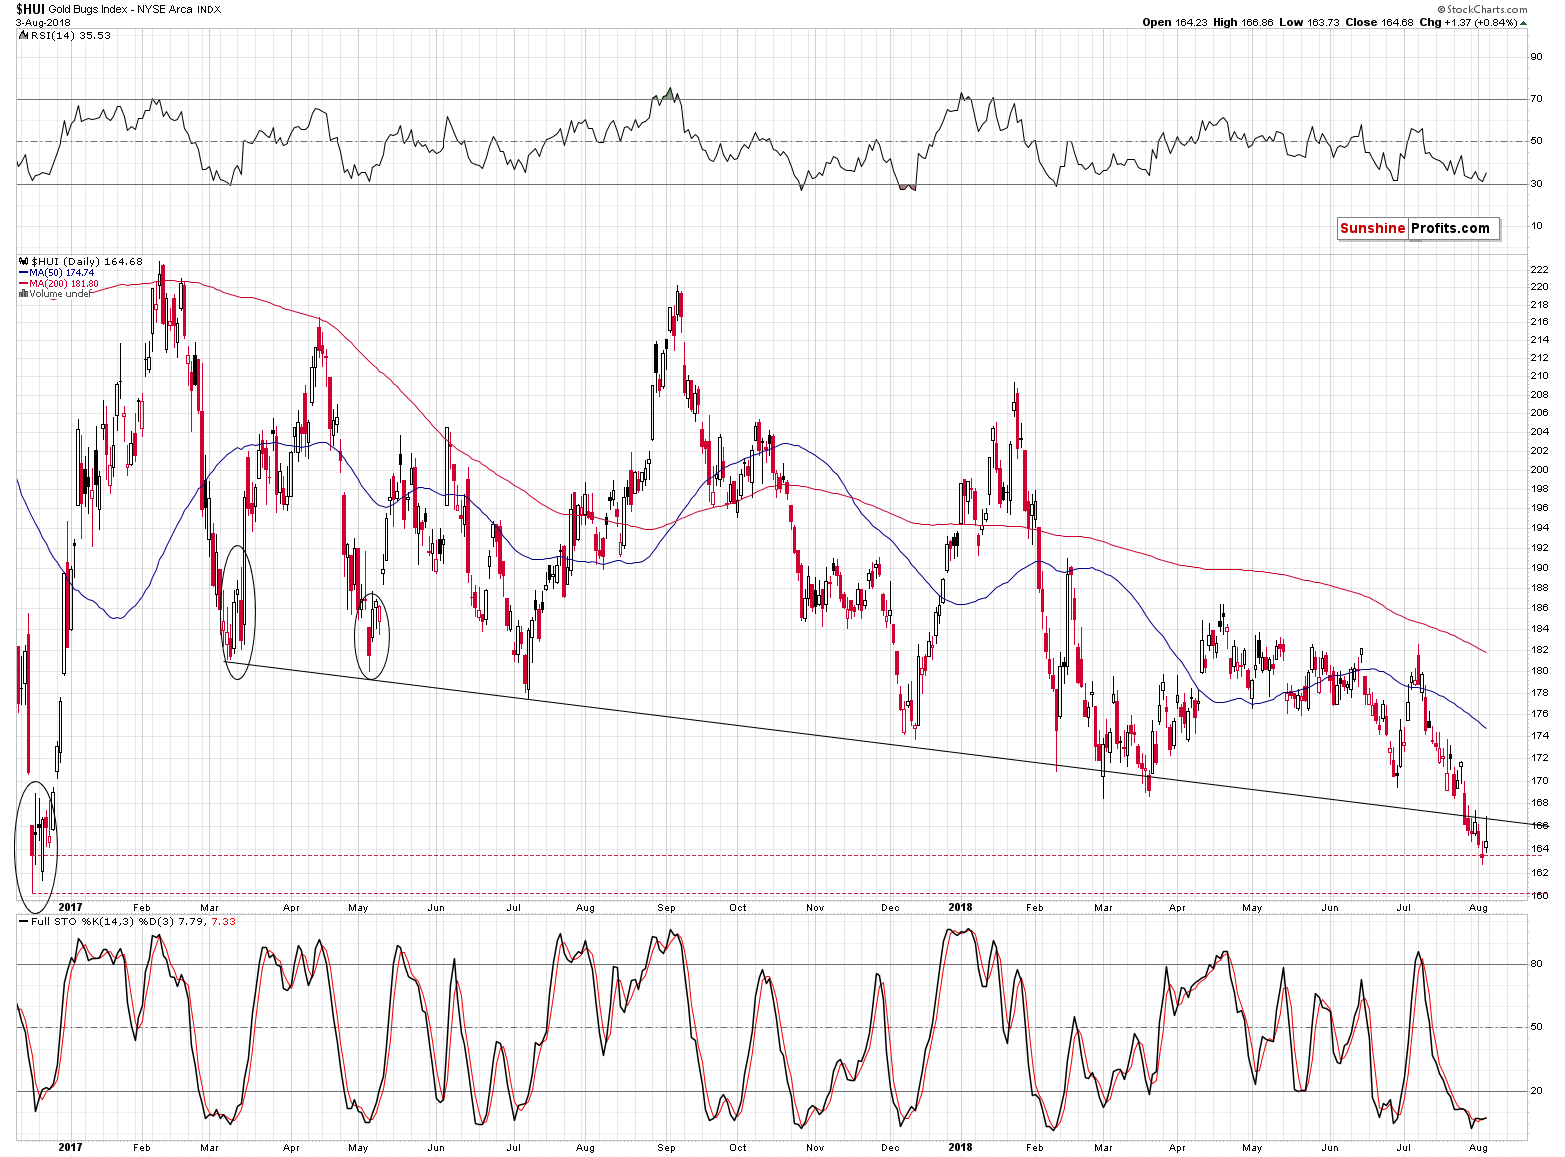
On Thursday, the HUI index just broke below the December 2016 lows (in terms of daily closing prices), but it reversed on Friday and closed the week back above this important support. Invalidations are often more important than breakdowns, so did Friday’s action just tell us that we’re going to see a major reversal?
Both: yes and no. Yes, because it was – objectively speaking – a bullish signal. No, because we might have already seen what was likely to take place. There was an intraday rally that ran out of steam and was followed by a move back down before the end of the session. We saw a new sell signal as well. Let’s take a look at the very short-term developments (charts courtesy of http://stockcharts.com).
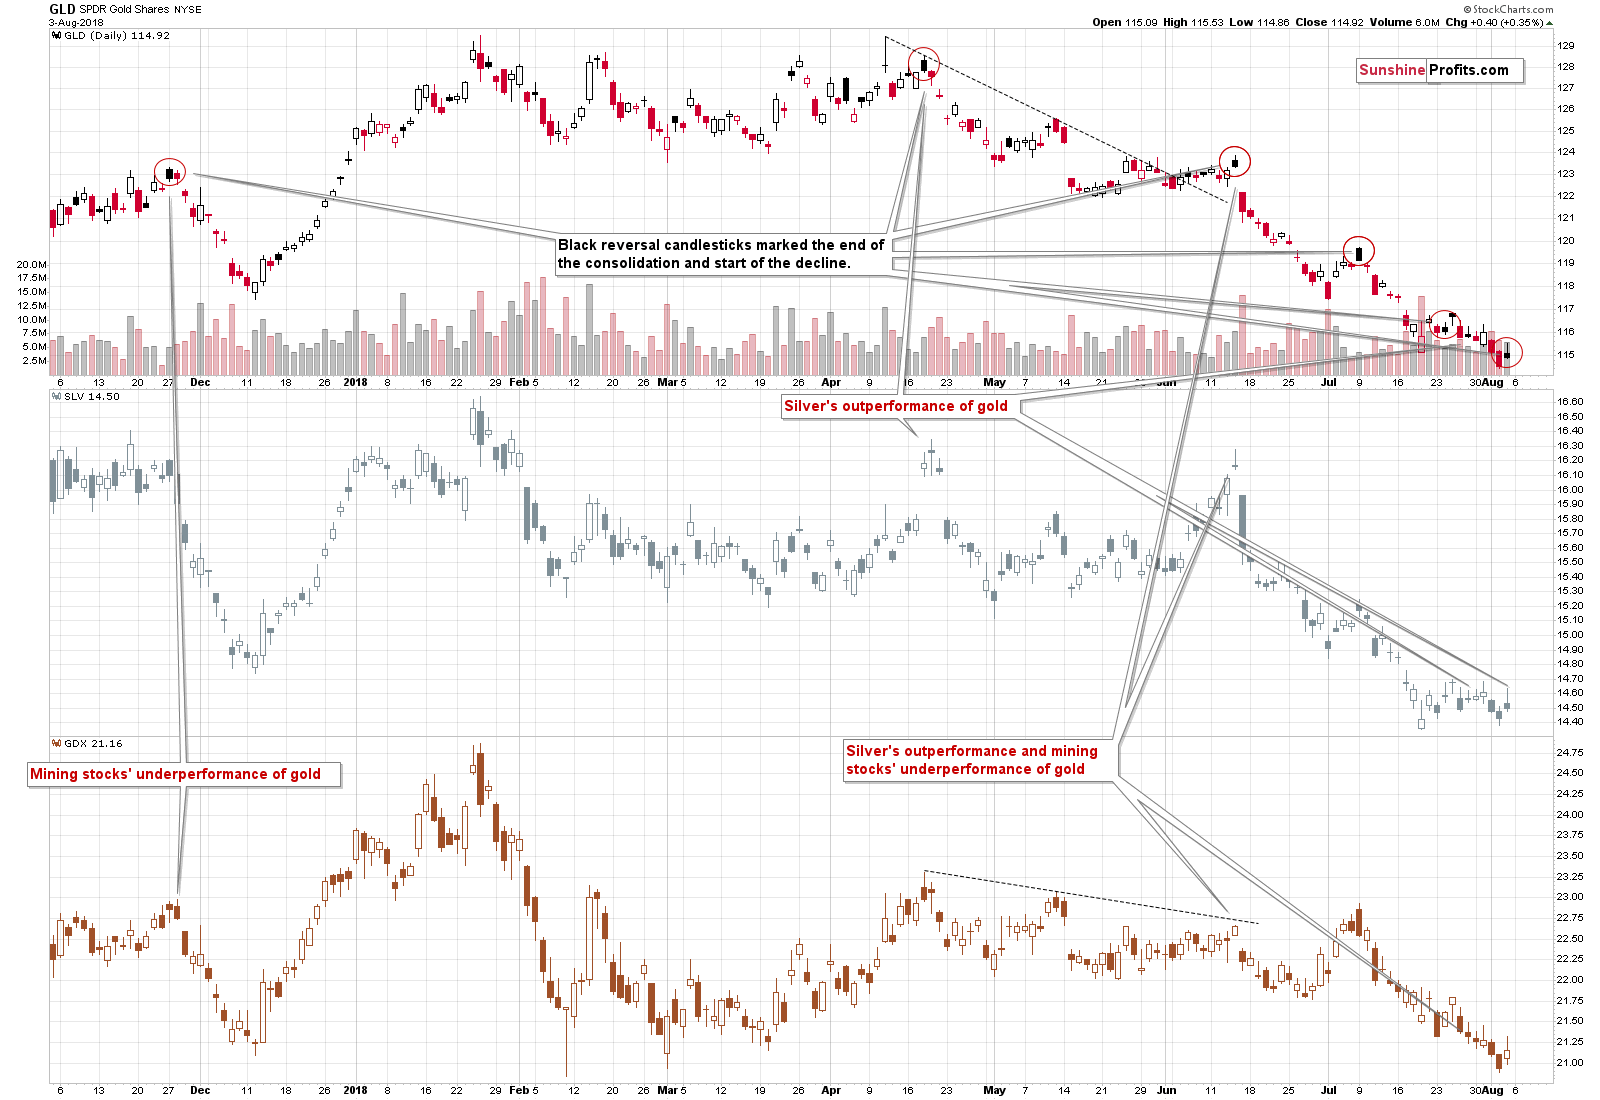
The GLD ETF ended the session only $0.40 higher and since its opening price was above the closing price, Stockcharts marked this session in black. As we emphasized yesterday, these sessions may – and recently did – indicate the end of the brief upswing and the beginning of another wave down.
The SLV price outperformed on an intraday basis by rallying almost to Tuesday’s (July 31st) intraday high, while the GLD price was not even close to its July 31st high. That’s yet another bearish sign as silver often outperforms in this way just before declines.
We haven’t seen underperformance in mining stocks, but their performance has not been particularly strong either. The GDX ETF didn’t invalidate the breakdown below the previous 2018 and lows and it bounced from the 2017 lows in a rather inconclusive manner. Overall, it seems that we haven’t seen any convincing signs from the mining stocks’ Friday price action.
With bearish signs from GLD and SLV and a neutral one from GDX, the overall implications of Friday’s intraday action, are bearish.
Silver and HUI’s Breakdowns and Invalidations
At first sight, silver and the HUI Index invalidated their breakdowns below their previous lows in terms of the daily closing prices. And that’s true. But, there’s more to the story than just that. The follow-up rallies were very small, and they resulted in some other bearish signals.
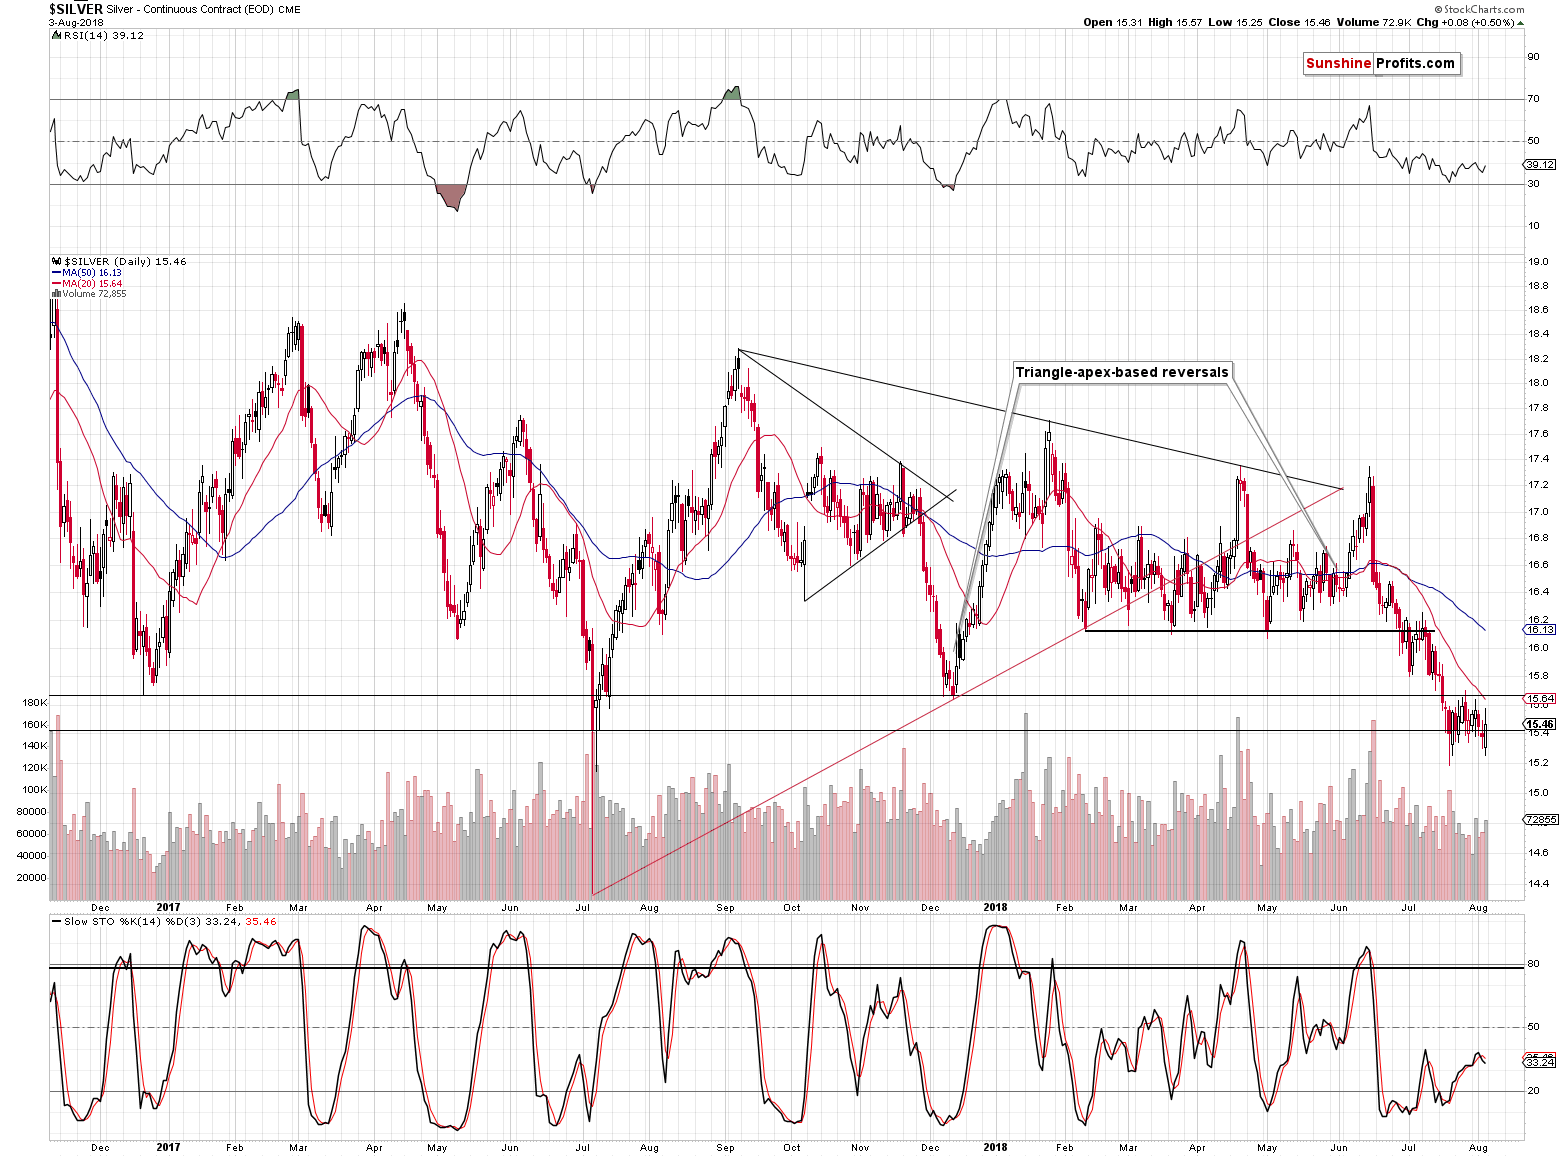
Silver closed above the July 2017 low, but it once again closed below the December 2016 and December 2017 lows, thus further confirming the breakdown and silver once again showed that the situation now is not like it was in July 2017 when silver rallied sharply higher after a volatile low was formed. If that pattern was repeating, silver should already be back above $16 – after all, the first attempt of silver to move below the July 2017 was about two weeks ago.
So, is the invalidation of silver’s breakdown an important bullish sign? We doubt it.
The HUI Index closed the day less than 1% above Thursday’s closing price, but it attempted to move much higher. It was stopped by the declining resistance line based on the March 2017 and July 2017 lows and thus the breakdown below this line was verified.
Moreover, even though there was a small invalidation of the breakdown in terms of daily closing prices, there was a major breakdown in terms of the weekly closing prices.
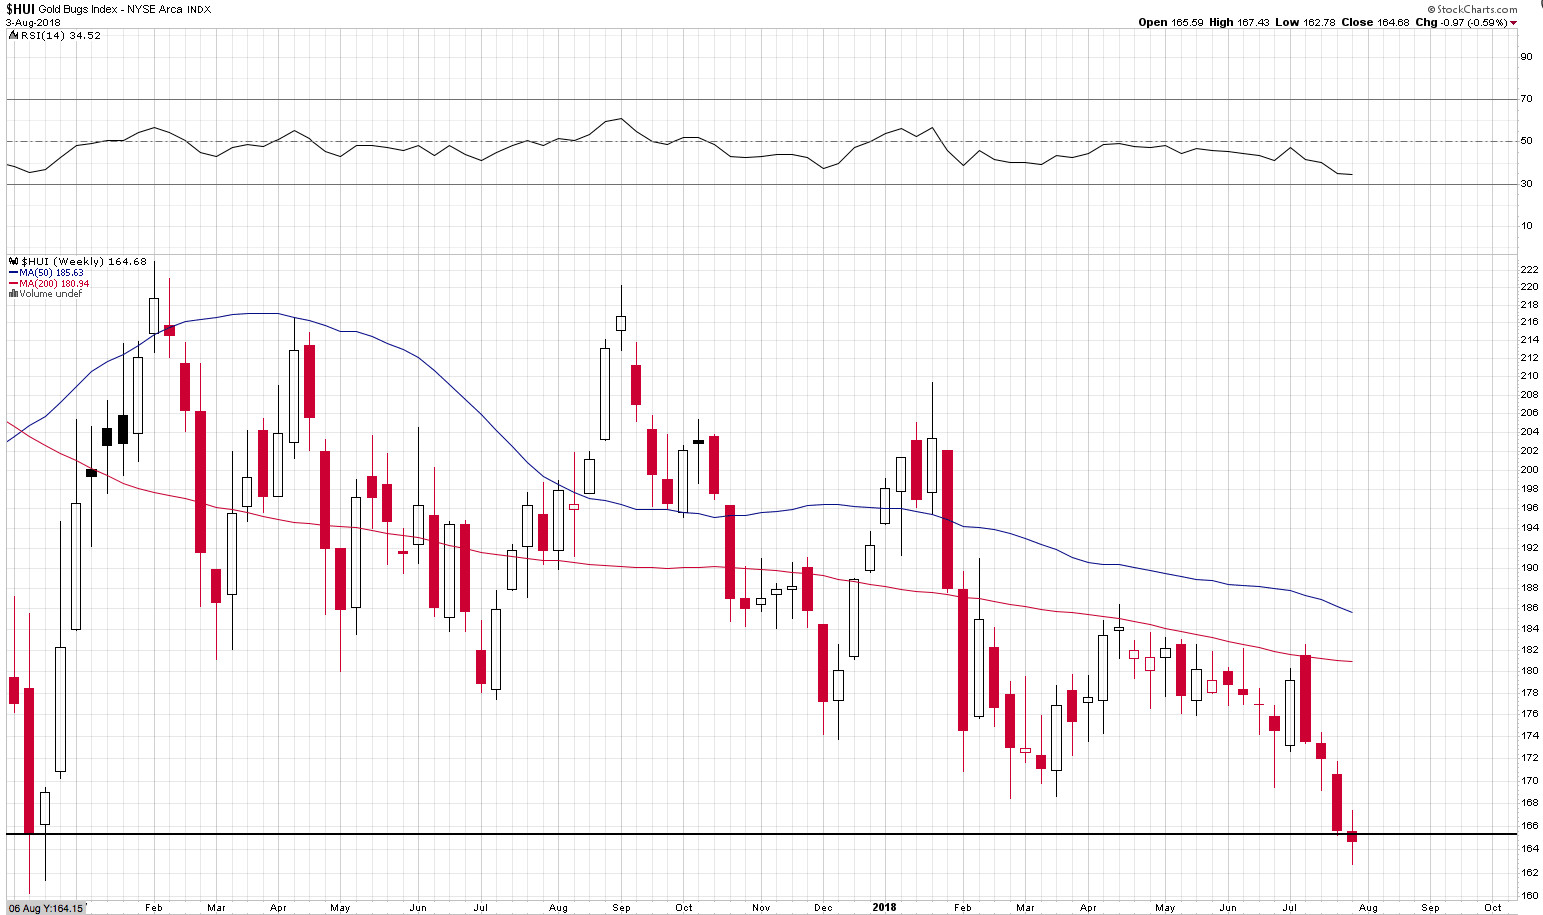
Even though it was not huge, it is quite important as weekly prices tend to have greater medium-term meaning than the daily closing prices.
Plus, let’s keep in mind that the HUI Index is already after the breakdown below the 61.8% Fibonacci retracement level.
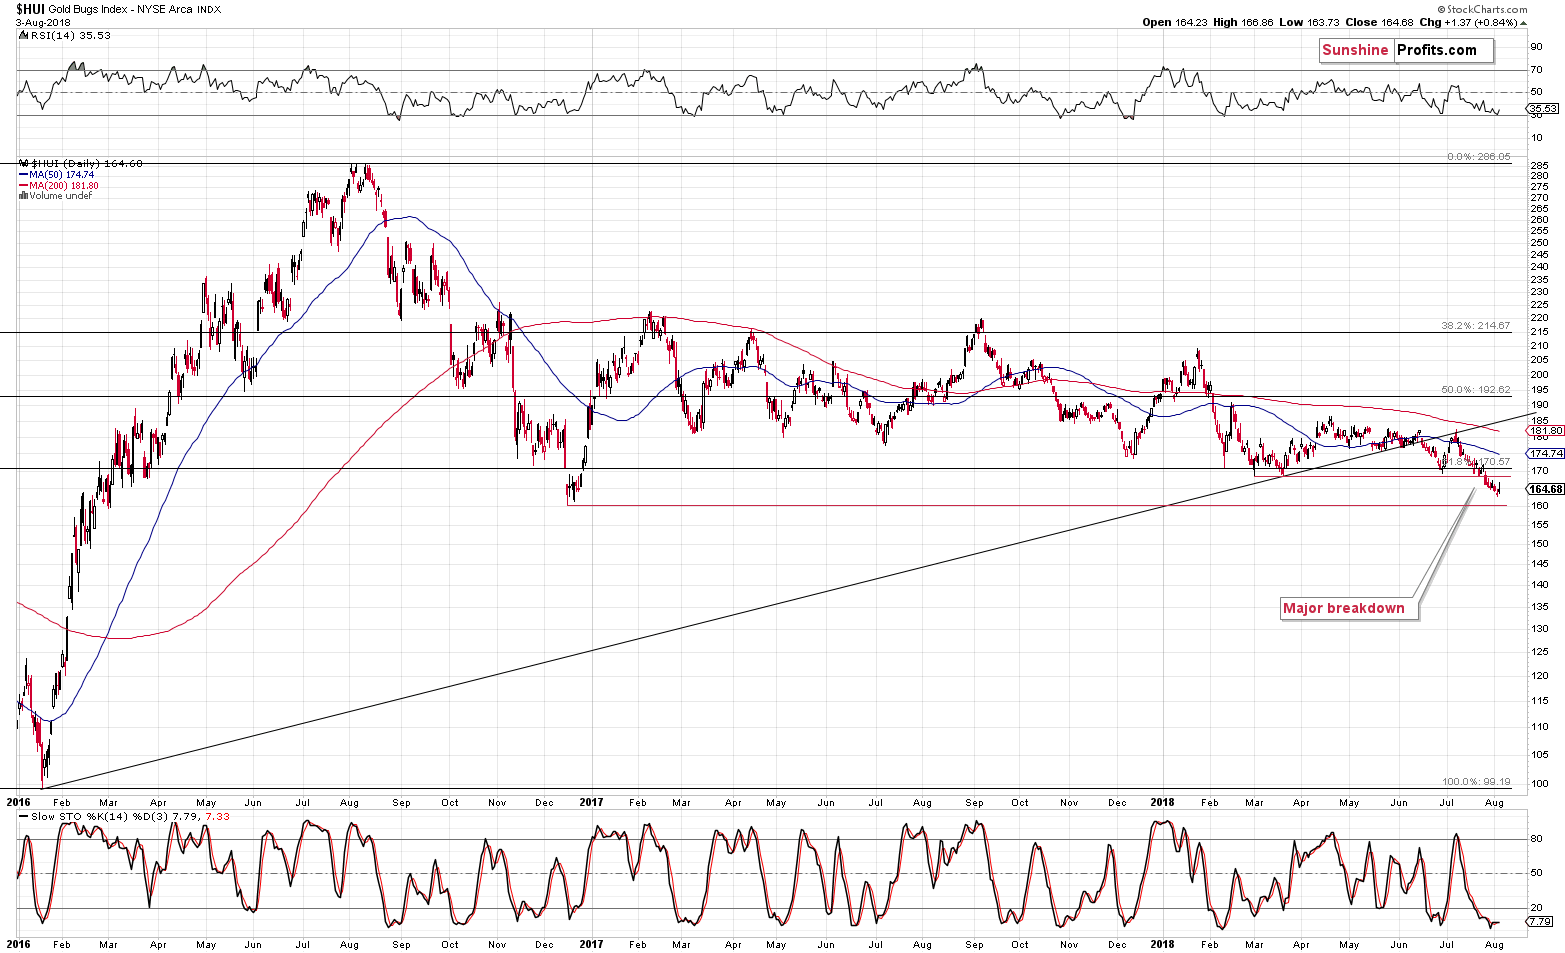
Friday’s 0.84% move higher didn’t change anything regarding that move – it’s currently more than confirmed and the implications are bearish.
Silver Stocks
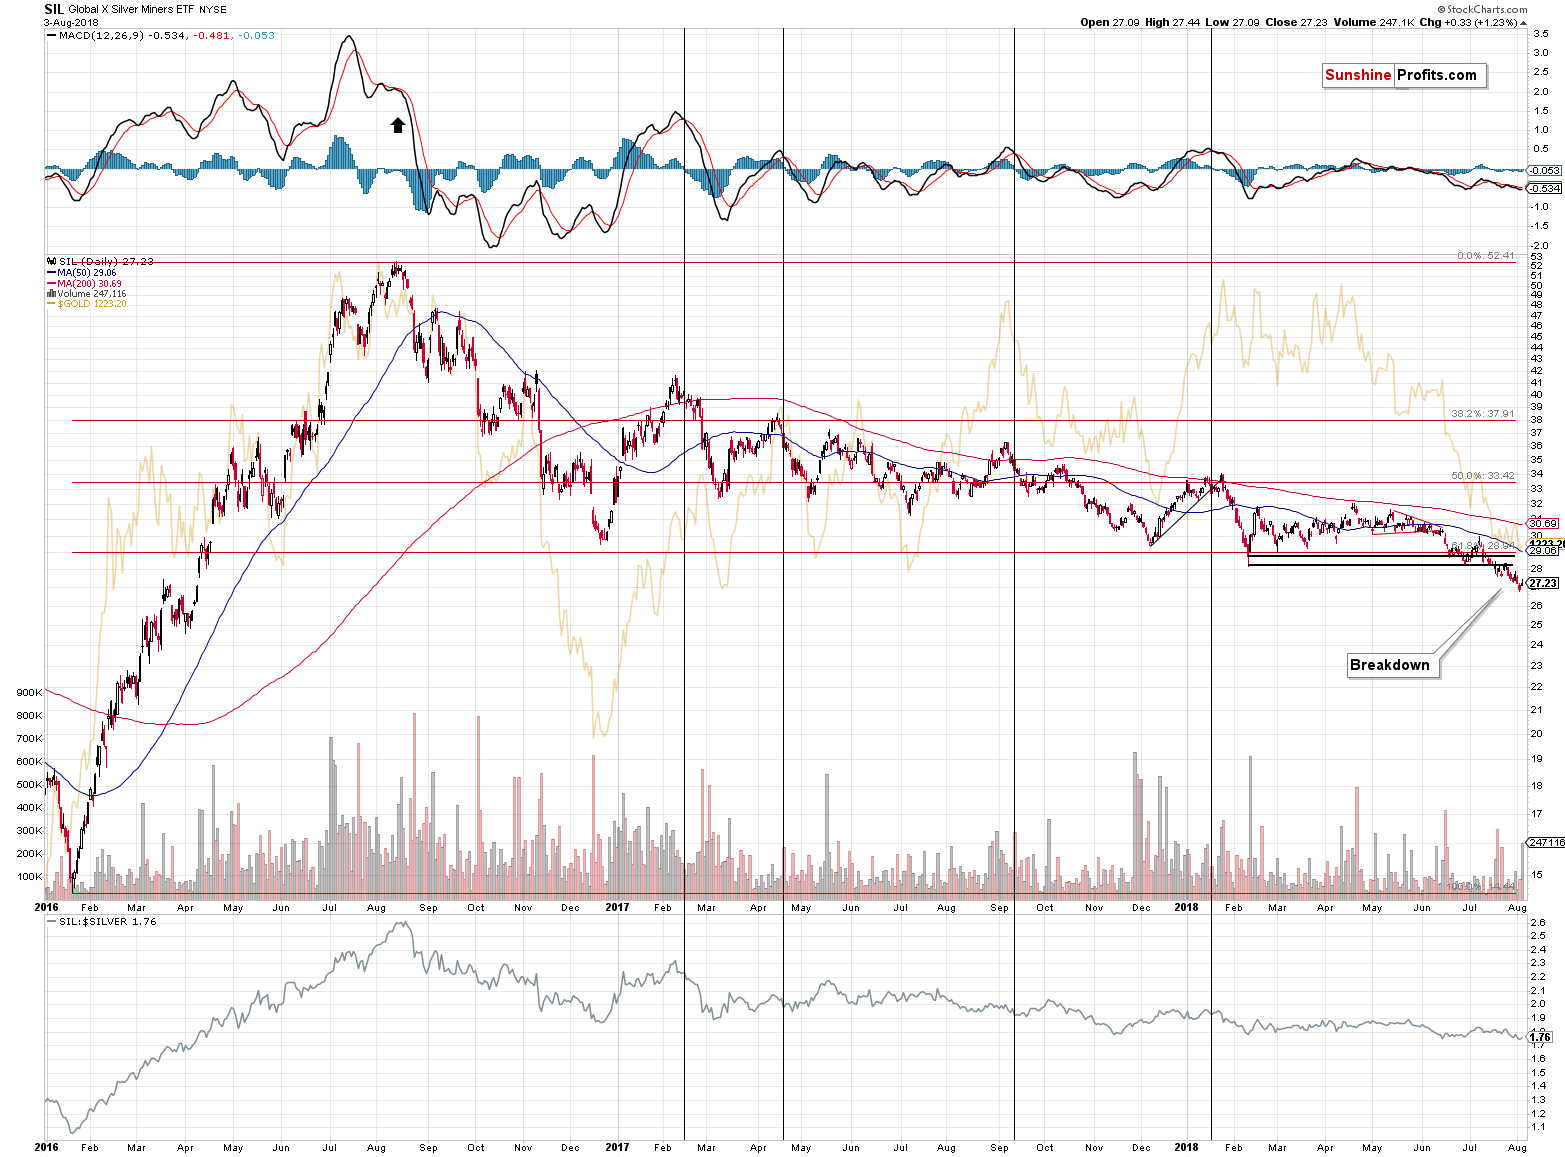
Silver stocks are already after multiple breakdowns: the late 2016 bottom, the 2017 and 2018 bottoms and the 61.8% Fibonacci retracement level based on the entire 2016 rally.
There is no strong support nearby, so silver miners are very vulnerable to a decline that would be similarly sharp as the early 2016 rally.
Gold vs. Stocks
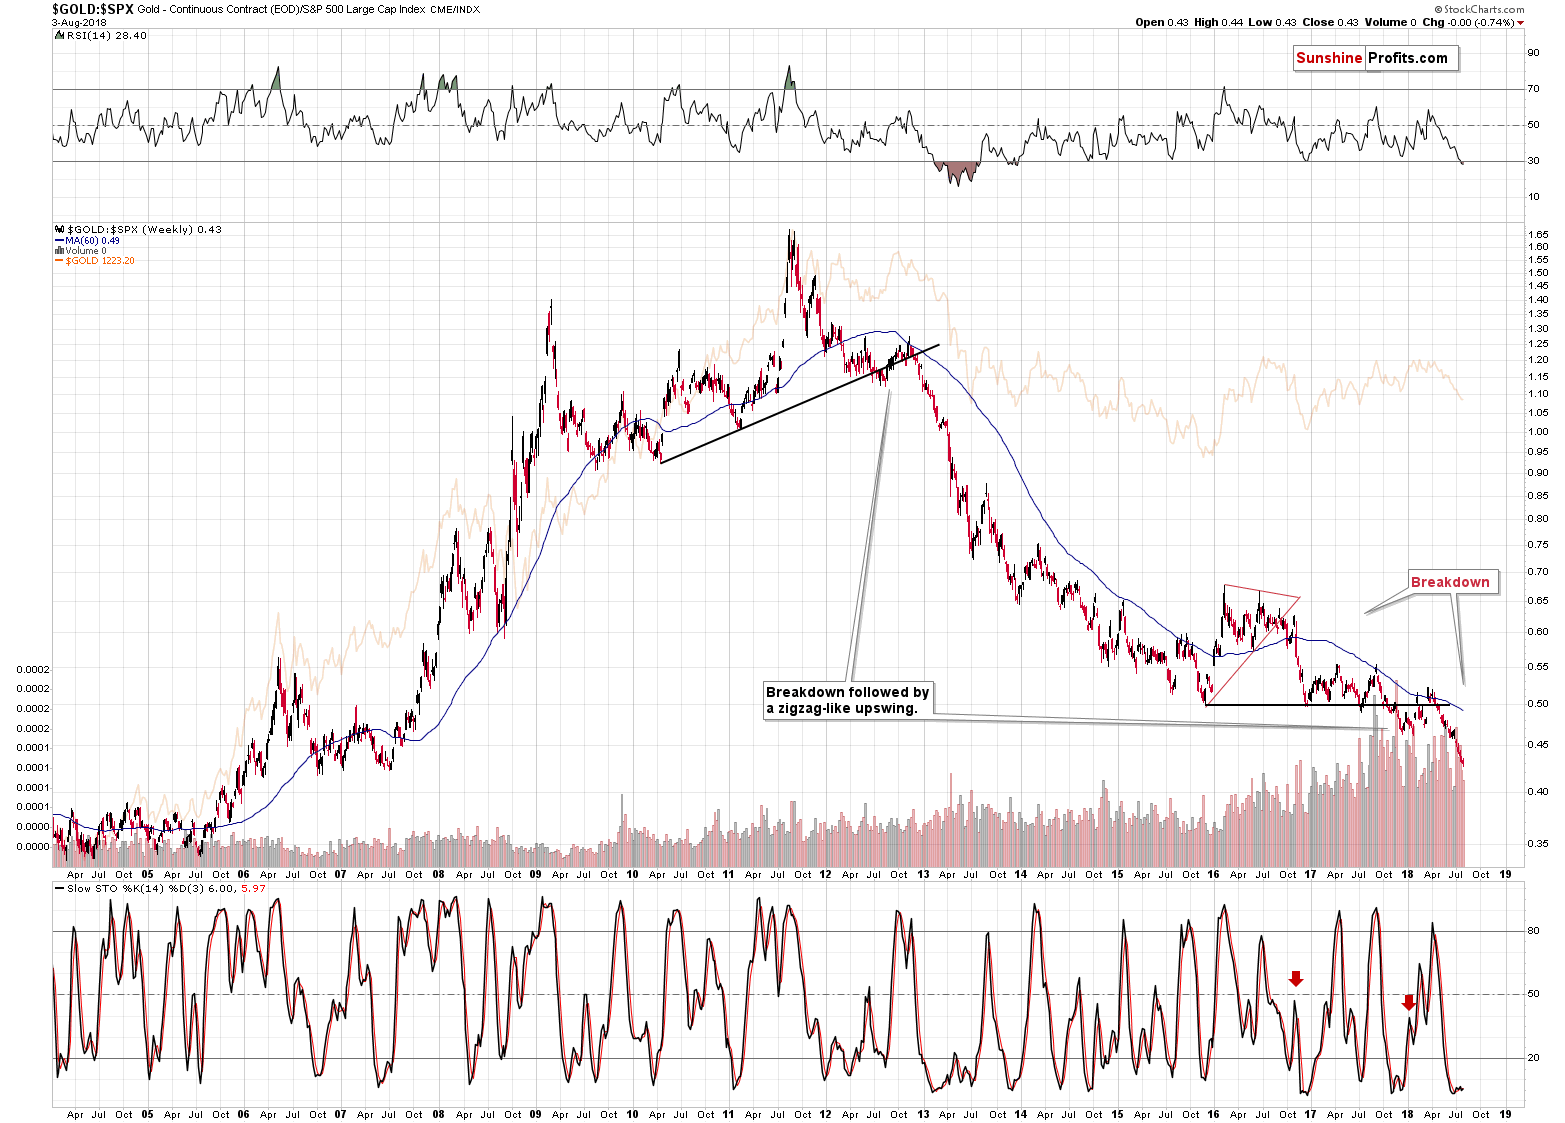
The gold to S&P 500 ratio is already after a breakdown, it’s verification and a subsequent short-term decline. That’s exactly what happened in 2013 right before the slide in gold, silver and mining stocks – the ratio predicted the decline before it happened. And just as it was back then, almost nobody is paying attention to this signal.
We already commented on the above ratio in January, and our previous comments are up-to-date also today:
One of the most important long-term charts is the one featuring gold’s performance compared to the general stock market.
The special thing about the gold to S&P ratio is that it smoothens the price swings and makes it clear what’s really going on. In the case of the price of gold itself, the short-term price swings are more important and they look just like early parts of bigger moves. In the case of the ratio, however, the small moves are even smaller and the bigger ones are even bigger. It’s easier to differentiate between them in this way.
The flag example is the 2012 breakdown and the early 2013 decline. In the case of gold, it still looked like a consolidation after a rally, but the ratio showed that the rally was over. The latter turned out to be the reality.
The ratio is now after a major breakdown and after a corrective upswing that verified it. It now resumed its decline as confirmed by the sell signal from the Stochastic indicator.
The significance of the above is much greater than it may appear at the first sight. The reasons are the analogies to the similar cases. The breakdown below a major support line is very important because the only analogous case was the 2012 breakdown. The one that started the huge slide in the precious metals prices. Why is the confirmation so significant? Because we already had fake breakdowns previously that were shortly invalidated. Not this time. This time the implications are fully bearish and confirmed.
Speaking of the confirmation and sell signal from the Stochastic indicator – it’s significant, because of the similarity to the action in late 2016. Back then the ratio broke below the triangle pattern and rallied back up. It then topped and continued to slide – and this slide was confirmed by the sell signal from the Stochastic indicator. We’re seeing the same kind of confirmation this time. Just as the price of gold followed the ratio lower, the same appears likely this time.
By the way, the ratio topped right at the apex of the triangle, which further confirms the usefulness of the apex reversal technique.
The gold to S&P 500 ratio is now breaking to new lows and this is taking place after the verification of the breakdown below the 2015, 2016 and 2017 lows. It’s tough to imagine a more bearish situation for the ratio – and thus for gold – than the above.
Gold vs. Bonds
The gold to bonds ratio chart also shows an important breakdown below the medium-term support line. It’s not very visible from the very long-term perspective, but it is once we zoom in.
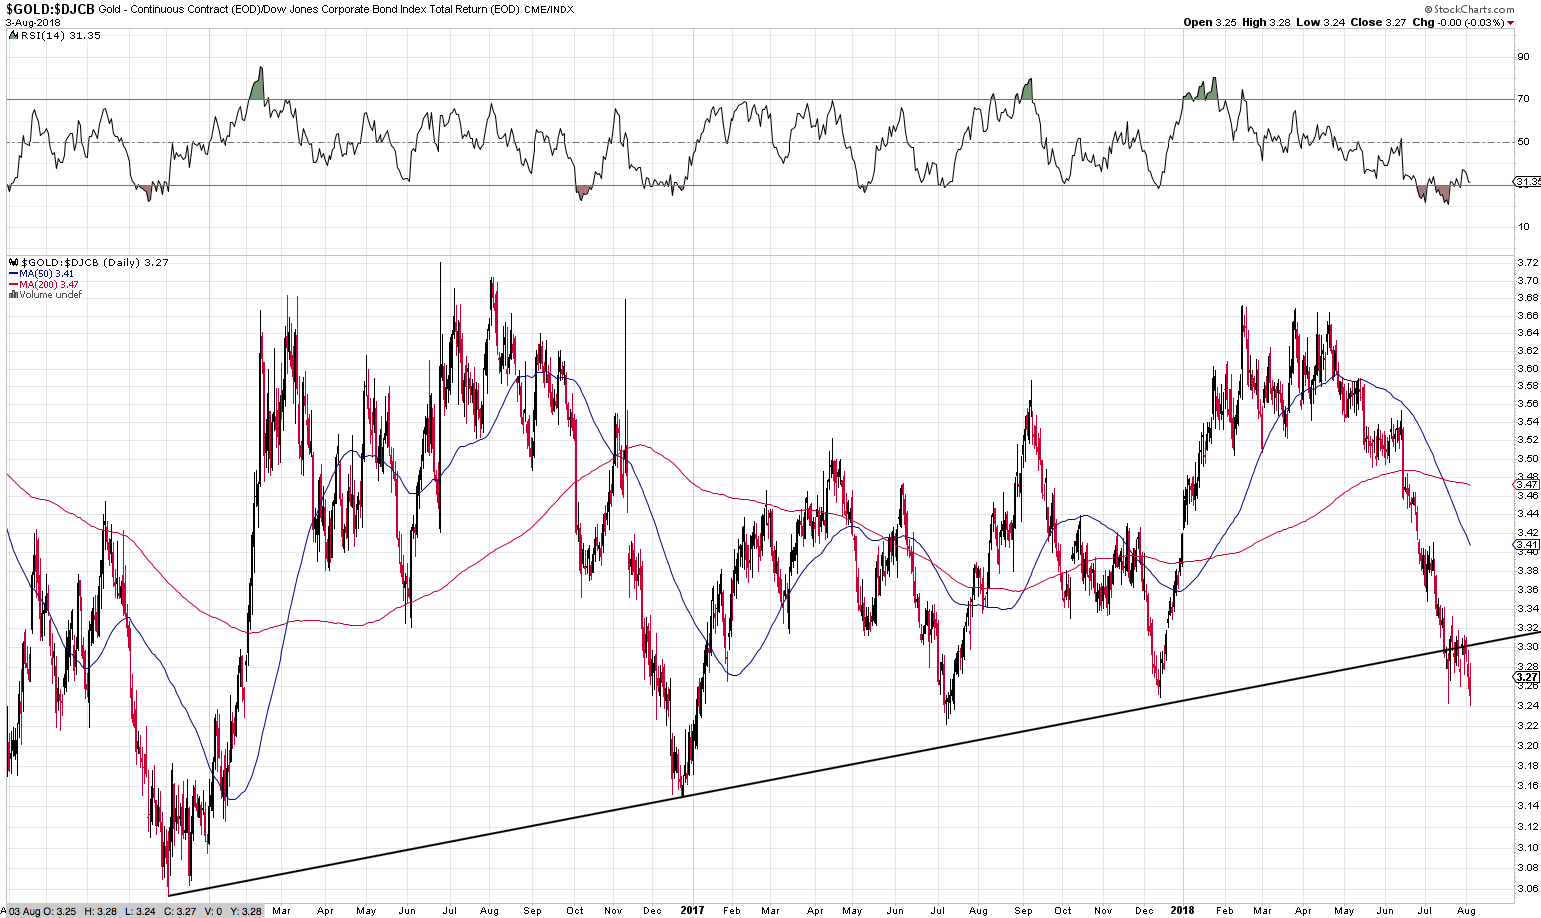
It’s quite clear that gold moved below the rising support line based on the late 2016 and late 2017 lows and then verified this breakdown by consolidating below the support. Do you know when this ratio was after a major breakdown below a rising medium-term support line? Before the 2013 slide. The implications are strongly bearish for the following weeks.
You know what’s the most bearish thing about all those breakdowns? That they took place without the USD’s help.
USD Index’s Impact
The USD Index has been moving back and forth since late May. Under normal conditions, gold and silver should have been trading back and forth as well, mimicking the U.S. currency. But that’s not what happened. Gold is almost $100 lower than it was in late May and silver declined substantially as well. This shows great weakness of the precious metals sector and vulnerability to further declines if the USD Index was to continue its medium-term rally.
The thing is that it is indeed likely to continue its big, medium-term rally based on the analogy to the previous sharp upswings, especially the one that we saw in 2014.
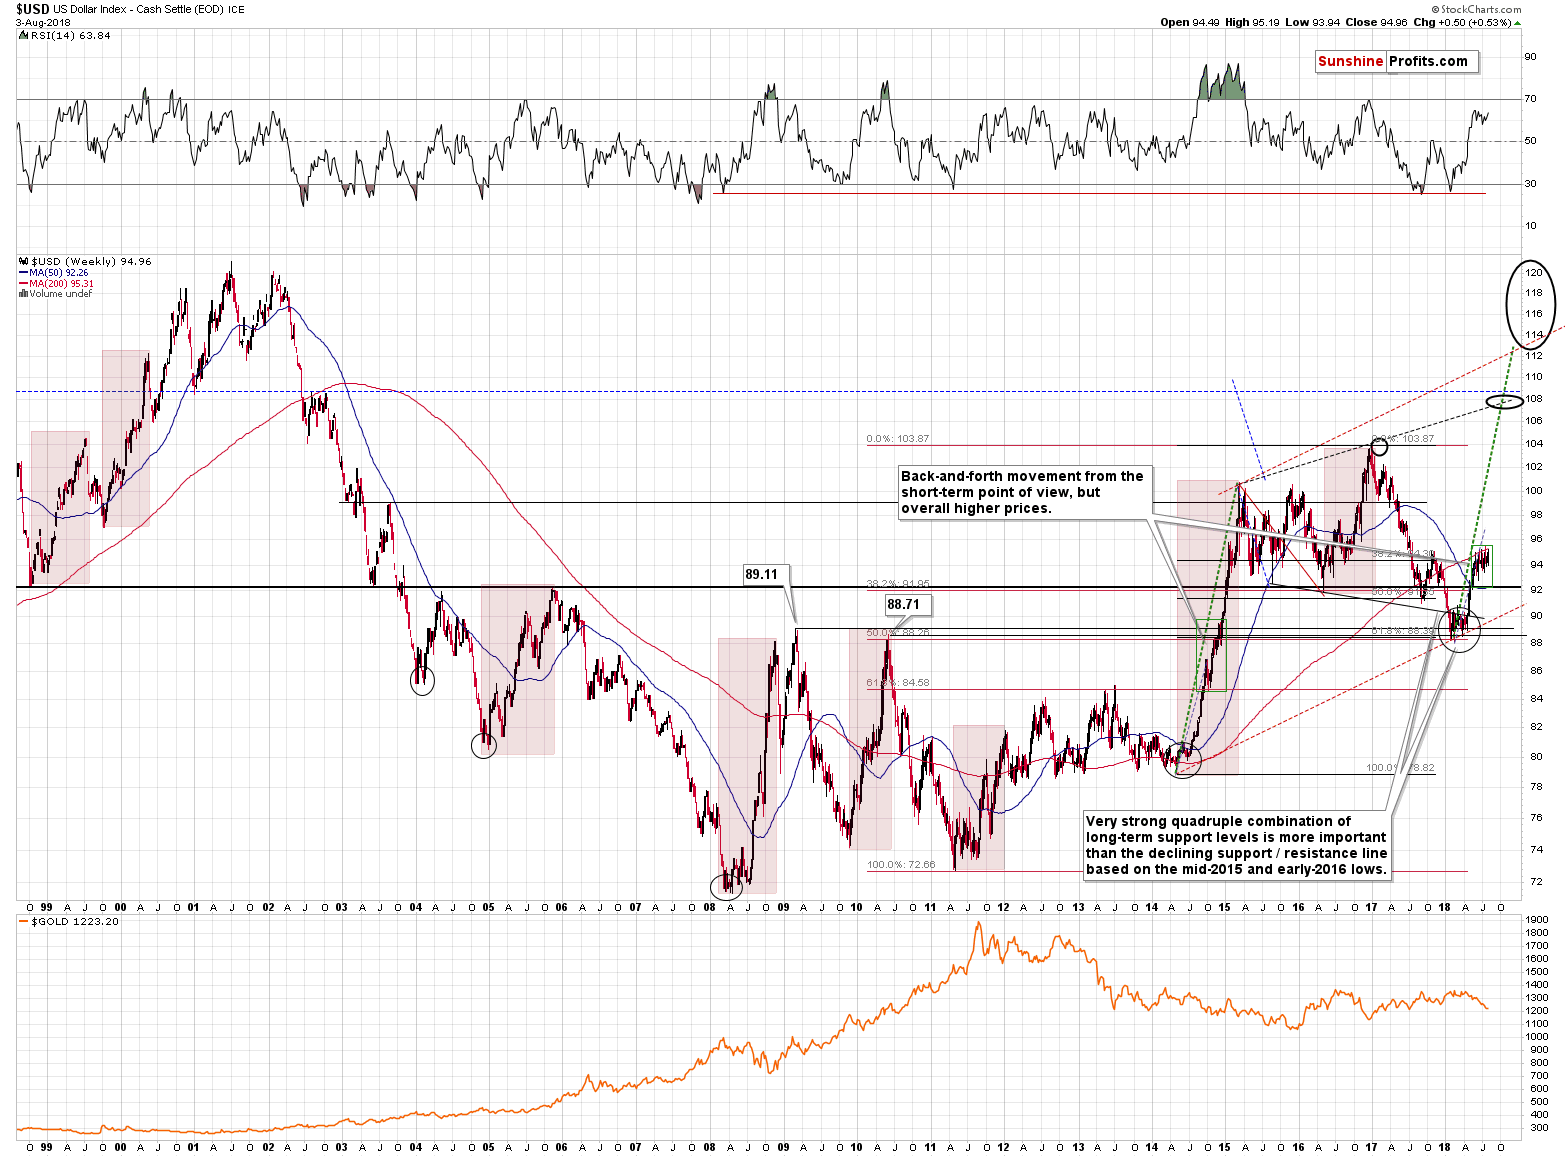
We marked the medium-term rallies from the past two decades with red rectangles, but – based on the USD’s performance in the previous months – the only rallies that were very similar to the current medium-term rally were the ones that started in 2008, late 2009, and in 2014. They all had some short-term consolidations along the way, but they were very brief (from the long-term point of view) and followed by moves that were similar to those that preceded the consolidations.
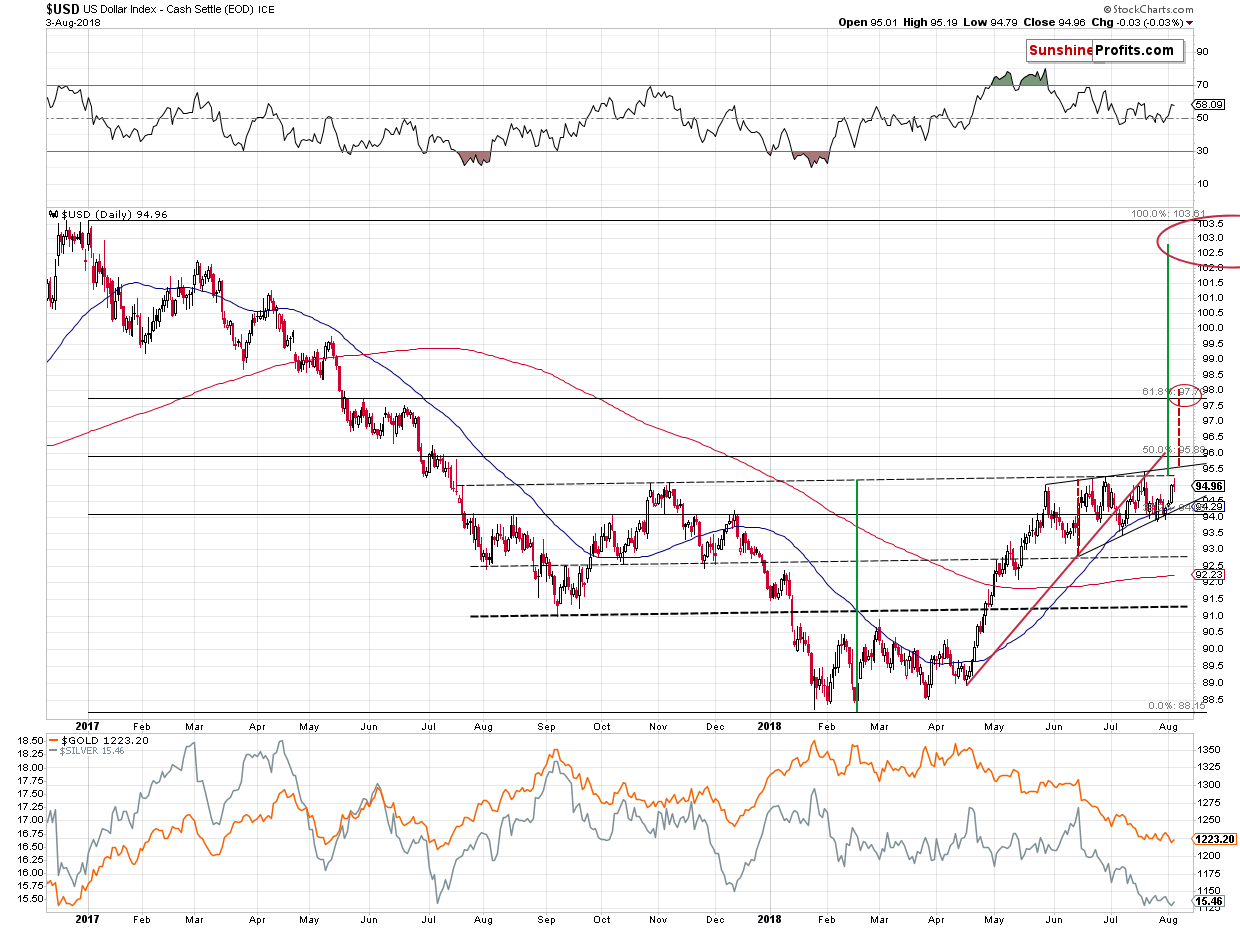
In this case, the preceding move is the April – May rally. The short-term USD chart provides more indications for a repeat of this upswing.
The USDX is still not above the upper border of the wedge pattern (black lines on the above short-term USD chart), but when it moves above the border, then it’s likely to rally as high as the height of the pattern suggests – to about 98. Consequently, this is our next short-term target, especially that it approximately corresponds to the 61.8% Fibonacci retracement based on the entire 2017 – 2018 decline and the late May 2017 top.
But that’s not all. If the USD Index moves higher (for instance as indicated above) and we see a confirmed breakout above the July 2018 highs, it will mean that a reverse head and shoulders (September 2017 bottom and the current consolidation being the shoulders and the early 2018 bottom being the head) is completed and the implications will be very bullish for the USDX and very bearish for the precious metals market.
Naturally, the formation will become a bullish development only after it is completed – it does not have any implications at this time. We would like to stress that viewing incomplete patterns as already meaningful ones is a serious logical mistake. Please watch out for analysts that make it.
So, once again, this pattern may have strong implications if it’s completed, but it has none now. The targets based on the head and shoulder patterns are created by copying the size of the head and adding it to the moment of the breakdown / breakout. Sounds familiar? It’s essentially the repeat of the preceding move and that’s exactly what we’re expecting to see based on the similarity to the previous medium-term USD rallies.
We marked this technique with green lines on the USD’s short-term chart. It points to a target just below 103, which means that we should be prepared to see the USD Index back at its 2017 highs. Naturally, this would have a devastating effect on the precious metals prices.
And you know what? We could see this big, sharp decline almost right away, as we have the long-term apex-based reversals in just a few weeks.
Reversal Dates
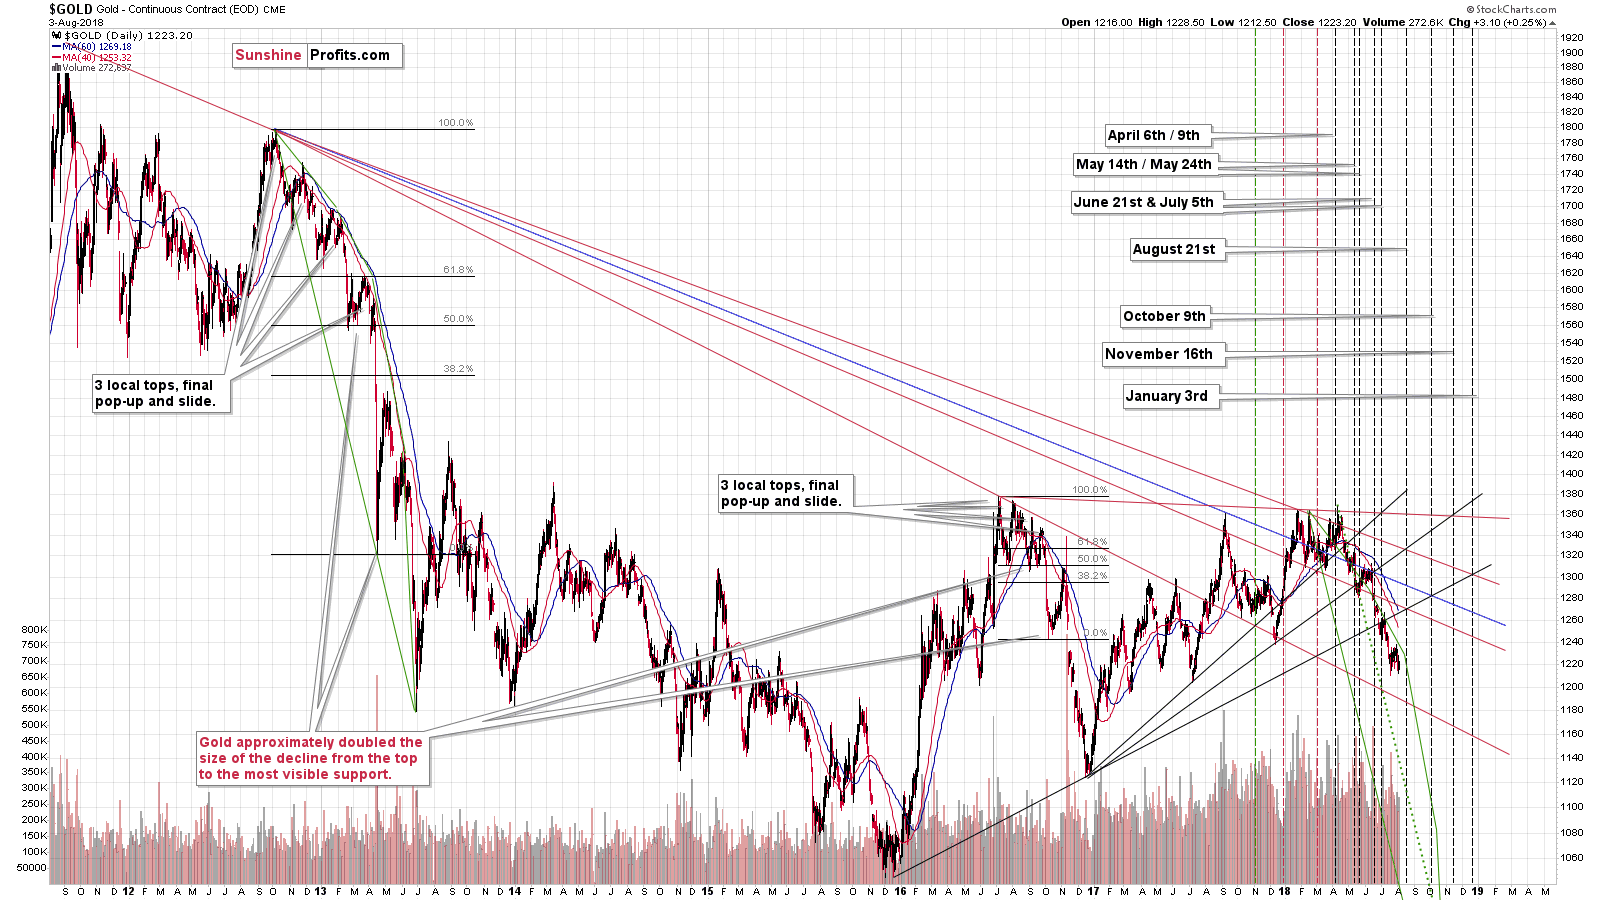
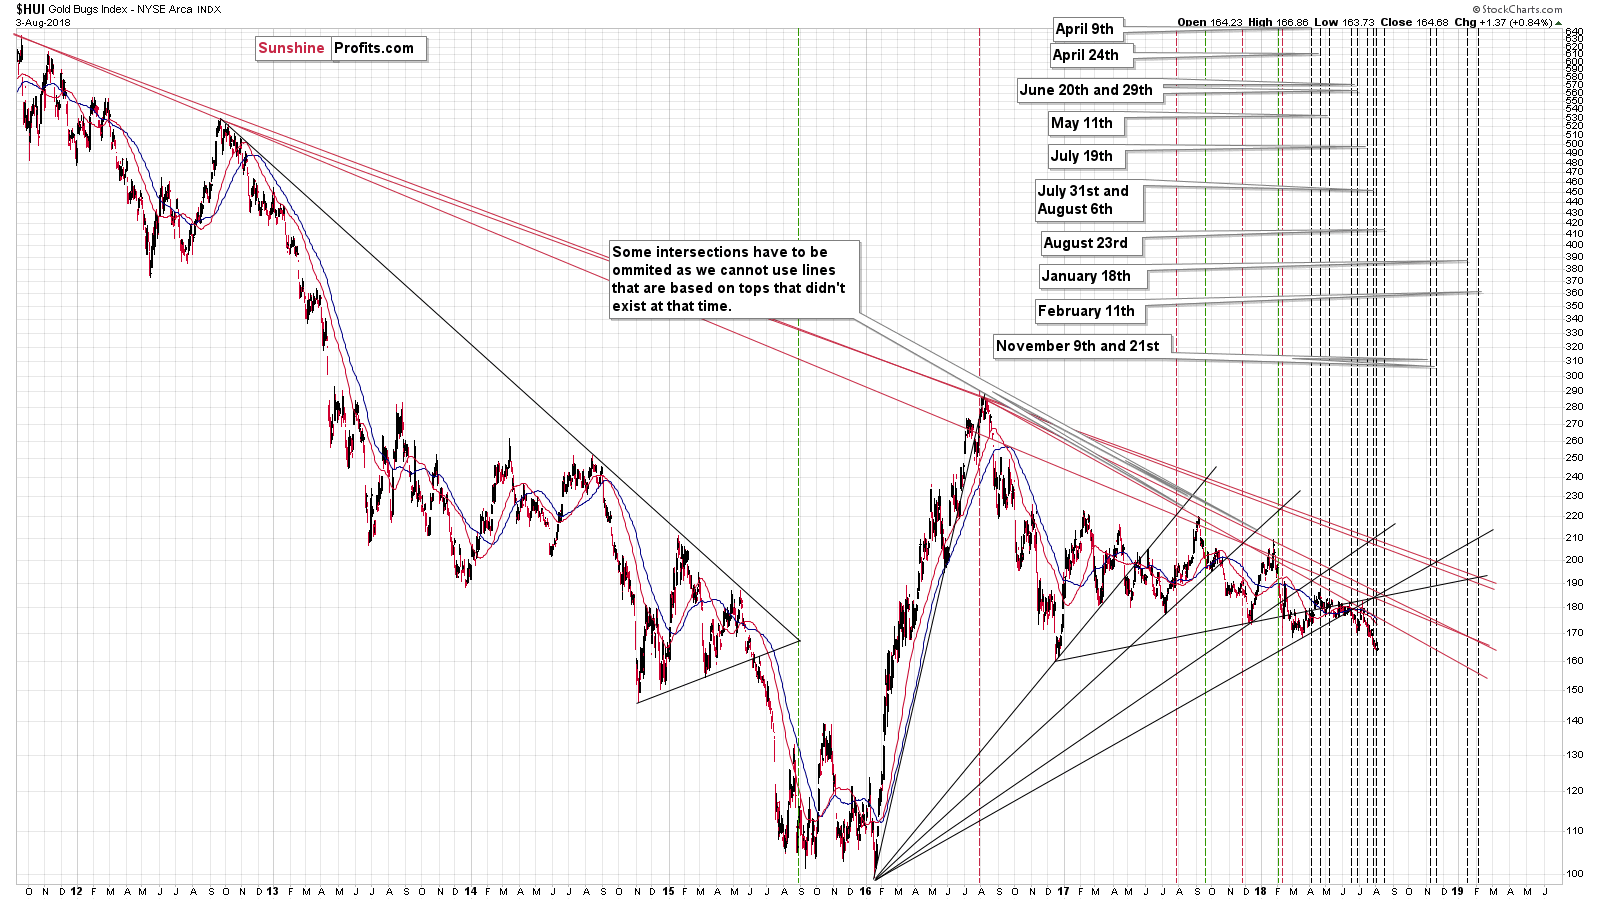
The next reversal date for gold is August 21st and the reversal date for gold stocks is August 23rd. With multiple factors pointing to a looming and significant decline and two important reversal dates in about 2.5 weeks, we can see a sharp slide very, very soon.
The most likely scenario in our view is that we’re going to see a rally in the USD Index to the 98 level or so and this would correspond to a big slide in the metals and miners. The USDX move may not seem significant, but when we take it into account along with the way PMs have recently responded to the moves in the currency markets (magnifying the bearish signs and almost ignoring the bullish signs), it could be a very big deal for gold, silver and mining stocks.
In response to the USD’s rally, gold is likely (based on the data that we have right now) to slide to either the late 2015 low (about $1,050), or the late 2016 low (about $1,120). The latter is more likely.
You may be wondering why we have exit orders in place for the less likely target. The $1,120 - $1,130 range is still rather normal in terms of price targets. If gold gets there, it’s likely to do so in a volatile, but rather normal manner. We will likely get signals to get out of the market manually – it will not be critical to have exit orders in place before this move happens. But there is a good possibility that gold will slide through this level without (!) providing any signals and this is the possibility for which we want to be prepared.
If gold slides through $1,120 - $1,130, then it could very, very quickly go to $1,050 or so. Perhaps even lower, but it’s not as likely as a temporary stop at about $1,050. In this case, we want our exit orders to take us automatically out of the market at these levels, because we may not be able to get out manually in a timely manner.
In other words, gold’s price at $1,120 - $1,130 – on its own – is not enough for us to exit the position. If we get confirmations (and it’s likely that we get them), we’ll most likely exit the position at that time. But if we don’t, we don’t want to be automatically taken out of the market.
Summary
Summing up, the outlook for the precious metals sector is extremely bearish and there are signs that we’re on the verge of seeing another big wave down and that the next local bottom is going to form in about 2.5 weeks. In other words, it seems that our sizable profits on the short positions are going to become even bigger shortly.
As always, we’ll keep you – our subscribers – informed.
To summarize:
Trading capital (supplementary part of the portfolio; our opinion): Full short positions (250% of the full position) in gold, silver and mining stocks are justified from the risk/reward perspective with the following stop-loss orders and exit profit-take price levels:
- Gold: profit-take exit price: $1,062; stop-loss: $1,272; initial target price for the DGLD ETN: $82.96; stop-loss for the DGLD ETN $46.38
- Silver: profit-take exit price: $12.72; stop-loss: $16.46; initial target price for the DSLV ETN: $46.97; stop-loss for the DSLV ETN $24.07
- Mining stocks (price levels for the GDX ETF): profit-take exit price: $13.12; stop-loss: $23.64; initial target price for the DUST ETF: $80.97; stop-loss for the DUST ETF $20.87
In case one wants to bet on junior mining stocks’ prices (we do not suggest doing so – we think senior mining stocks are more predictable in the case of short-term trades – if one wants to do it anyway, we provide the details), here are the stop-loss details and initial target prices:
- GDXJ ETF: profit-take exit price: $17.52; stop-loss: $34.82
- JDST ETF: initial target price: $154.97 stop-loss: $42.78
Long-term capital (core part of the portfolio; our opinion): No positions (in other words: cash)
Insurance capital (core part of the portfolio; our opinion): Full position
Important Details for New Subscribers
Whether you already subscribed or not, we encourage you to find out how to make the most of our alerts and read our replies to the most common alert-and-gold-trading-related-questions.
Please note that the in the trading section we describe the situation for the day that the alert is posted. In other words, it we are writing about a speculative position, it means that it is up-to-date on the day it was posted. We are also featuring the initial target prices, so that you can decide whether keeping a position on a given day is something that is in tune with your approach (some moves are too small for medium-term traders and some might appear too big for day-traders).
Plus, you might want to read why our stop-loss orders are usually relatively far from the current price.
Please note that a full position doesn’t mean using all of the capital for a given trade. You will find details on our thoughts on gold portfolio structuring in the Key Insights section on our website.
As a reminder – “initial target price” means exactly that – an “initial” one, it’s not a price level at which we suggest closing positions. If this becomes the case (like it did in the previous trade) we will refer to these levels as levels of exit orders (exactly as we’ve done previously). Stop-loss levels, however, are naturally not “initial”, but something that, in our opinion, might be entered as an order.
Since it is impossible to synchronize target prices and stop-loss levels for all the ETFs and ETNs with the main markets that we provide these levels for (gold, silver and mining stocks – the GDX ETF), the stop-loss levels and target prices for other ETNs and ETF (among other: UGLD, DGLD, USLV, DSLV, NUGT, DUST, JNUG, JDST) are provided as supplementary, and not as “final”. This means that if a stop-loss or a target level is reached for any of the “additional instruments” (DGLD for instance), but not for the “main instrument” (gold in this case), we will view positions in both gold and DGLD as still open and the stop-loss for DGLD would have to be moved lower. On the other hand, if gold moves to a stop-loss level but DGLD doesn’t, then we will view both positions (in gold and DGLD) as closed. In other words, since it’s not possible to be 100% certain that each related instrument moves to a given level when the underlying instrument does, we can’t provide levels that would be binding. The levels that we do provide are our best estimate of the levels that will correspond to the levels in the underlying assets, but it will be the underlying assets that one will need to focus on regarding the signs pointing to closing a given position or keeping it open. We might adjust the levels in the “additional instruments” without adjusting the levels in the “main instruments”, which will simply mean that we have improved our estimation of these levels, not that we changed our outlook on the markets. We are already working on a tool that would update these levels on a daily basis for the most popular ETFs, ETNs and individual mining stocks.
Our preferred ways to invest in and to trade gold along with the reasoning can be found in the how to buy gold section. Additionally, our preferred ETFs and ETNs can be found in our Gold & Silver ETF Ranking.
As a reminder, Gold & Silver Trading Alerts are posted before or on each trading day (we usually post them before the opening bell, but we don't promise doing that each day). If there's anything urgent, we will send you an additional small alert before posting the main one.
=====
Latest Free Trading Alerts:
Stocks broke above their short-term consolidation on Friday, as investors reacted to the Monthly Jobs Data release. The market got closer to its late July local highs of around 2,850. Will it continue higher?
Breaking Higher? Stocks at a Crossroads
=====
Hand-picked precious-metals-related links:
PRECIOUS-Gold dips on stronger dollar, speculative selling
Massive gold treasure found in Kazakhstan
=====
In other news:
Dollar extends two-week winning streak on trade fears; euro falters
Jamie Dimon Warns of 5% Treasury Yields
‘Respect’ the bond market and what it’s trying to tell us, Fed's Bullard warns
How A Post-Keynesian Economist Sees The Markets Right Now
A Culture War Is Brewing Between Bitcoin’s Old and New Money
Crypto Mining Firm Argo Blockchain Raises $32 Million in Pioneering London IPO
=====
Thank you.
Sincerely,
Przemyslaw Radomski, CFA
Founder, Editor-in-chief, Gold & Silver Fund Manager
Gold & Silver Trading Alerts
Forex Trading Alerts
Oil Investment Updates
Oil Trading Alerts

