

Briefly: In our opinion, full (150% of the regular full position) speculative short positions in gold, silver and mining stocks are justified from the risk/reward perspective at the moment of publishing this alert.
In yesterday’s alert we discussed the price targets for silver, while the preceding alerts featured the targets for gold and mining stocks. As the prices moved higher, we would like to provide an update on the above and discuss yesterday’s relative performances of different parts of the precious metals sector. In other words, we discuss what we can infer from silver’s strong performance and the not-so-strong performance of mining stocks.
Let’s begin by quoting our yesterday’s alert:
In general, price tops in precious metals are often preceded by weak performance in mining stocks and strong – yet temporary – performance of silver. There’s no doubt that mining stocks showed strength this month, in particular at its beginning. However, it seems that we are already seeing the transition from them being the leader to being a laggard. Namely, mining stocks (GDX) were higher by 0.64% yesterday, but the SLV ETF was higher by 1.07%.
In today’s pre-market trading gold is up (at the moment of writing these words) by $3.10 (0.24%) and at the same time silver is up by $0.11 (which is 0.62%). That’s yet another sign showing that the white metal is outperforming on a short-term basis.
The reason that we are focusing on such short-term outperformance signs, is that it is a very short-term rally that we see and a very short-term top that we are aiming to estimate. The fractal nature of the market means that the same phenomenon can be observed in different perspectives. If we are discussing major tops at the end of a major rally (for instance, the mid-2016 top), then we can expect the silver to gold ratio to move higher for weeks before the signal is significant enough to confirm a top. However, if we are discussing a relatively small rally, then a relatively small show of outperformance could be enough to confirm that the top is in or at hand.
So far, we’ve seen some signs which suggests that the end of the upswing is near.
Before yesterday’s session the signs saying that the rally is ending were subtle, but we cannot say the same thing about what happened yesterday.
Gold moved higher, silver soared and mining stocks didn’t just underperform – they actually manage to decline.
Let’s take a look at the charts (chart courtesy of http://stockcharts.com).
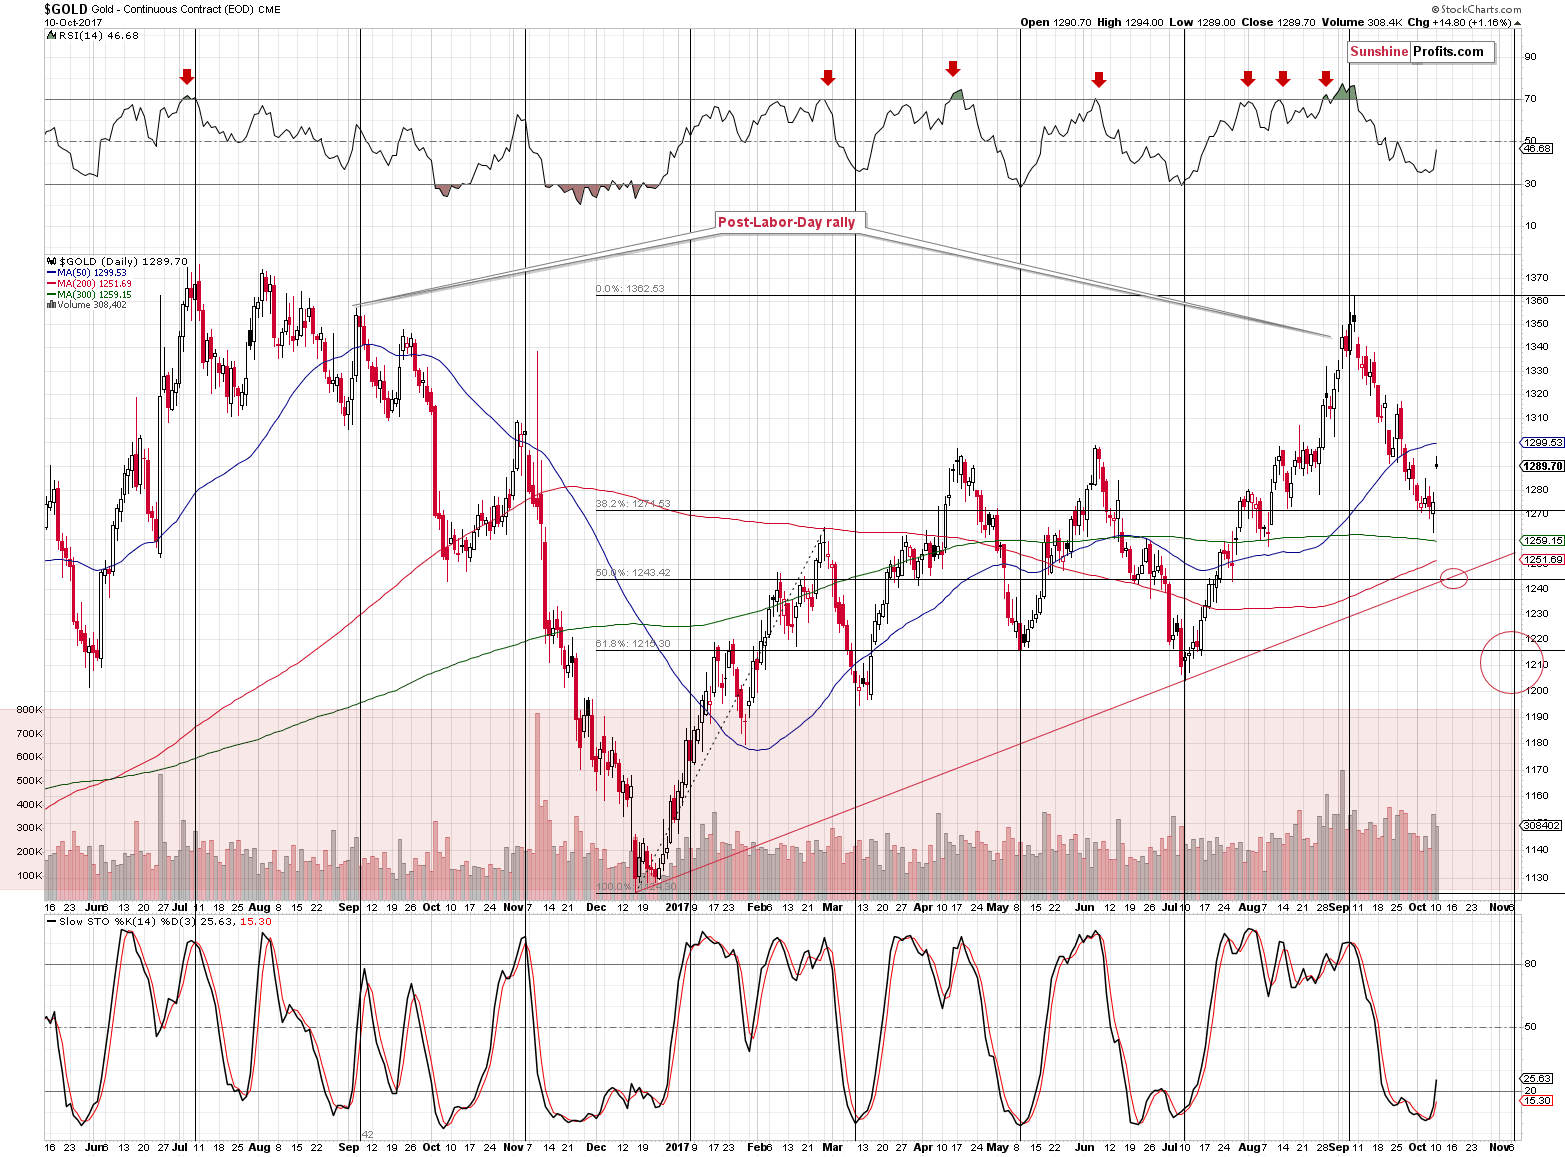
Gold moved higher, but not above the $1,300 level, so what we’re seeing right now seems to be just a verification of the breakdown below this level and the previous 2017 highs.
The resistance of the $1,300 level is strengthened by the 50-day moving average. In September and October 2016 gold also moved back to/above the 50-day MA before sliding further. Yesterday’s intraday high was $1,294 – very close to this level.
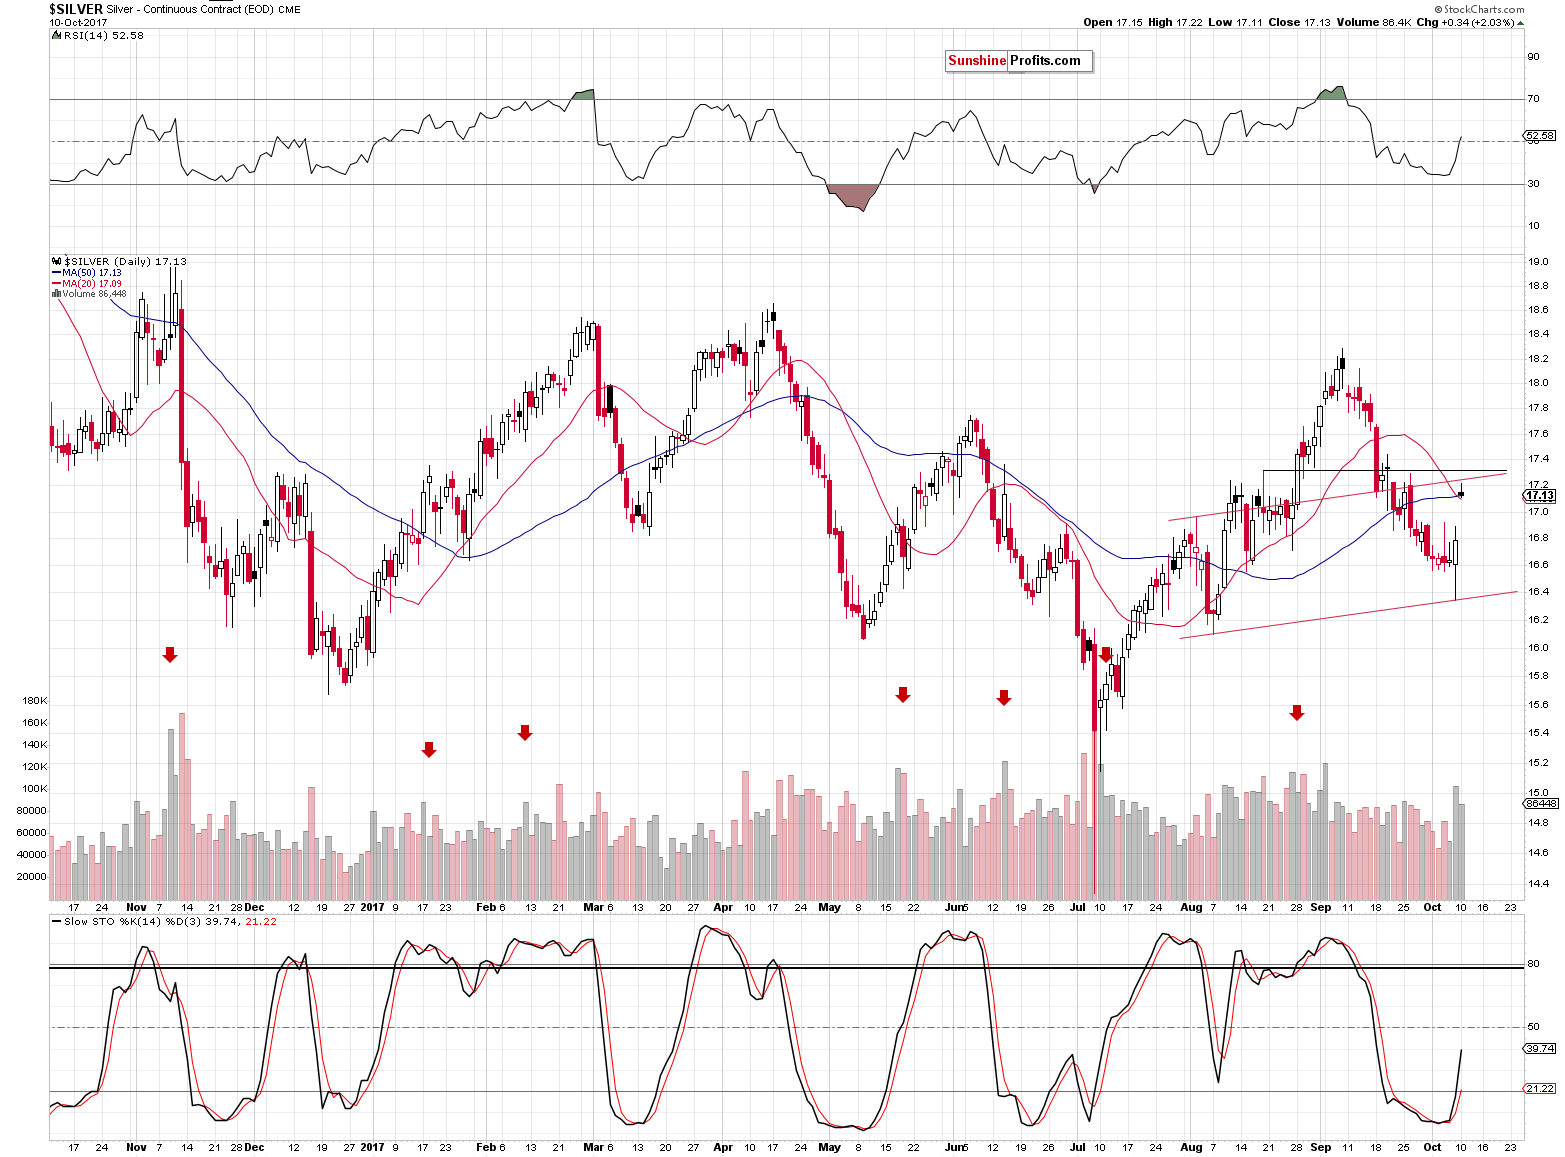
Silver also moved higher toward our target prices, but didn’t exceed them. In yesterday’s alert we wrote the following:
Please note that silver moved back and forth around the $17 level for more than 2 weeks in August, so it wouldn’t be surprising to see some back and forth action also this time.
The moves are quite wide, but that’s exactly what we’re seeing. The white metal was below $17 and is currently back above it. The nearby resistance levels are created by the combination of moving averages (at about $17.10), the rising red support line and the mid-August intraday high at $17.32. Which of these levels is most likely to be reached and trigger a reversal? We’d say that the $17.10 - $17.25 area as that’s where the most daily highs are located.
Silver closed within the above area, but let’s keep in mind that even if it moves a bit higher, it would not change much.
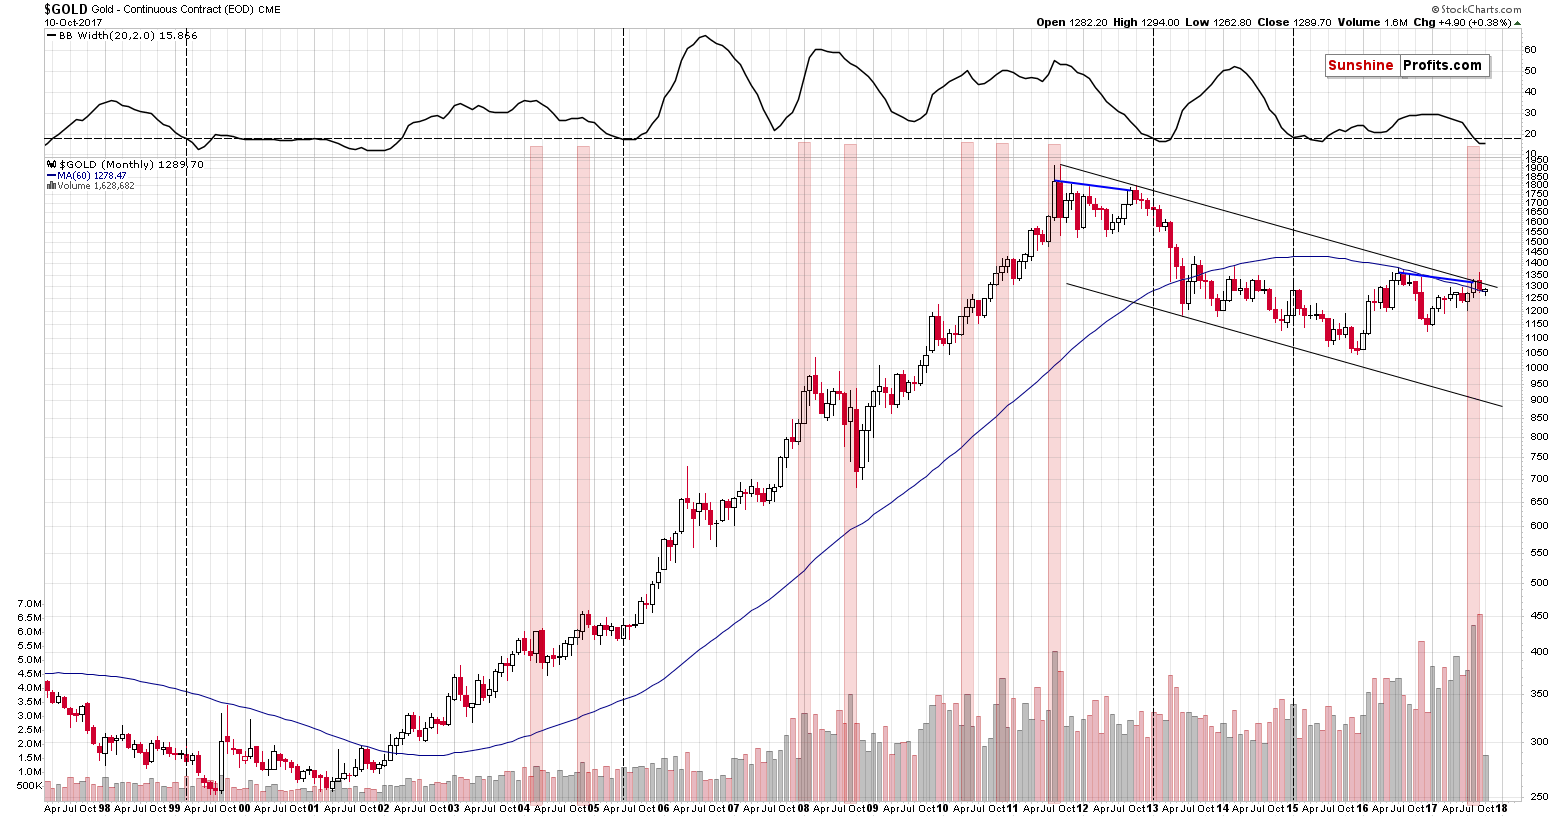
We can say the same thing about gold based on its long-term chart.
On Monday, we wrote the following:
As we discussed previously, the high volume and the analogy to the 2011-2012 trading makes the recent months particularly similar to two cases: the months right after the 2011 top and the months right after the 2012 top. Which of them is more similar is not relevant for today’s discussion as they both point to the possibility of the same outcome in the short term.
Back in 2011, the month right after the top erased the previous month’s gains and the action that followed was a corrective upswing that almost (!) took gold back to the previous high in terms of the monthly closing prices.
Back in 2012, the month right after the top erased almost the entire previous month’s gains and the action that followed was a corrective upswing that almost (!) took gold back to the previous high in terms of the monthly closing prices – temporarily, but still.
So, if the similarity is to continue, gold could (! – doesn’t have to) rally almost to the August 31st closing price, which approximately corresponds to the declining, long-term resistance line and the psychologically important $1,300 level. Consequently, the $1,300 level and its surrounding appears to be the maximum target for the upswing that might have just started. A move to this level would not only not invalidate the bearish long-term analogy – it would be in tune with it.
As you can see on the above chart, gold has not yet reached the resistance line, which is currently at about $1,309. Overall, from the technical point of view not much changed – gold appears to be before a big slide and this week’s upswing doesn’t seem to be anything meaningful.
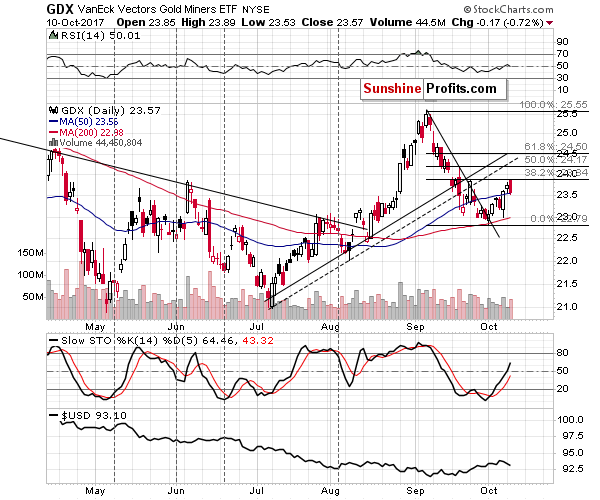
Moreover, the price action in mining stocks strongly suggests that the rally is over or very close to being over.
Gold moved higher yesterday, the general stock market moved higher and the USD Index moved lower – mining stocks had the perfect conditions to continue their rally. If yesterday’s rally had been small, it would be bearish (as it should have been visible). If the miners had closed flat it would be very bearish. But miners declined, erasing the entire previous daily gain and they did so on big volume. That’s a very bearish sign for the short term.
It’s interesting to see how the pattern from the past is repeating itself even though it was first visible almost a decade ago. If this similarity is to continue, then we are about to see something epic in the following weeks. Naturally, we can’t promise that, but the situation in the USD Index supports it as well.
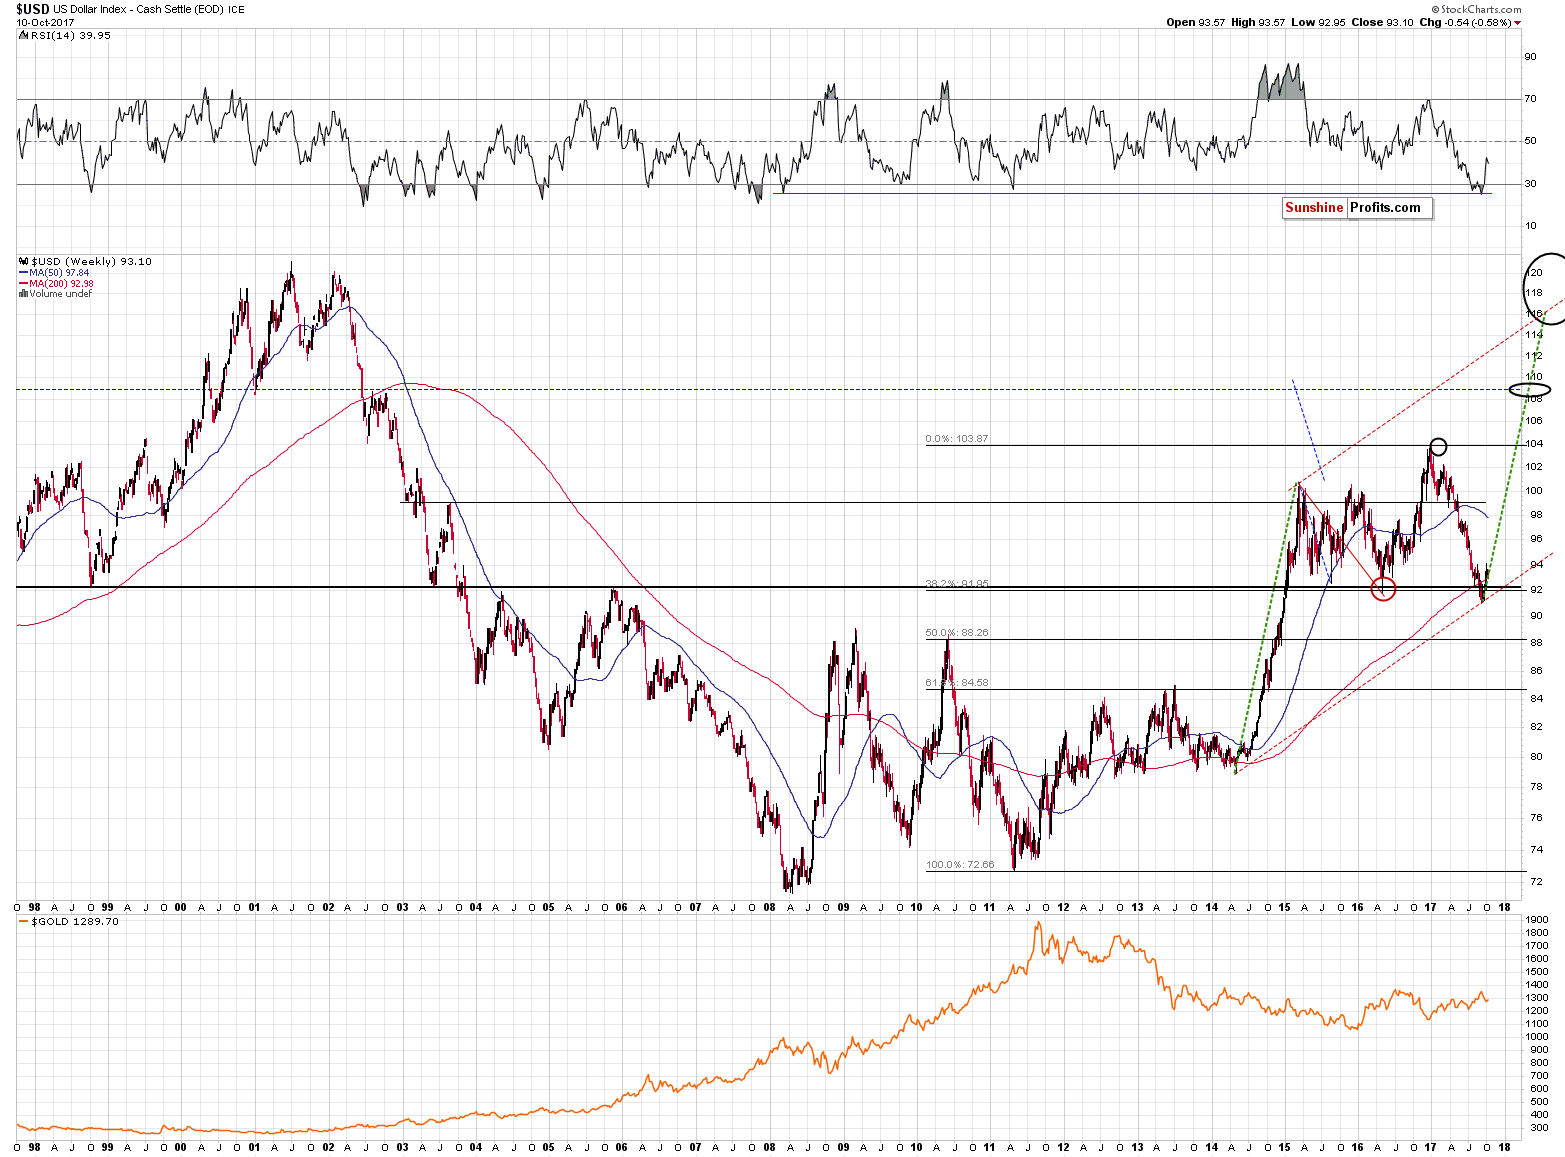
It’s easy to lose the perspective amid intraday price swings, but let’s not forget that the USD Index just (on Friday) invalidated breakdowns below several very important levels in terms of the weekly closing prices, which makes a huge follow-up rally probable. The above prediction is valid for the following weeks and months, not necessarily for the following days, though.

As far as the short term is concerned, we see that the USD Index has already reached its 32.8% Fibonacci retracement level, which could be something that triggers a rebound – it did twice in August. If the above doesn’t stop the decline, then the 92.5 level is very likely to do the job. That’s where we have the 50% Fibonacci retracement, the early September high and a correction to it would be quite in tune with what we saw at the beginning of the previous huge upswing in the USD. On the long-term chart you can see the small dip in mid-2014 – if the follow-up action is to be similar, should one really be concerned about this temporary pullback? Not really.
Summing up, gold, silver and mining stocks all seem to be very close to their upside targets for this short-term corrective upswing. Mining stocks have already declined after reaching our target price, while gold and silver are close enough for the top to be already in, but at the same time they still have some limited room to rally. Silver outperformed while miners declined, which is a classic bearish confirmation. Consequently, it seems that the rally will be over sooner rather than later. Those who engaged in day-trading and aimed to profit on the short-term upswing in the precious metals sector may want to close their long positions at this time or prepare to do so shortly and switch to short ones.
The outlook for the precious metals sector for the following months remains bearish.
As always, we will keep you – our subscribers – informed.
To summarize:
Trading capital (supplementary part of the portfolio; our opinion): Short positions (150% of the full position) in gold, silver and mining stocks are justified from the risk/reward perspective with the following stop-loss orders and initial target price levels / profit-take orders:
- Gold: initial target price level: $1,063; stop-loss: $1,366; initial target price for the DGLD ETN: $81.88; stop-loss for the DGLD ETN $38.74
- Silver: initial target price: $13.12; stop-loss: $19.22; initial target price for the DSLV ETN: $46.18; stop-loss for the DSLV ETN $17.93
- Mining stocks (price levels for the GDX ETF): initial target price: $9.34; stop-loss: $26.34; initial target price for the DUST ETF: $143.56; stop-loss for the DUST ETF $21.37
In case one wants to bet on junior mining stocks' prices (we do not suggest doing so – we think senior mining stocks are more predictable in the case of short-term trades – if one wants to do it anyway, we provide the details), here are the stop-loss details and initial target prices:
- GDXJ ETF: initial target price: $14.13; stop-loss: $45.31
- JDST ETF: initial target price: $417.04; stop-loss: $43.12
Long-term capital (core part of the portfolio; our opinion): No positions (in other words: cash)
Insurance capital (core part of the portfolio; our opinion): Full position
Important Details for New Subscribers
Whether you already subscribed or not, we encourage you to find out how to make the most of our alerts and read our replies to the most common alert-and-gold-trading-related-questions.
Please note that the in the trading section we describe the situation for the day that the alert is posted. In other words, it we are writing about a speculative position, it means that it is up-to-date on the day it was posted. We are also featuring the initial target prices, so that you can decide whether keeping a position on a given day is something that is in tune with your approach (some moves are too small for medium-term traders and some might appear too big for day-traders).
Plus, you might want to read why our stop-loss orders are usually relatively far from the current price.
Please note that a full position doesn’t mean using all of the capital for a given trade. You will find details on our thoughts on gold portfolio structuring in the Key Insights section on our website.
As a reminder – “initial target price” means exactly that – an “initial” one, it’s not a price level at which we suggest closing positions. If this becomes the case (like it did in the previous trade) we will refer to these levels as levels of exit orders (exactly as we’ve done previously). Stop-loss levels, however, are naturally not “initial”, but something that, in our opinion, might be entered as an order.
Since it is impossible to synchronize target prices and stop-loss levels for all the ETFs and ETNs with the main markets that we provide these levels for (gold, silver and mining stocks – the GDX ETF), the stop-loss levels and target prices for other ETNs and ETF (among other: UGLD, DGLD, USLV, DSLV, NUGT, DUST, JNUG, JDST) are provided as supplementary, and not as “final”. This means that if a stop-loss or a target level is reached for any of the “additional instruments” (DGLD for instance), but not for the “main instrument” (gold in this case), we will view positions in both gold and DGLD as still open and the stop-loss for DGLD would have to be moved lower. On the other hand, if gold moves to a stop-loss level but DGLD doesn’t, then we will view both positions (in gold and DGLD) as closed. In other words, since it’s not possible to be 100% certain that each related instrument moves to a given level when the underlying instrument does, we can’t provide levels that would be binding. The levels that we do provide are our best estimate of the levels that will correspond to the levels in the underlying assets, but it will be the underlying assets that one will need to focus on regarding the signs pointing to closing a given position or keeping it open. We might adjust the levels in the “additional instruments” without adjusting the levels in the “main instruments”, which will simply mean that we have improved our estimation of these levels, not that we changed our outlook on the markets. We are already working on a tool that would update these levels on a daily basis for the most popular ETFs, ETNs and individual mining stocks.
Our preferred ways to invest in and to trade gold along with the reasoning can be found in the how to buy gold section. Additionally, our preferred ETFs and ETNs can be found in our Gold & Silver ETF Ranking.
As a reminder, Gold & Silver Trading Alerts are posted before or on each trading day (we usually post them before the opening bell, but we don't promise doing that each day). If there's anything urgent, we will send you an additional small alert before posting the main one.
=====
Hand-picked precious-metals-related links:
PRECIOUS-Gold prices hold steady ahead of Fed minutes
LME to expand trading around gold and silver reference prices
India's Sept gold imports jump 31 pct on festive demand-GFMS
Scientists Find $1.8 Million Worth of Gold in Swiss Wastewater
=====
In other news:
Stocks Gain, With Japan at Decade High; Euro Rise: Markets Wrap
Madrid Keeps Pressure on as Catalans Blink on Independence Bid
Carney Rate Hike Signals Something Rotten in the U.K. Economy
Bank of England's Rate-Rise Case Takes a Hit
Central Bankers Fare Better When They Are Tight Lipped
Will world growth continue or are we heading for a slowdown?
=====
Thank you.
Sincerely,
Przemyslaw Radomski, CFA
Founder, Editor-in-chief, Gold & Silver Fund Manager
Gold & Silver Trading Alerts
Forex Trading Alerts
Oil Investment Updates
Oil Trading Alerts

