

Briefly: In our opinion, full (150% of the regular full position) speculative short positions in gold, silver and mining stocks are justified from the risk/reward perspective at the moment of publishing this alert.
Gold, silver and mining stocks initially declined on Friday but quickly reversed their direction and rallied sharply, closing above their previous closing prices and creating a bullish daily reversal. How high can gold rally?
Before moving further, we would like to stress that the above question assumes that gold will rally at all, which – as you will see later on - is not imminent. Therefore, the reply to the above question will be the potential and possible upside target price, which is more like a “maximum probable size of the upswing” than a “likely target for this week”.
Having said that, let’s move to charts. This time, we’ll start with gold (chart courtesy of http://stockcharts.com), starting with the forest instead of individual trees. In other words, we’ll first look at the long-term picture.
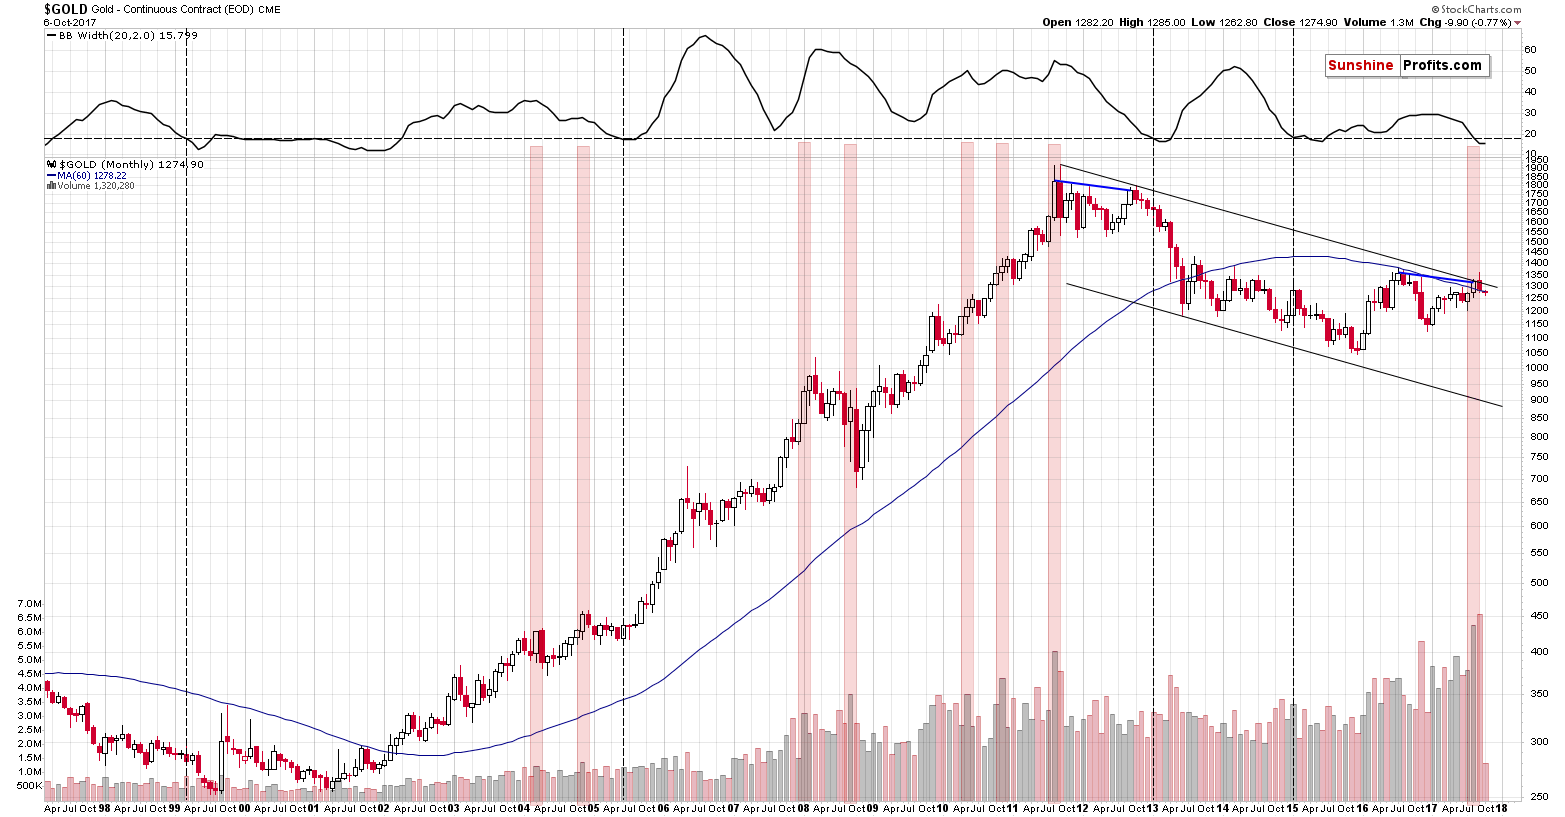
As we discussed previously, the high volume and the analogy to the 2011-2012 trading makes the recent months particularly similar to two cases: the months right after the 2011 top and the months right after the 2012 top. Which of them is more similar is not relevant for today’s discussion as they both point to the possibility of the same outcome in the short term.
Back in 2011, the month right after the top erased the previous month’s gains and the action that followed was a corrective upswing that almost (!) took gold back to the previous high in terms of the monthly closing prices.
Back in 2012, the month right after the top erased almost the entire previous month’s gains and the action that followed was a corrective upswing that almost (!) took gold back to the previous high in terms of the monthly closing prices – temporarily, but still.
So, if the similarity is to continue, gold could (! – doesn’t have to) rally almost to the August 31st closing price, which approximately corresponds to the declining, long-term resistance line and the psychologically important $1,300 level. Consequently, the $1,300 level and its surrounding appears to be the maximum target for the upswing that might have just started. A move to this level would not only not invalidate the bearish long-term analogy – it would be in tune with it.
In Friday’s alert, we wrote the following:
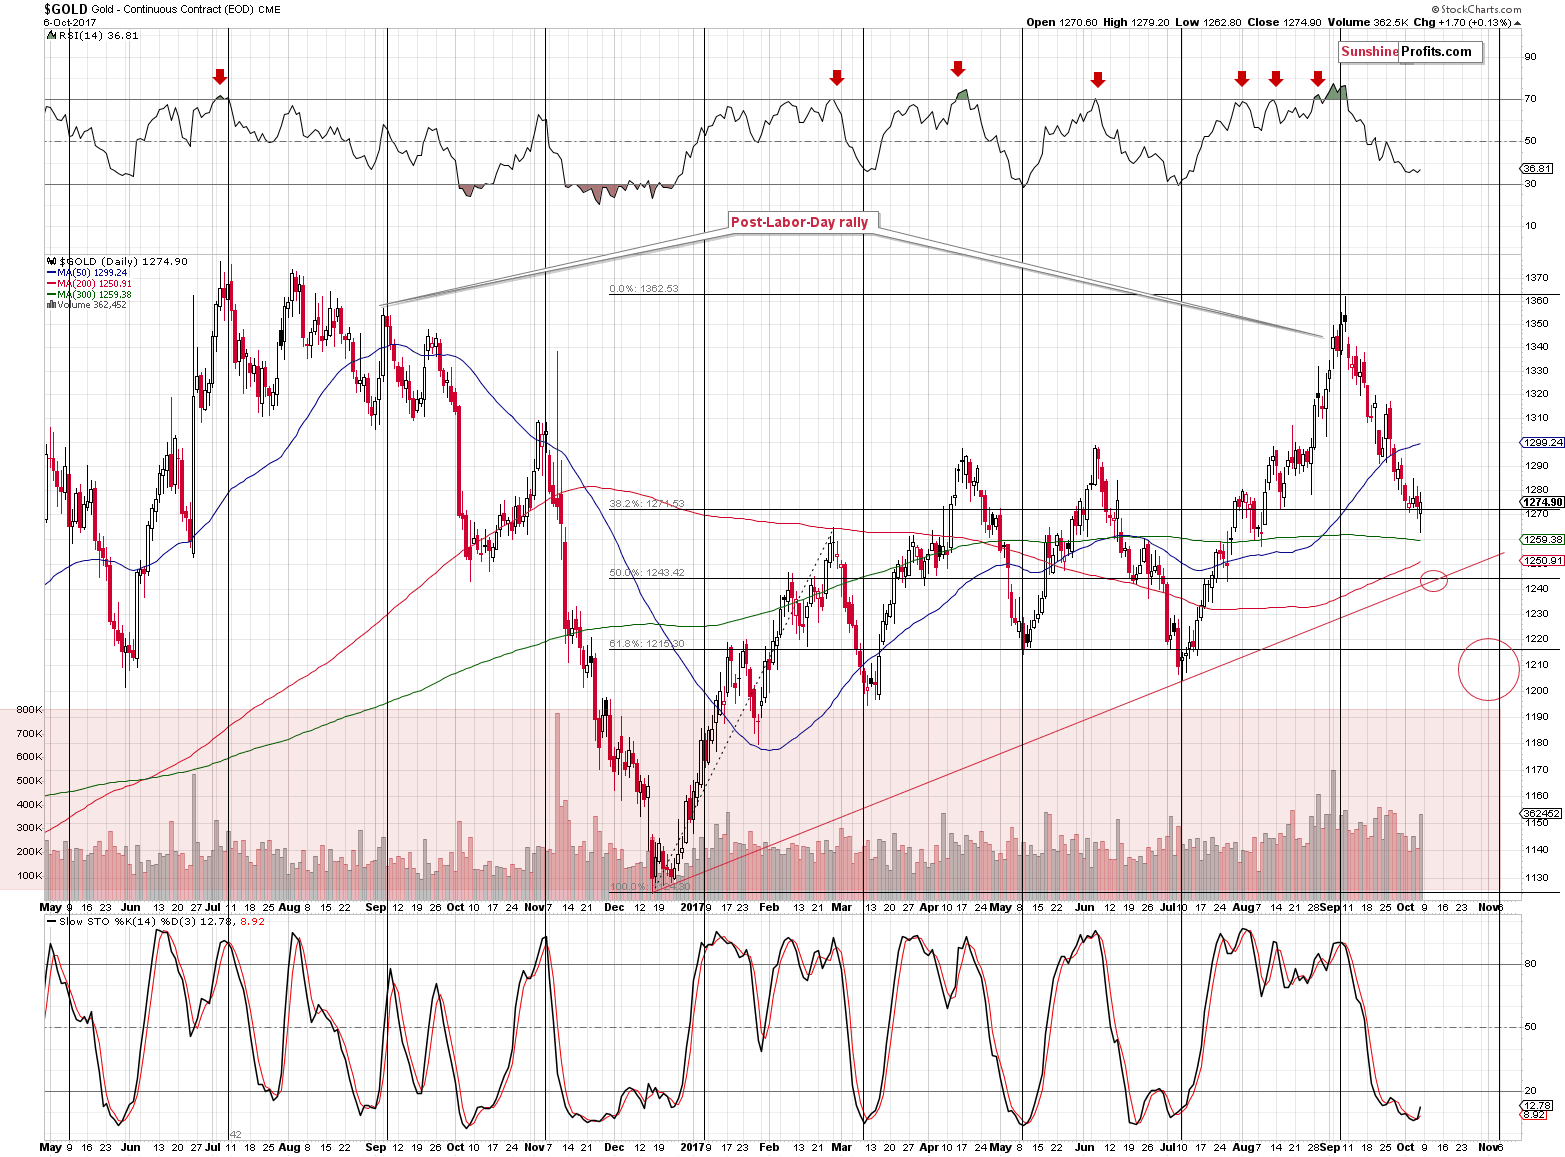
As you can see on the above chart, the turning points have almost always been effective. The only exception is the December 2016 bottom, which was still relatively close to the turning point (the start of the rally that is).
Let’s stay with what we mean by efficiency in this case. The above doesn’t imply that all important bottoms and tops have to take place near the turning point. It does, however, imply that once the turning point does take place, then we are likely to see a reversal.
Consequently, just because there is no turning point next week, it doesn’t mean that there will be no corrective upswing from the $1,244 level or so (should it be reached next week, which appears likely based on the pace at which gold has been declining in the past few weeks).
It means, however, that we should expect a turnaround at the beginning of the next month. Based on the current pace of gold’s decline, we could see gold close to $1,200 – in other words, close to its 61.8% Fibonacci retracement, previous highs, and the support line based on the December 2015 and December 2016 highs (not visible on the above chart). If gold is indeed close to $1,200 in a month or so, it will mean a big chance of a corrective upswing.
However, the turning point could play out differently – we could get a rebound from the $1,240 - $1,250 area and then a rally that ends at the beginning of November and we could see a sharp decline in the following part of the month (similarly to what we saw in November 2016).
At this time both scenarios seem equally probable. Things should get clearer in the following days and weeks as we see how gold declines (in terms of sharpness, levels reached, the indicators’ movement) and what accompanies this move in other markets.
The above remains up-to-date, however, based on Friday’s big-volume reversal, we could get a short-term upswing right away. The RSI didn’t move to 30 and the buy signal from the Stochastic indicator based on the daily closing prices alone is not a strong one. As far as the reversal is concerned, it was not a clear one as gold didn’t end the session at its highs – the difference between the intraday high and the closing price was almost $5.
Let’s zoom in even more.
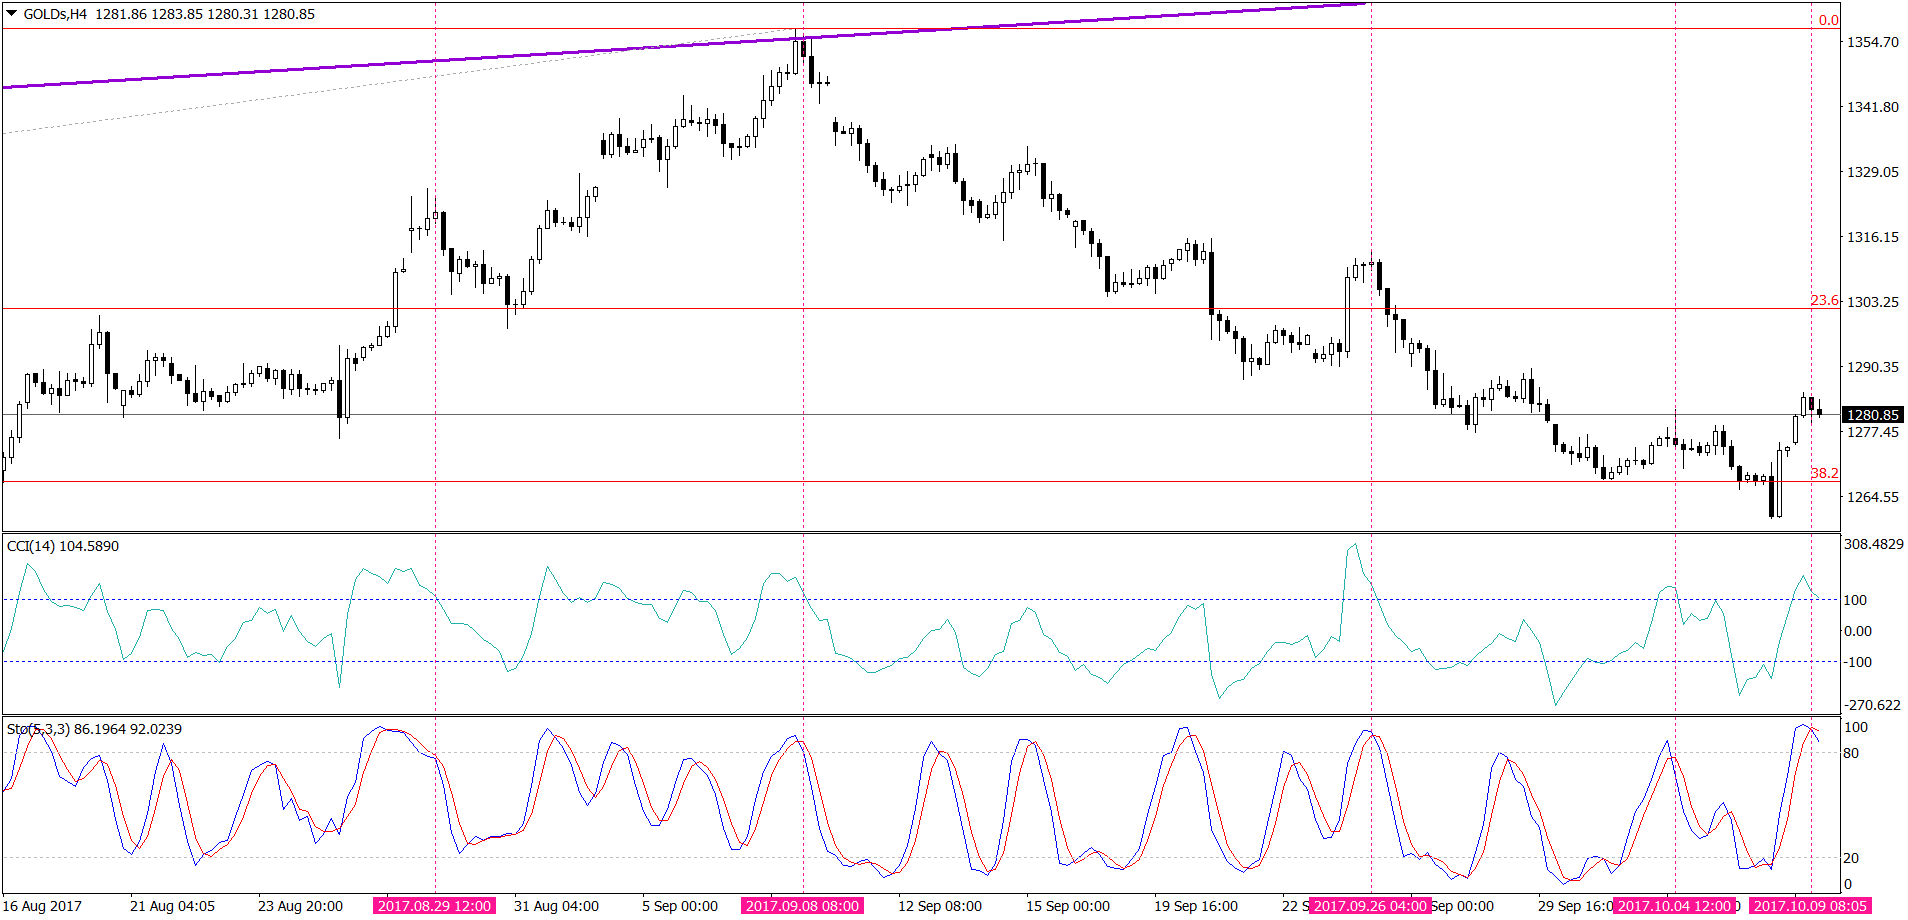
The above chart features 4-hour candlesticks. This perspective is quite useful for intraday trades, but in this case, it can also give us insight into Friday’s rally and allow us to compare it with other similar moves.
First of all, please note how similar the most recent rally is to what we saw in the final part of September (right before the September 26 top). In both cases, the rally took form of a one huge candlestick and then 3 smaller ones and then a decline.
The second thing is that the short-term indicators (Stochastic and CCI) further confirm this analogy and they also make the situation similar to two other cases that we saw after sharp short-term upswings (red, dashed lines). This time, the CCI hasn’t flashed a sell signal yet, but the situations are similar anyway (the shape of the indicator). The sell signal would serve as a confirmation.
All in all, while there are good reasons to be excited about Friday’s late-session upswing, there are also good reasons to believe that the follow-up rally is already over.
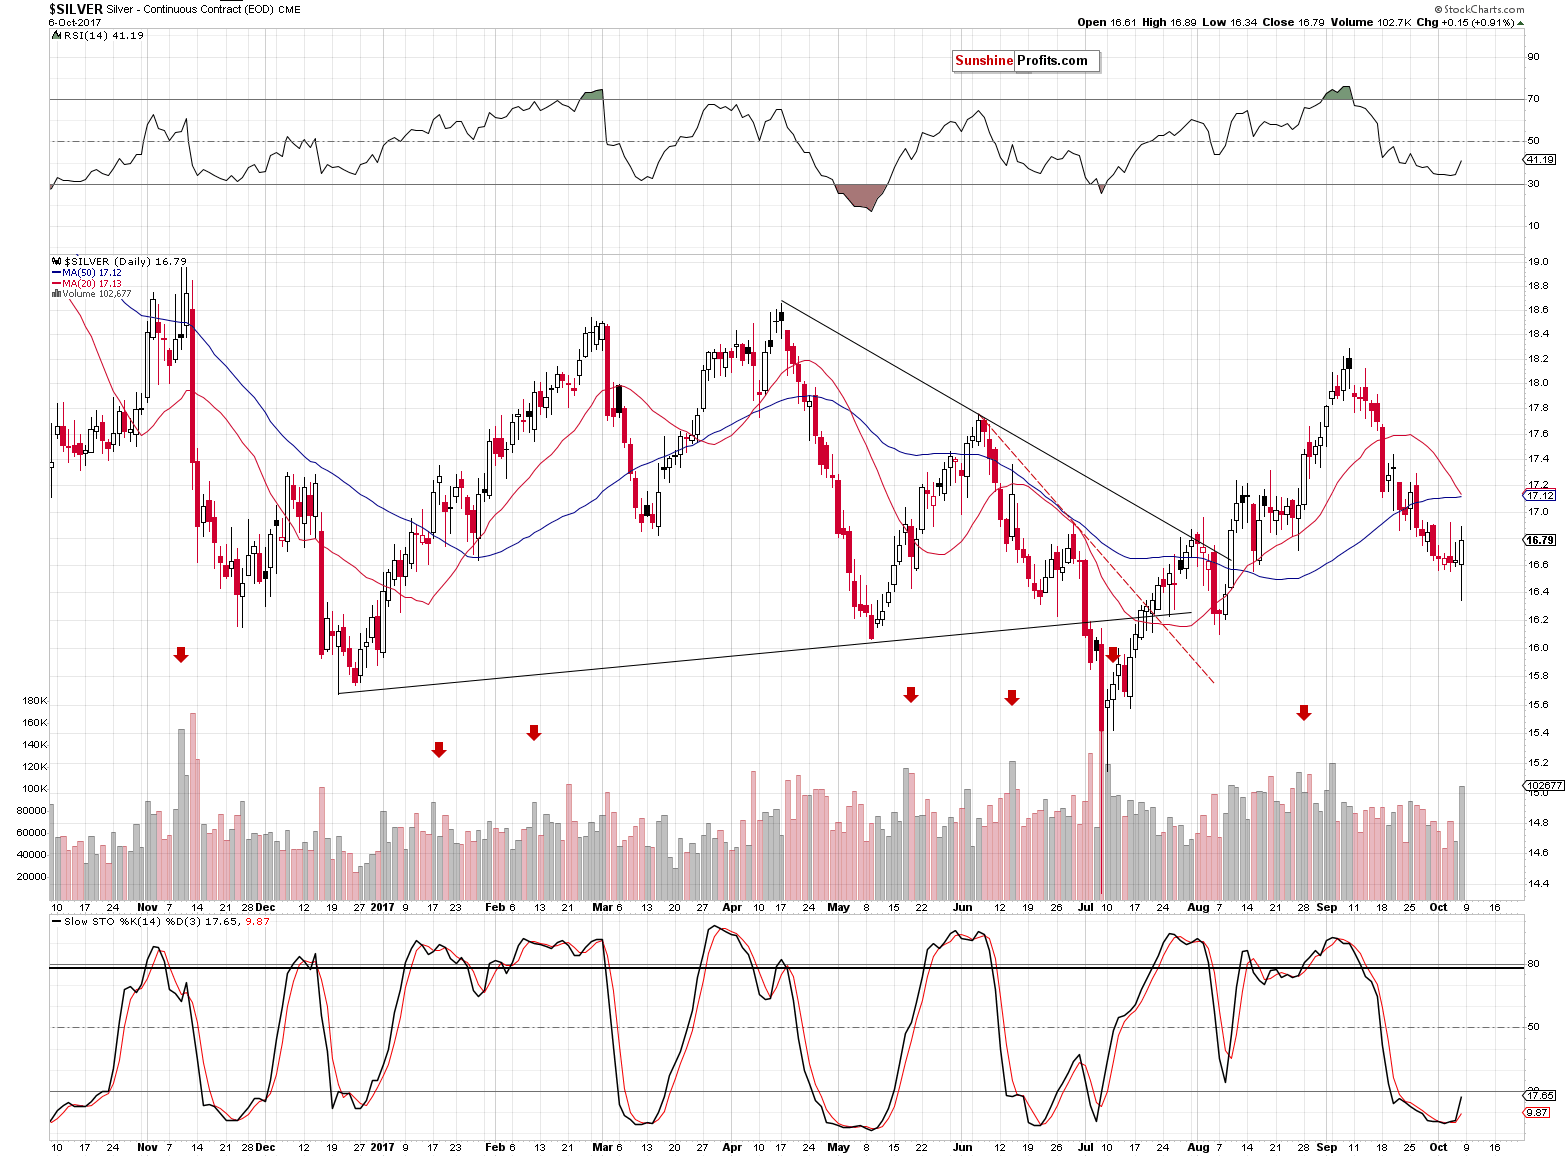
The silver price rallied visibly, but silver is known for fake moves, so it’s not that reliable. You can see some of these moves on the above chart: on June 26th, silver formed a reversal which was followed by only three days of higher prices – a huge slide followed them. Another example is the April 24 reversal – it was followed by 11 days of constantly lower prices.
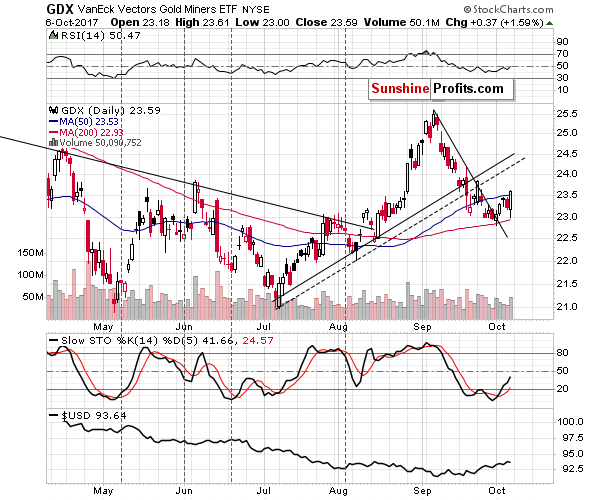
Mining stocks were strong once again and they closed the Friday session slightly above their 50-day moving average. So far, this action is in tune with what we wrote previously and with the previous corrective upswings, for instance, the June correction – the Stochastic and RSI indicators are also at similar levels.
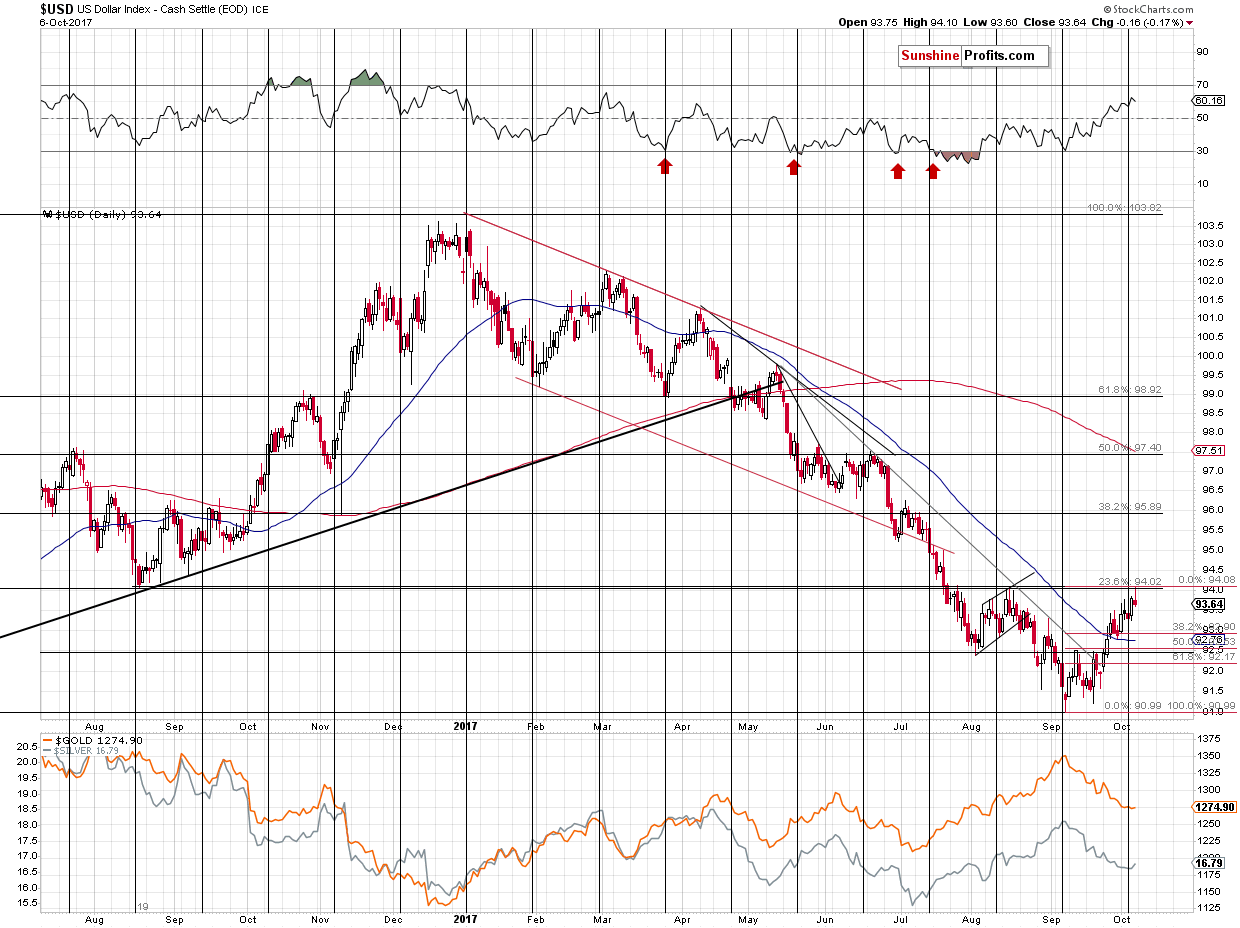
The situation on the USD Index chart is ambiguous. On the above chart we see that the USD Index moved to the Fibonacci resistance level and reversed, while invalidating the breakout above the August highs (in terms of both: intraday prices and daily closing prices). The implications should therefore be bearish.
However, based on the USDX prices from other sources the closing price was about 93.80, which is above the August high in terms of the daily closing price, and therefore, the breakout was not invalidated. In fact, the USD Index is trading a bit above the August high (in daily closing prices) at the moment of writing these words. From this perspective, we saw a breakout above an important resistance and a pause after reaching the Fibonacci retracement – which is quite normal. The implications are therefore not bearish.
Moreover, in the case of individual currency pairs, it is only the USDCHF pair that shows willingness to reverse its course. The EURUSD moved to a support level, just as the USD Index moved to a resistance, but nothing spectacular changed based on the above in the case of the former.
All in all, the above chart doesn’t tell us precisely whether a downswing here is likely, but it does tell us where the USD Index might stop if the decline does indeed materialize – it’s the same level that we described previously – 92.5. That’s where we have the 50% Fibonacci retracement, the early September high and a correction to it would be quite in tune with what we saw at the beginning of the previous huge upswing in the USD.
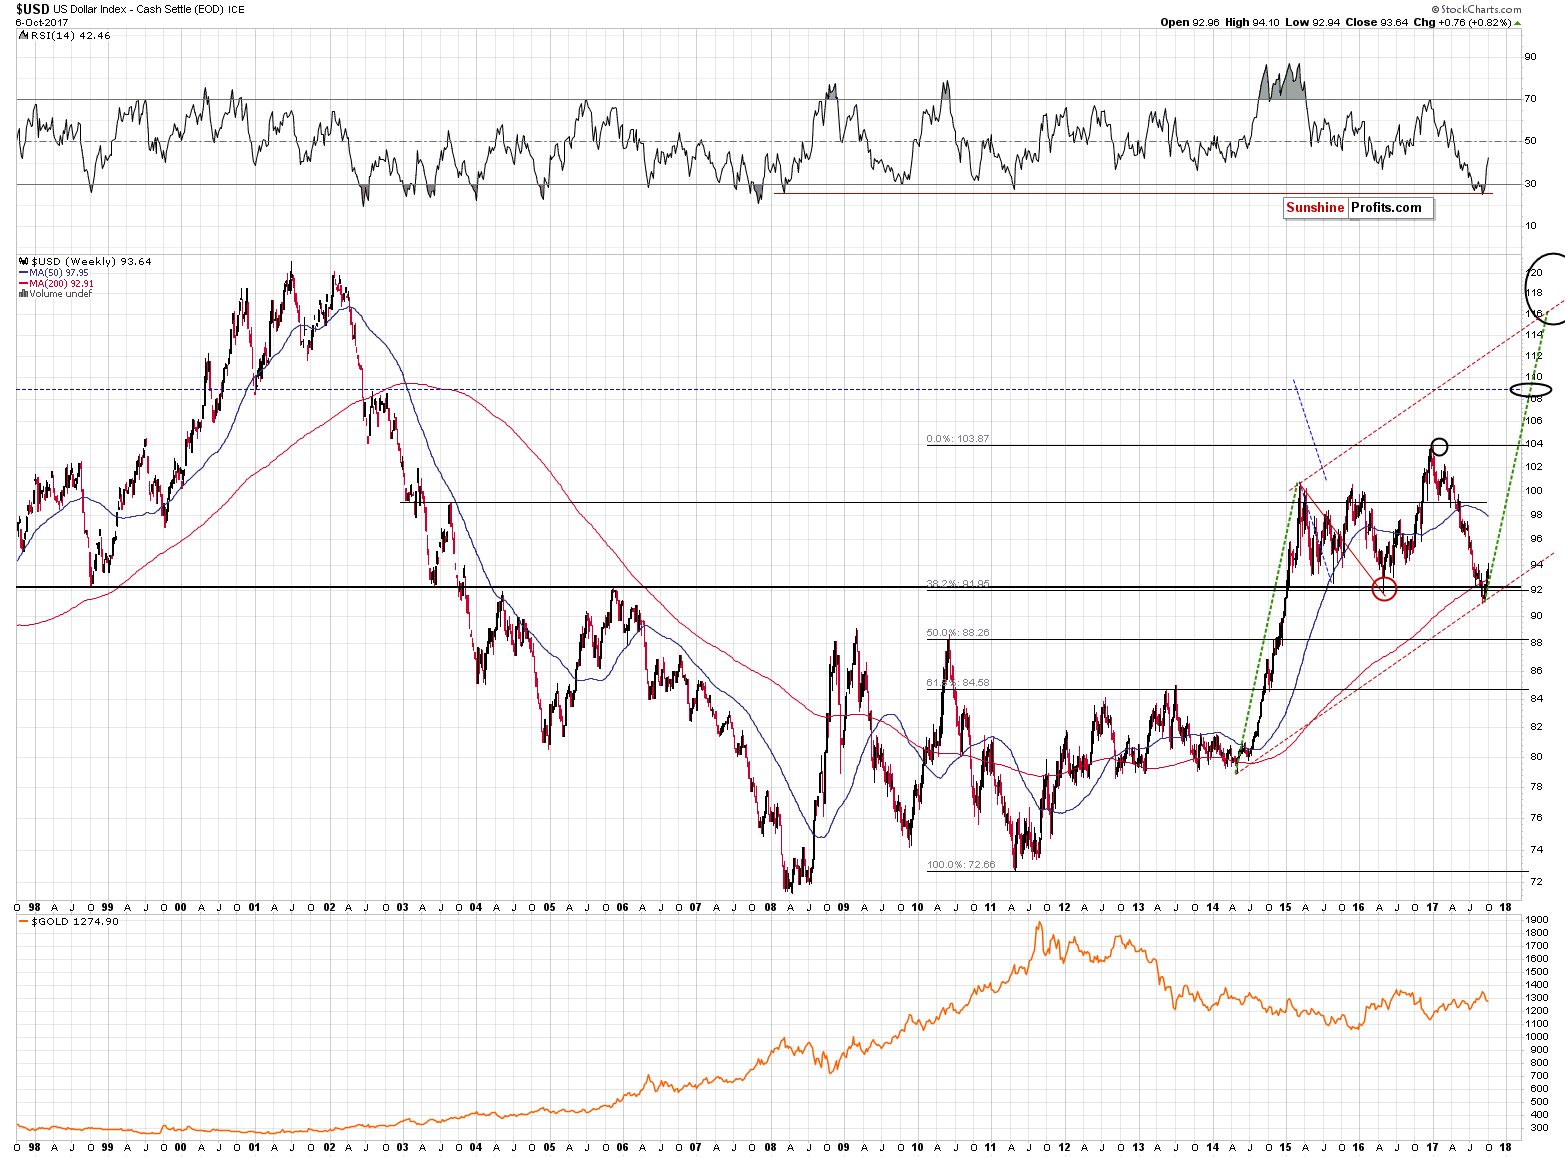
The rally that started in 2014 from below the 200-week moving average took the USD above it and then we saw a correction of about half of the upswing. After that, the USD soared and almost didn’t look back until it was about 20 index points higher. The short-term implications may be bearish, but the medium-term outlook remains strongly bullish.
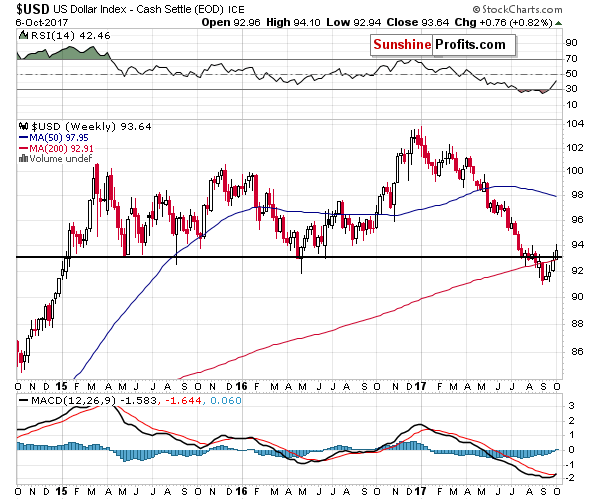
Both above charts show that the USD closed the week well above all previous important weekly extremes. Therefore, all breakdowns were just invalidated and that made the outlook clearly bullish for the following weeks and months.
Summing up, there are multiple strong, long-term signals pointing to much lower prices of precious metals in the following weeks and months, and it seems that the current pause (metals) / upswing (miners) is either over or has quite limited potential ($20 or so in the case of gold). Overall, it doesn’t seem that adjusting the trading position is justified at this time (unless one is day-trading – in this case, the precious metals sector could provide a trading opportunity) – it seems that it would add risk (of missing a volatile slide), while not providing much of a potential profit. It might become justified (even to a point of entering a small long position) if we get additional bullish signs, though, for instance if gold moves below $1,250 and silver moves below $16.10. Gold could also rally temporarily from approximately $1,200 and either this or a decline after a corrective rally is likely to take place in early November based on gold’s turning point.
As always, we will keep you – our subscribers – informed.
To summarize:
Trading capital (supplementary part of the portfolio; our opinion): Short positions (150% of the full position) in gold, silver and mining stocks are justified from the risk/reward perspective with the following stop-loss orders and initial target price levels / profit-take orders:
- Gold: initial target price level: $1,063; stop-loss: $1,366; initial target price for the DGLD ETN: $81.88; stop-loss for the DGLD ETN $38.74
- Silver: initial target price: $13.12; stop-loss: $19.22; initial target price for the DSLV ETN: $46.18; stop-loss for the DSLV ETN $17.93
- Mining stocks (price levels for the GDX ETF): initial target price: $9.34; stop-loss: $26.34; initial target price for the DUST ETF: $143.56; stop-loss for the DUST ETF $21.37
In case one wants to bet on junior mining stocks' prices (we do not suggest doing so – we think senior mining stocks are more predictable in the case of short-term trades – if one wants to do it anyway, we provide the details), here are the stop-loss details and initial target prices:
- GDXJ ETF: initial target price: $14.13; stop-loss: $45.31
- JDST ETF: initial target price: $417.04; stop-loss: $43.12
Long-term capital (core part of the portfolio; our opinion): No positions (in other words: cash)
Insurance capital (core part of the portfolio; our opinion): Full position
Important Details for New Subscribers
Whether you already subscribed or not, we encourage you to find out how to make the most of our alerts and read our replies to the most common alert-and-gold-trading-related-questions.
Please note that the in the trading section we describe the situation for the day that the alert is posted. In other words, it we are writing about a speculative position, it means that it is up-to-date on the day it was posted. We are also featuring the initial target prices, so that you can decide whether keeping a position on a given day is something that is in tune with your approach (some moves are too small for medium-term traders and some might appear too big for day-traders).
Plus, you might want to read why our stop-loss orders are usually relatively far from the current price.
Please note that a full position doesn’t mean using all of the capital for a given trade. You will find details on our thoughts on gold portfolio structuring in the Key Insights section on our website.
As a reminder – “initial target price” means exactly that – an “initial” one, it’s not a price level at which we suggest closing positions. If this becomes the case (like it did in the previous trade) we will refer to these levels as levels of exit orders (exactly as we’ve done previously). Stop-loss levels, however, are naturally not “initial”, but something that, in our opinion, might be entered as an order.
Since it is impossible to synchronize target prices and stop-loss levels for all the ETFs and ETNs with the main markets that we provide these levels for (gold, silver and mining stocks – the GDX ETF), the stop-loss levels and target prices for other ETNs and ETF (among other: UGLD, DGLD, USLV, DSLV, NUGT, DUST, JNUG, JDST) are provided as supplementary, and not as “final”. This means that if a stop-loss or a target level is reached for any of the “additional instruments” (DGLD for instance), but not for the “main instrument” (gold in this case), we will view positions in both gold and DGLD as still open and the stop-loss for DGLD would have to be moved lower. On the other hand, if gold moves to a stop-loss level but DGLD doesn’t, then we will view both positions (in gold and DGLD) as closed. In other words, since it’s not possible to be 100% certain that each related instrument moves to a given level when the underlying instrument does, we can’t provide levels that would be binding. The levels that we do provide are our best estimate of the levels that will correspond to the levels in the underlying assets, but it will be the underlying assets that one will need to focus on regarding the signs pointing to closing a given position or keeping it open. We might adjust the levels in the “additional instruments” without adjusting the levels in the “main instruments”, which will simply mean that we have improved our estimation of these levels, not that we changed our outlook on the markets. We are already working on a tool that would update these levels on a daily basis for the most popular ETFs, ETNs and individual mining stocks.
Our preferred ways to invest in and to trade gold along with the reasoning can be found in the how to buy gold section. Additionally, our preferred ETFs and ETNs can be found in our Gold & Silver ETF Ranking.
As a reminder, Gold & Silver Trading Alerts are posted before or on each trading day (we usually post them before the opening bell, but we don't promise doing that each day). If there's anything urgent, we will send you an additional small alert before posting the main one.
=====
Latest Free Trading Alerts:
The U.S. economy cut 33,000 jobs in September. What does it mean for the gold market?
Payrolls in September 2017 and Gold
S&P 500 index lost 0.1% on Friday, as investors reacted to economic data releases, among others. Will uptrend continue? Or is this some topping pattern before downward reversal?
S&P 500 At Record High But Will Stocks Continue Even Higher?
We saw a period of depreciation. This came on the heels of a rebound. What might this mean for the Bitcoin market?
=====
Hand-picked precious-metals-related links:
PRECIOUS-Gold hits 1-week high amid renewed North Korea fears
Gold Speculators Cut Back On Bullish Net Positions For 3rd Week
Jewelers Rally After India Anti-Money-Laundering Rule Reversal
Asia gold-transparency law and smuggling take shine off festival season
Can Mali maintain its gold mining status?
=====
In other news:
China survey puts services growth at 21-month low, blurs picture of resilient economy
Spain Warns Catalonia Independence Bid Risks Economic Meltdown
Catalonia and Spain Need Outside Mediation
Turkish Markets Tumble as Diplomatic Row With U.S. Escalates
China's tech stocks are partying like it's 1999
ECB says euro zone banks well prepared for rate shocks
IMF warnings on economy will fall on deaf ears among world leaders
=====
Thank you.
Sincerely,
Przemyslaw Radomski, CFA
Founder, Editor-in-chief, Gold & Silver Fund Manager
Gold & Silver Trading Alerts
Forex Trading Alerts
Oil Investment Updates
Oil Trading Alerts

