

Briefly: in our opinion, full (300% of the regular position size) speculative short positions in junior mining stocks are justified from the risk/reward point of view at the moment of publishing this Alert.
Yesterday’s session was particularly uneventful in the case of the precious metals market, as crude oil and the general stock market stole the spotlight.
Consequently, today’s analysis will focus on what’s happening in pre-market trading, as that’s what appears to be more important.
At the moment of writing these words, gold is up very modestly – less than 0.2%.
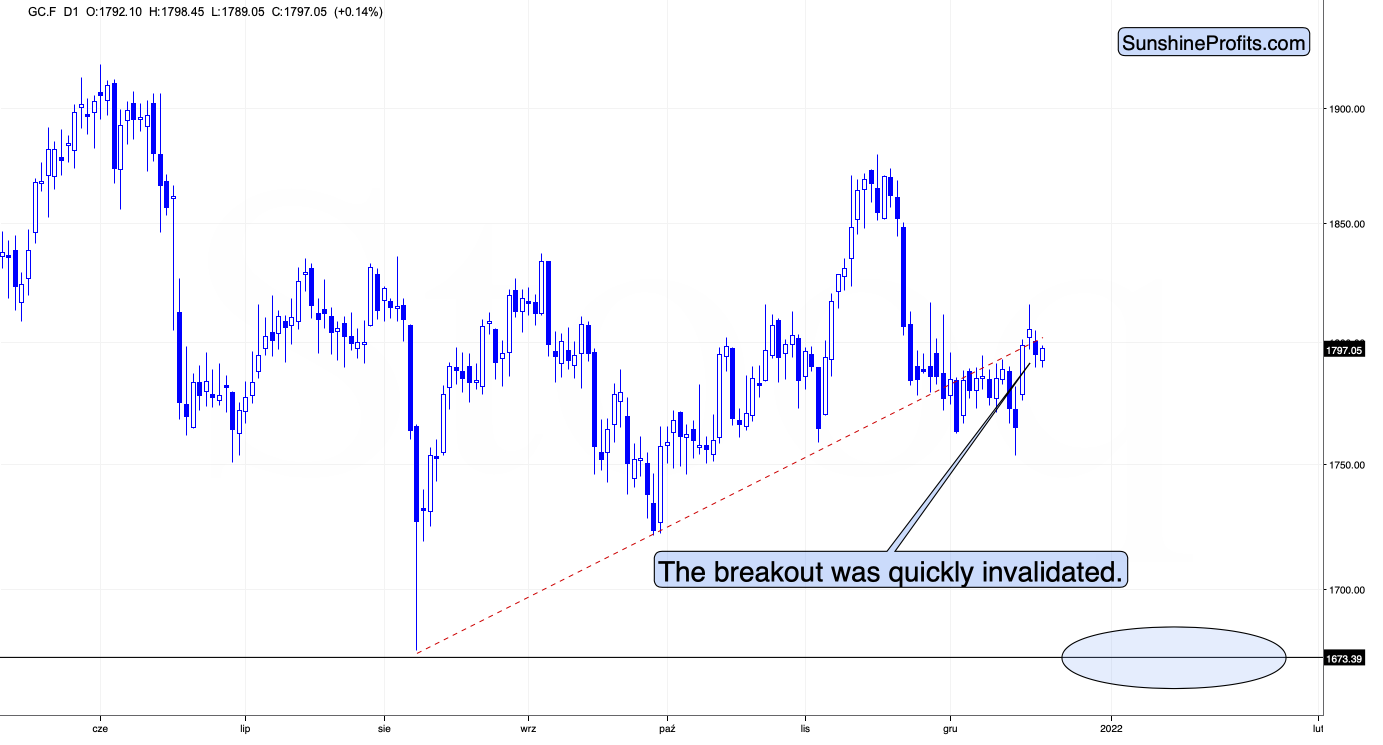
Consequently, after rallying to about $1,815 (in tune with my Thursday’s analysis) and invalidating the breakout above the rising resistance line, gold appears to be making another attempt to rally, but the strength of the move is very limited.
Predicting higher gold prices might not be the best idea here, as the yellow metal was not able to even get to the red line, let alone to its previous monthly high.
Silver, on the other hand, has moved quite visibly higher so far today.
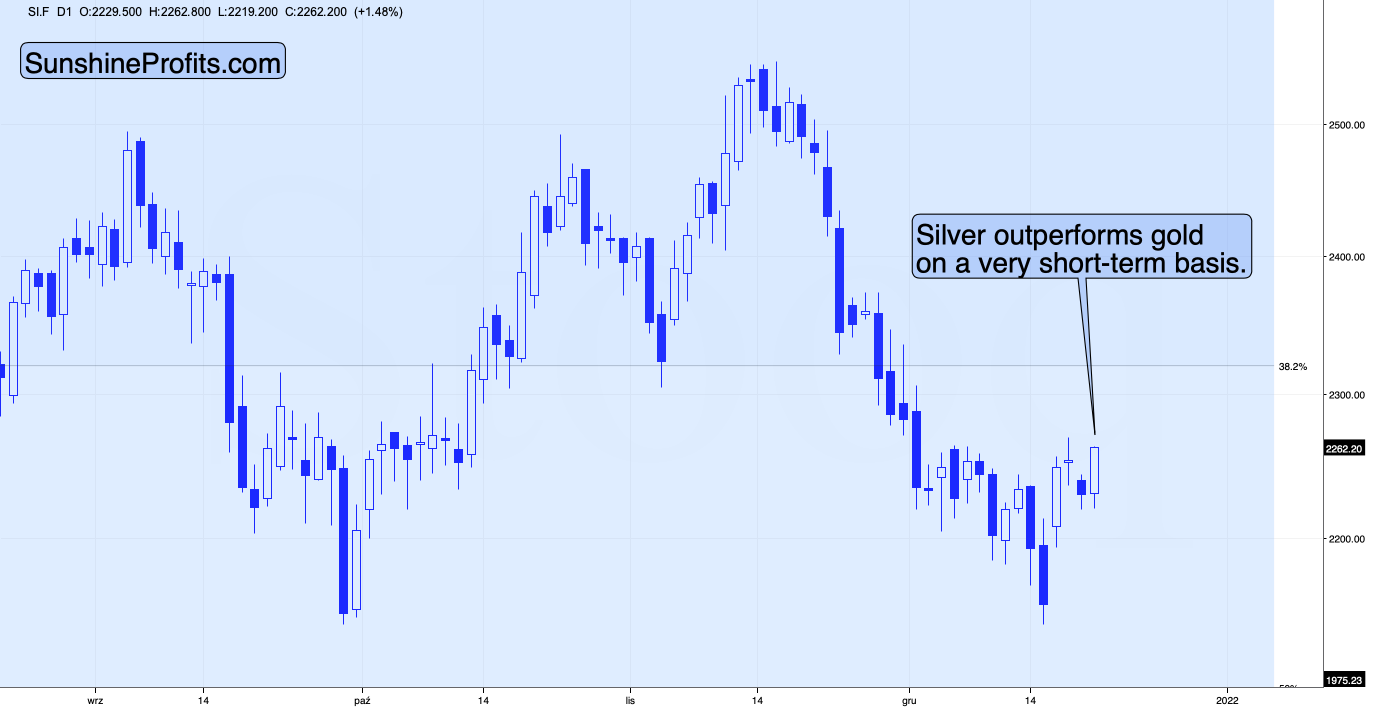
While gold moved higher by less than 0.2%, silver rallied by about 1.5% and is now trading very close to its previous monthly highs.
This is very interesting, because silver is showing strength and weakness at the same time. How is that possible – one might ask.
It’s the same as with trends or forecasts for silver. They can be bearish and bullish simultaneously, depending on the time frame that one focuses on. For example, I think that the very long-term outlook for silver is extremely bullish, but I also think that the medium-term trend is bearish. The short-term trend is also bearish, but the immediate-term trend is bullish. So, am I bullish or bearish on silver? Answering this without specifying the time frame is bound to create misunderstandings.
Getting back to silver’s relative performance, it’s been weak when taking into account the last couple of weeks – please note how little of the recent monthly decline silver has corrected compared to gold. Gold recently moved to its October highs, but silver topped a few dollars below its October high. What does it tell us? Silver is likely to fall hard, also compared to gold, probably in tune with the general stock market – similarly to what happened in 2008 and 2020. That’s the same kind of performance that we saw in the very early parts of the huge declines.
At the same time, silver is strong compared to gold on an immediate-term basis. This means that we’re likely at or close to a short-term top. Why? Because that’s what the precious metals market tends to do when it’s topping, and it’s one of the great gold trading tips to monitor the PM market for these situations. One could debate why this is really the case, and there are quite a few theories (the silver market is smaller, so more prone to sudden moves, etc.), but the point is that it simply works. Please note that some things – like the Pareto principle (a.k.a. the 20:80 rule) – can work and be very useful, even if it’s not clear why they work.
Consequently, it seems that the days of this short-term corrective upswing are either over or about to be over, and that the precious metals sector will return to its medium-term decline any day now.
Having said that, let’s take a look at the markets from a more fundamental angle.
More Gifts Than the U.S. Dollar Can Open
While a Santa Claus rally evaded stock market investors again on Dec. 20, the USD Index watched patiently as the drama unfolded. The greenback is still cooling off from its recent sprint higher, but the fundamentals underpinning the U.S. dollar continue to strengthen.
To explain, I highlighted the dove-hawk divergence between the ECB and the Fed on Dec. 20. After taking into account ECB President Christine Lagarde’s dovish pushback on Dec. 16, Barclays now expects more EUR/USD downside in 2022.
“Lagarde was very, very clear that it’s extremely unlikely the ECB will hike,” co-head of global FX sales Kristen Macleod told Bloomberg. “The ECB almost to some extent wants to intentionally show that contrast between what they are doing and what the Fed is doing (…). By and large, our clients are pretty comfortable selling the euro,” she added.
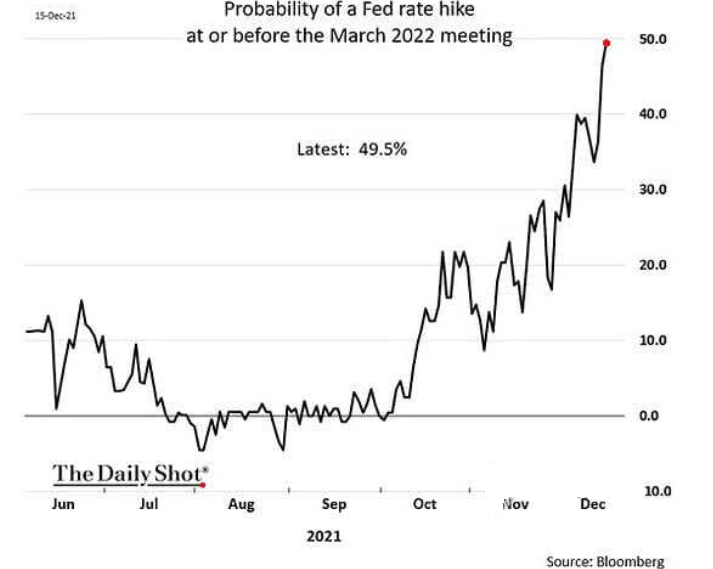
To that point, while Barclays doesn’t expect the ECB to raise interest rates until 2024, the market-implied probability of a Fed rate hike by March 2022 has risen to nearly 50%. For context, in November, investors expected the Fed to raise rates in September 2022. Later, the expectation was pulled forward to July, June, and then May, and now, March is creeping up. Thus, while ~50% may seem immaterial, it’s hawkish within the context of where we were in November.
Please see below:
Second, while I haven’t discussed the implications for some time, the Fed’s daily reverse repurchase agreements (repos) hit a new all-time high of $1.758 trillion on Dec. 20. With the liquidity drain reducing the supply of U.S. dollars in circulation, the development is fundamentally bullish for the U.S. dollar.
Please see below:
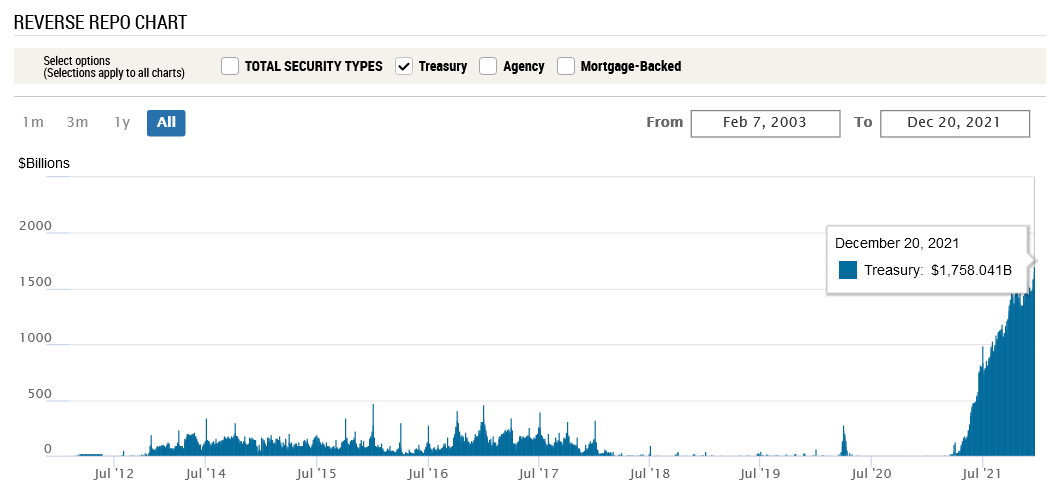 Source: New York Fed
To explain, a reverse repo occurs when an institution offloads cash to the Fed in exchange for a Treasury security (on an overnight or a short-term basis). With U.S. financial institutions still flooded with excess liquidity, they’re shipping cash to the Fed at an alarming rate.
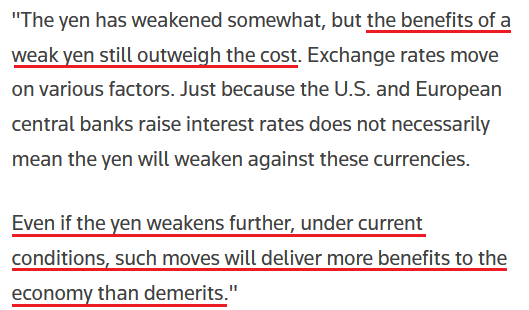
Third, the Bank of Japan (BoJ) released its monetary policy statement on Dec. 17. While the central bank scaled back a portion of its bond-buying program, BoJ Governor Haruhiko Kuroda said: “we're ready to take additional easing steps without hesitation. (…) Our monetary policy focus will not change.”
“Other central banks are normalizing monetary policies. But Japan's inflation is stuck around 0% and remains well below our 2% target. Achievement of our target will be some time off. That means it's important that we patiently maintain massive monetary stimulus. Doing so is necessary for Japan's economy and prices.”
Moreover, he added:
 Source: Reuters
Thus, it’s important to remember that the EUR/USD and the USD/JPY combine to account for more than 71% of the USD Index’s movement. With the ECB and the BoJ materially behind the Fed, there is little that fundamentally supports a stronger euro or yen.
To that point, while inflation may peak over the next few months, a deceleration to 6% or even 5% is nowhere near the Fed’s 2% annual target. As such, unless the Omicron variant decapitates the U.S. economy, the Fed’s hawkish disposition should remain on autopilot.
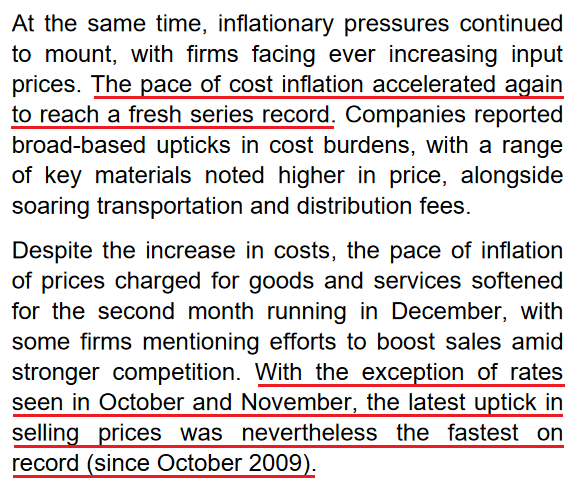
As evidence, IHS Markit released its U.S. Composite PMI on Dec. 16. An excerpt from the report read:
“US private sector businesses indicated a strong upturn in output at the end of 2021, despite the rate of expansion easing to the slowest for three months. (…) Supporting the upturn in activity was a quicker increase in new orders during December. The pace of expansion was the sharpest for five months, and largely driven by a faster rise in service sector new business. New order inflows to the manufacturing sector eased to the slowest since October 2020, however. Meanwhile, new export orders increased at the strongest pace since September.”
In addition:
“Private sector firms recorded the strongest degree of confidence regarding the 12-month outlook for output for just over a year in December. Optimism stemmed from hopes of further upticks in client demand and that the impact of the Omicron variant is less severe than prior virus waves.”
As a result, with IHS Markit’s survey data comprised of responses from more than 1,000 U.S. companies, their sentiment supports the Fed that’s ready to tighten monetary policy. With inflation still simmering and Fed Chairman Jerome Powell admitting on Dec. 15 that “one of the two big threats to getting back to maximum employment is actually high inflation,” rate hikes should commence in the coming months.
Please see below:
 Source: IHS Markit
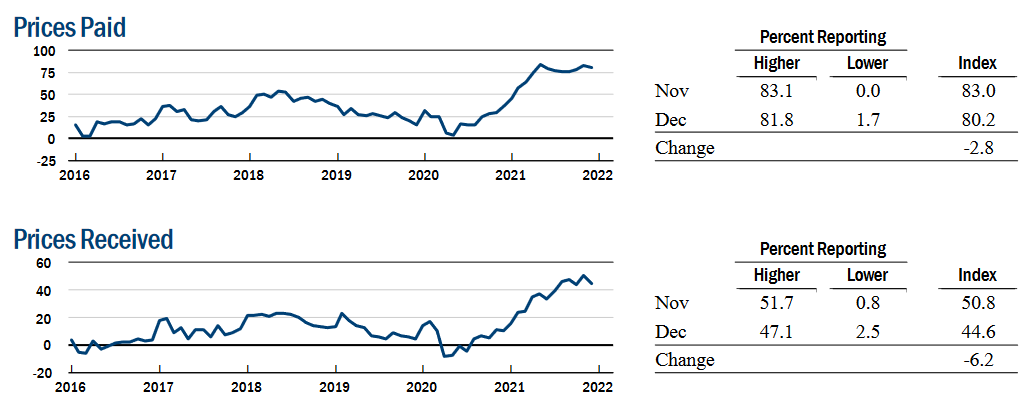
Also supporting the thesis, the New York Fed released its Empire State Manufacturing Index on Dec. 16. An excerpt from the report read:
“Business activity continued to grow strongly in New York State. (…) New orders and shipments posted substantial increases, and firms had more unfilled orders. Delivery times lengthened significantly, though less so than last month. Labor market indicators pointed to a solid increase in employment and a longer average workweek.”
And as for inflation:
“The prices paid index edged down three points to 80.2, and the prices received index fell six points to 44.6, signaling ongoing substantial increases in both input prices and selling prices, though at a slightly slower pace than in November.”
Please see below:
 Source: New York Fed
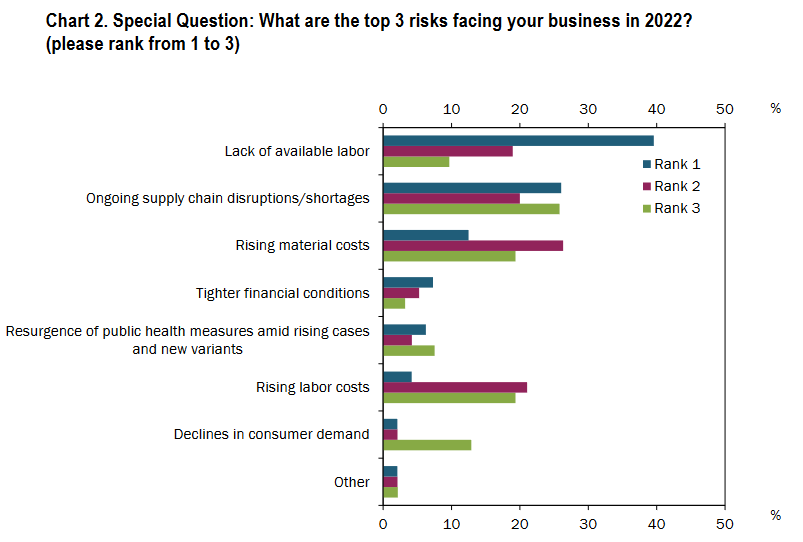
On top of that, the Kansas City Fed also released its Tenth District Manufacturing Activity survey on Dec. 16. The report revealed that “month-over-month indexes were positive in December, indicating expansion. The pace of growth increased for shipments, new orders, and inventories.”
More importantly, though, when asked to reveal their most pressing business concerns, respondents ranked “declines in consumer demand” as their second-lowest, while labor shortages (wage inflation), supply chain issues, and input inflation made the top three.
Please see below:
 Source: KC Fed
Speaking of inflationary pressures, the report revealed:
“Expectations for future raw materials prices rose, and a significant share of district manufacturing firms still expected finished goods prices to increase over the next six months (…)”
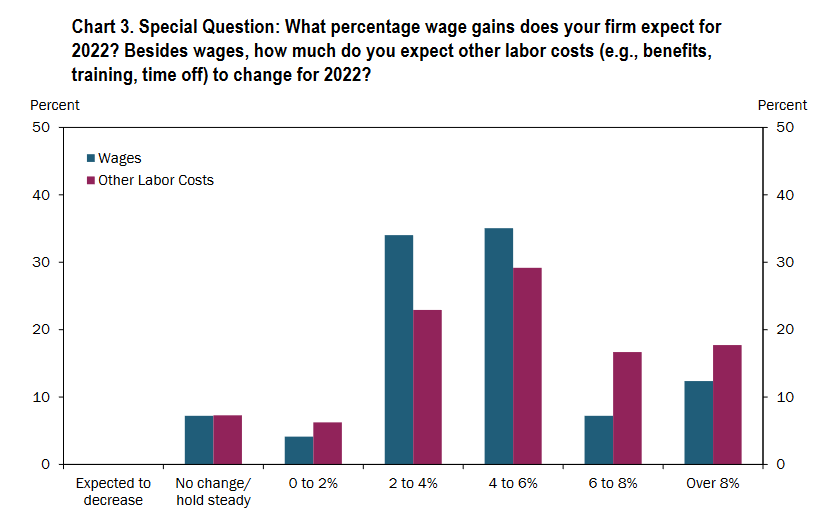
“For 2022, nearly 70% of firms are planning to increase wages between 2% to 6%, and no firms expected wages to decrease. Additionally, over 85% of firms expected a more than 2% increase in other labor costs such as benefits, training, and time off.”
Please see below:
 Source: KC Fed
Finally, the Philadelphia Fed also released its Manufacturing Business Outlook Survey on Dec. 16. While the results weren’t as optimistic as its predecessors – with the headline index declining from 39.4 in November to 15.4 in December – “surveyed firms remained generally optimistic about growth over the next six months.”
Furthermore, with the Philadelphia Fed’s prices paid index (the brown line below) only slightly below the 2008 highs, and its prices received index (the black line below) well above the 2008/2018 highs, inflation remains abundant in the state of Pennsylvania.
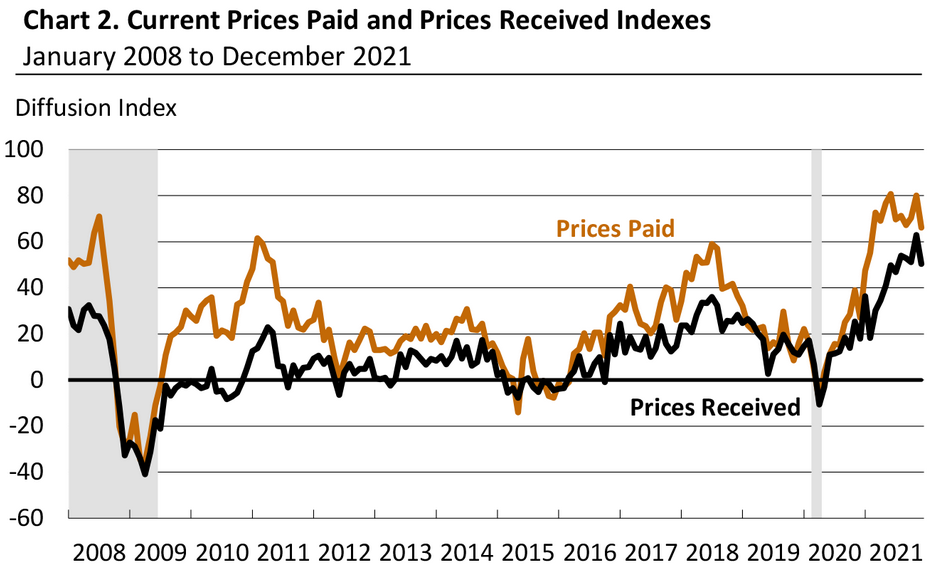 Source: Philadelphia Fed
The bottom line? With economic growth holding up despite the Omicron variant’s spread and inflation still extremely elevated, hawkish Fed rhetoric/policy should continue to uplift the U.S. dollar. Moreover, with the ECB stuck in neutral and the BoJ cheering on a weaker yen, the USD Index should shine bright over the medium term.
In addition, with growth forging ahead amid the Delta variant’s spread in July/August, the Omicron variant should have a similar economic impact. As a result, a stronger U.S. dollar and rising real interest rates remain the most likely outcome over the next few months.
In conclusion, the PMs were mixed on Dec. 20, and silver was the daily underperformer. However, with the U.S. 10-Year Treasury yield rising as the S&P 500 fell, Omicron’s impact on the U.S. yield curve may have already peaked. As a result, a resumption of interest rates’ uptrend will likely add to the PMs ills in 2022.
Overview of the Upcoming Part of the Decline
- It seems to me that while we the corrective upswing might still continue, it might not be significant in case of junior mining stocks. After the corrective upswing is over, I think that gold will decline once again taking silver and mining stocks lower as well.
- It seems that the first stop for gold will be close to its previous 2021 lows, slightly below $1,700. Then it will likely correct a bit, but it’s unclear if I want to exit or reverse the current short position based on that – it depends on the number and the nature of the bullish indications that we get at that time.
- After the above-mentioned correction, we’re likely to see a powerful slide, perhaps close to the 2020 low ($1,450 - $1,500).
- If we see a situation where miners slide in a meaningful and volatile way while silver doesn’t (it just declines moderately), I plan to – once again – switch from short positions in miners to short positions in silver. At this time, it’s too early to say at what price levels this could take place, and if we get this kind of opportunity at all – perhaps with gold close to $1,600.
- I plan to exit all remaining short positions once gold shows substantial strength relative to the USD Index while the latter is still rallying. This may be the case with gold close to $1,350 - $1,400. I expect silver to fall the hardest in the final part of the move. This moment (when gold performs very strongly against the rallying USD and miners are strong relative to gold after its substantial decline) is likely to be the best entry point for long-term investments, in my view. This can also happen with gold close to $1,375, but at the moment it’s too early to say with certainty. I expect the final bottom to take place near the end of the year, perhaps in mid-December. It is not set in stone that PMs have to bottom at that time. If not then, then early 2022 would become a likely time target.
- As a confirmation for the above, I will use the (upcoming or perhaps we have already seen it?) top in the general stock market as the starting point for the three-month countdown. The reason is that after the 1929 top, gold miners declined for about three months after the general stock market started to slide. We also saw some confirmations of this theory based on the analogy to 2008. All in all, the precious metals sector is likely to bottom about three months after the general stock market tops. The additional confirmation will come from the tapering schedule, as markets are likely to move on the rumor and reverse on the fact as they tend to do in general.
- The above is based on the information available today, and it might change in the following days/weeks.
You will find my general overview of the outlook for gold on the chart below:
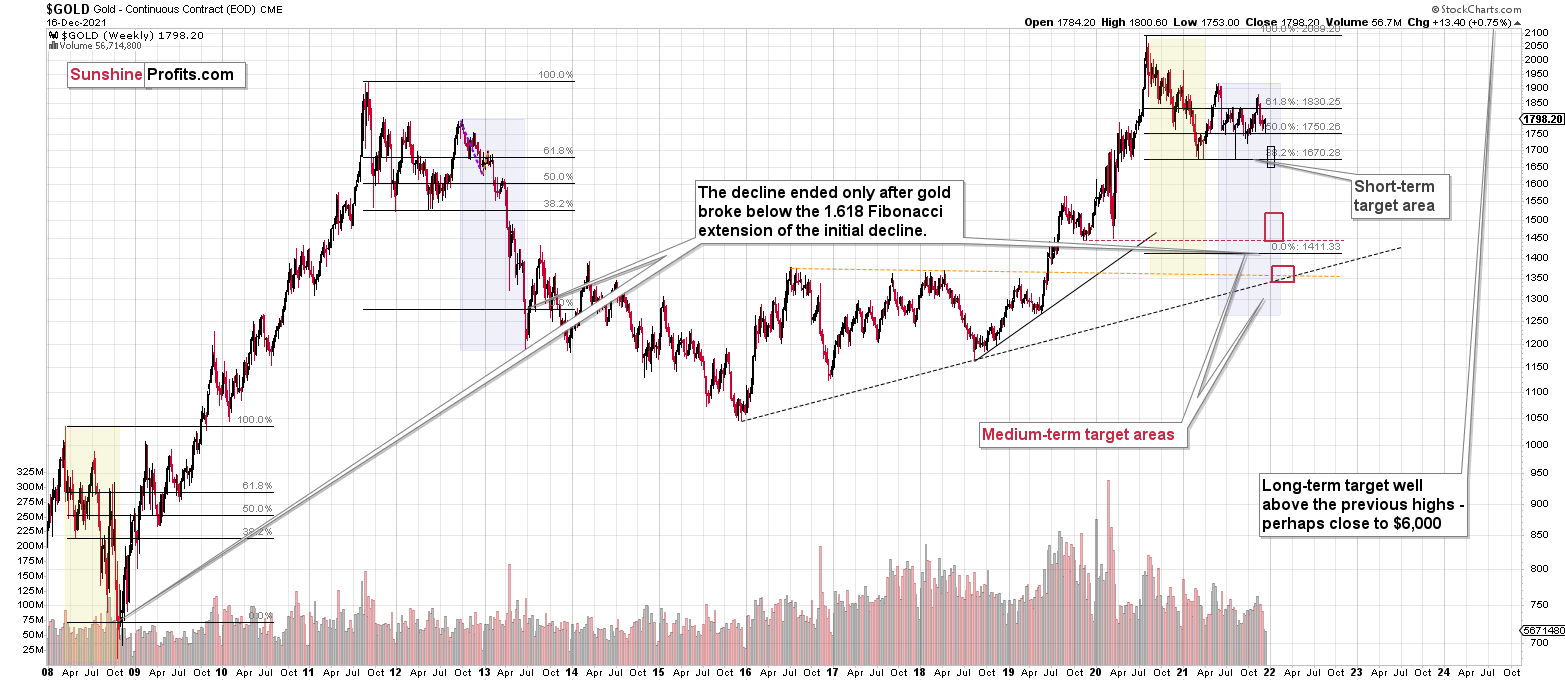
Please note that the above timing details are relatively broad and “for general overview only” – so that you know more or less what I think and how volatile I think the moves are likely to be – on an approximate basis. These time targets are not binding or clear enough for me to think that they should be used for purchasing options, warrants or similar instruments.
Letters to the Editor
Q: Could you please advise in a Trading Alert when to re-enter a short position in Gold and Silver? (Obviously in your opinion on the counter-trend rally).
A: It’s not investment advice, and neither is it a recommendation directed at anyone specifically. I cannot tell when anyone should do anything with their money. Still, I previously wrote that if I had a short position in gold, I would have exited it in order to re-enter it at higher prices. If I had done that, I would be re-entering this short position in gold now. If I was trading silver, I would be re-entering that short position now as well. If I didn’t have a short position in mining stocks now (in particular junior mining stocks), I would enter it today.
Q: [The question below was asked last week, I didn’t have the realistic opportunity to reply individually earlier, besides commenting on the market in a general manner in the regular analyses]
I don't need to instruct you to look at the charts, but… it seems when the RSI hits 30 (oversold conditions) markets move violently in the other direction. The one in October that dragged us into the teeth of a white knuckle 20%+ correction that we have only just recovered from was another time when the RSI hit 30. I don’t even want to calculate the losses and gains, but that was so severe we are ONLY JUST showing a few % in profit. I am wondering… can’t we box a bit smarter here? If your strategy is to stay invested (short) through thick & thin and not adopt a more agile strategy, then, let us know. This would allow some of us who are more trigger-happy to make shorter term decisions with SOME of our capital. Maybe send out an intra-day alert flagging this possibility? I’m no expert, but, looking at the charts, when the RSI touched 30 or below (it’s like the 3rd LIVE ELECTRIC RAIL) and it seems to be a trigger that heralds a sharp REVERSAL. Had we acted on this signal recently we would be far richer than buy’n’hold and have COMPLETELY avoided the shark-fin that started in October… from which we have only just recovered. I know this is with the benefit of hindsight, but… There seems to be a pattern here and if we can take evasive action to protect our capital, then, why are we not doing this? Just TODAY JDST is - 9.18%. That’s a staggering loss and one we could have avoided or profited from had we boxed a bit cleverer by acting on the RSI YESTERDAY. I have just looked at silver futures and the SAME pattern seems to be there too. If we were to have sold when the RSI touched 30 and short covered… we would have saved a fortune in losses and agony after the SHARK FIN that started later September… and yesterday. It’s the losses that kill people, as you know. Silver is + 4.60% TODAY. We seem to keep getting clues from the RSI… Why are we not acting on these signals?
Your thoughts?
A: In the case of any market, there are potential benefits and potential costs associated with focusing on short-term or very short-term signals. Until we actually see what happened on the market, they remain “potential”, and the results are obvious only after the moves take place and the dust settles.
The key benefit of acting on short-term signals is that you are less likely to miss short-term price moves. This means that you might exit a short position at lower prices and re-enter it at higher prices, thus increasing the rate of return. You might also benefit from a correct “bet” on the counter-trend rally.
The additional benefit is that, well, you’re doing something, and it’s more exciting. However, this is a benefit only at first sight, as the excitement (the dopamine high) might make one take even more actions than are justified, and they would end up overtrading and with an over-leveraged position. This is the key reason for huge losses in the case of individual investors.
What is the key cost, though? The risk of missing out on the huge medium-term move, when it happens.
During horizontal, back-and-forth trading, acting on short-term signals usually yields good results, but during big declines, it can be particularly costly.
Let’s take a look at a very realistic example – let’s consider what happened in GDX during the 2008 slide.
I placed horizontal, dashed lines, when the RSI moved below 30. I added hypothetical thoughts that might have run through a trader’s mind if he/she wanted – at the same time – not to miss the decline, and exit the short position with the RSI at 30 to re-enter at higher prices.
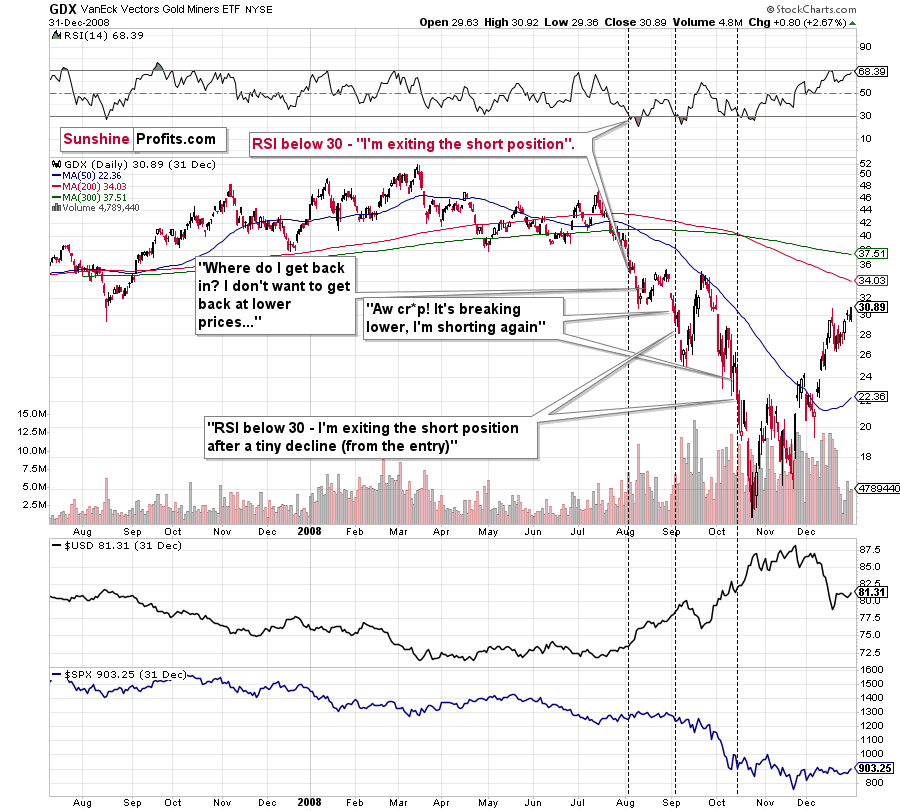
Please take some time to think about what you would have thought in the case of the above-mentioned price moves. Are my descriptions at least somewhat realistic? If they are, then combining the focus on the big, medium-term move along with applying a short-term trading approach, would make one miss practically the entire big decline. It would have been so much better to just patiently ride out the corrective upswings.
After the RSI first moved below 30, the GDX ETF then didn’t move back above the supposed exit price for the entire decline. This means exiting the short position at about $36 and missing the slide below $20.
Imagine how tough, psychologically, it would have been to accept the fact that you “knew” that this decline was coming, but still managed to miss it almost entirely. Now, please compare it to how “little” it means to just wait out a short-term upswing compared to that.
…Exactly.
As long as one thinks that the big, medium-term decline is underway or about to follow, it is – in my opinion – a better approach to focus on this move and not on trading in and out at every chance. IF the market provides multiple buy signals, then it might be a good idea to trade in and out, but this is particularly risky and might not result in good outcomes at all.
Sometimes much more money can be made through strategic inaction than through action, and it seems to me that we are now in such a period. If I see a good combination of factors pointing to a great chance of seeing a short-term rally, I’ll write about that. My threshold for this will be relatively high, as my priority is on the big move.
Summary
Summing up, it seems to me that while we the corrective upswing might still continue, it might not be significant in case of junior mining stocks. After the corrective upswing is over, I think that gold will decline once again taking silver and mining stocks lower as well.
If the new Covid-19 variant makes the vaccine rather useless, we might be in for very wild price moves in most markets. In the case of the precious metals sector, the initial move should be to the downside, but at the same time, it makes the long-term outlook even more bullish.
From the medium-term point of view, the key two long-term factors remain the analogy to 2013 in gold and the broad head and shoulders pattern in the HUI Index. They both suggest much lower prices ahead.
It seems that our profits from the short positions are going to become truly epic in the following months.
After the sell-off (that takes gold to about $1,350 - $1,500), I expect the precious metals to rally significantly. The final part of the decline might take as little as 1-5 weeks, so it's important to stay alert to any changes.
Most importantly, please stay healthy and safe. We made a lot of money last March and this March, and it seems that we’re about to make much more on the upcoming decline, but you have to be healthy to enjoy the results.
As always, we'll keep you - our subscribers - informed.
YEAR-END PUBLICATION SCHEDULE:
The analyses will continue to be published normally until Thursday, December 23, 2021.
There will be no regular Gold & Silver Trading Alerts posted on Friday, Dec. 24, 2021 (the markets are closed in the U.S., so probably nothing important will happen on that day, anyway), and there will be no regular Gold & Silver Trading Alerts posted between Monday, Dec. 27, 2021 and Friday, Dec. 31, 2021.
The regular analyses will be back on Monday, Jan. 3, 2022, and the first flagship Gold & Silver Trading Alert will be posted on Tuesday, Jan. 4, 2022.
In other words, we are taking a break from the regular publication of Gold & Silver Trading Alerts between Christmas Eve and the end of the year.
It’s been a volatile year, and it seems that next year will be even more so. Consequently, it seems to be a good idea to take this opportunity to recharge batteries. The nature of the service that we’re providing is extremely person-specific, as I (PR here) can’t just re-assign managing the trade that I entered based on my own analysis, my outlook, and my opinions, to someone else. I also can’t ignore the fact that in order to provide you with the highest quality service, periodic breaks from the regular schedule are necessary. I can’t even remember when I took a weekly break from the regular publication schedule. Probably a few years ago.
Still, the emphasis is on “regular”, since just because there will be no regular, daily analyses posted, it doesn’t mean that I’m going to stop monitoring the situation on the markets entirely. I think that the precious metals market is on the verge of a major move lower, and I’m keeping my trading position (which is – of course – aligned with what I’m describing in my Gold & Silver Trading Alerts) open. I will keep monitoring the markets, and if anything changes, I will send you a quick note, anyway. Consequently, despite the break from the regular schedule, I will keep you informed and up-to-date, to the extent that the market situation warrants it.
Thank you for understanding.
To summarize:
Trading capital (supplementary part of the portfolio; our opinion): Full speculative short positions (300% of the full position) in junior mining stocks are justified from the risk to reward point of view with the following binding exit profit-take price levels:
Mining stocks (price levels for the GDXJ ETF): binding profit-take exit price: $35.73; stop-loss: none (the volatility is too big to justify a stop-loss order in case of this particular trade)
Alternatively, if one seeks leverage, we’re providing the binding profit-take levels for the JDST (2x leveraged) and GDXD (3x leveraged – which is not suggested for most traders/investors due to the significant leverage). The binding profit-take level for the JDST: $16.18; stop-loss for the JDST: none (the volatility is too big to justify a SL order in case of this particular trade); binding profit-take level for the GDXD: $32.08; stop-loss for the GDXD: none (the volatility is too big to justify a SL order in case of this particular trade).
For-your-information targets (our opinion; we continue to think that mining stocks are the preferred way of taking advantage of the upcoming price move, but if for whatever reason one wants / has to use silver or gold for this trade, we are providing the details anyway.):
Silver futures downside profit-take exit price: $19.12
SLV profit-take exit price: $17.72
ZSL profit-take exit price: $41.38
Gold futures downside profit-take exit price: $1,683
HGD.TO – alternative (Canadian) inverse 2x leveraged gold stocks ETF – the upside profit-take exit price: $12.48
HZD.TO – alternative (Canadian) inverse 2x leveraged silver ETF – the upside profit-take exit price: $30.48
Long-term capital (core part of the portfolio; our opinion): No positions (in other words: cash
Insurance capital (core part of the portfolio; our opinion): Full position
Whether you already subscribed or not, we encourage you to find out how to make the most of our alerts and read our replies to the most common alert-and-gold-trading-related-questions.
Please note that we describe the situation for the day that the alert is posted in the trading section. In other words, if we are writing about a speculative position, it means that it is up-to-date on the day it was posted. We are also featuring the initial target prices to decide whether keeping a position on a given day is in tune with your approach (some moves are too small for medium-term traders, and some might appear too big for day-traders).
Additionally, you might want to read why our stop-loss orders are usually relatively far from the current price.
Please note that a full position doesn't mean using all of the capital for a given trade. You will find details on our thoughts on gold portfolio structuring in the Key Insights section on our website.
As a reminder - "initial target price" means exactly that - an "initial" one. It's not a price level at which we suggest closing positions. If this becomes the case (like it did in the previous trade), we will refer to these levels as levels of exit orders (exactly as we've done previously). Stop-loss levels, however, are naturally not "initial", but something that, in our opinion, might be entered as an order.
Since it is impossible to synchronize target prices and stop-loss levels for all the ETFs and ETNs with the main markets that we provide these levels for (gold, silver and mining stocks - the GDX ETF), the stop-loss levels and target prices for other ETNs and ETF (among other: UGL, GLL, AGQ, ZSL, NUGT, DUST, JNUG, JDST) are provided as supplementary, and not as "final". This means that if a stop-loss or a target level is reached for any of the "additional instruments" (GLL for instance), but not for the "main instrument" (gold in this case), we will view positions in both gold and GLL as still open and the stop-loss for GLL would have to be moved lower. On the other hand, if gold moves to a stop-loss level but GLL doesn't, then we will view both positions (in gold and GLL) as closed. In other words, since it's not possible to be 100% certain that each related instrument moves to a given level when the underlying instrument does, we can't provide levels that would be binding. The levels that we do provide are our best estimate of the levels that will correspond to the levels in the underlying assets, but it will be the underlying assets that one will need to focus on regarding the signs pointing to closing a given position or keeping it open. We might adjust the levels in the "additional instruments" without adjusting the levels in the "main instruments", which will simply mean that we have improved our estimation of these levels, not that we changed our outlook on the markets. We are already working on a tool that would update these levels daily for the most popular ETFs, ETNs and individual mining stocks.
Our preferred ways to invest in and to trade gold along with the reasoning can be found in the how to buy gold section. Furthermore, our preferred ETFs and ETNs can be found in our Gold & Silver ETF Ranking.
As a reminder, Gold & Silver Trading Alerts are posted before or on each trading day (we usually post them before the opening bell, but we don't promise doing that each day). If there's anything urgent, we will send you an additional small alert before posting the main one.
Thank you.
Przemyslaw Radomski, CFA
Founder, Editor-in-chief

