

Briefly: in our opinion, full (300% of the regular position size) speculative short positions in junior mining stocks are justified from the risk/reward point of view at the moment of publishing this Alert.
Very little changed on the markets yesterday, which means that my yesterday’s analysis remains up-to-date. There are a few technical details that I’d like to additionally mention today.
The first detail comes from the silver market.
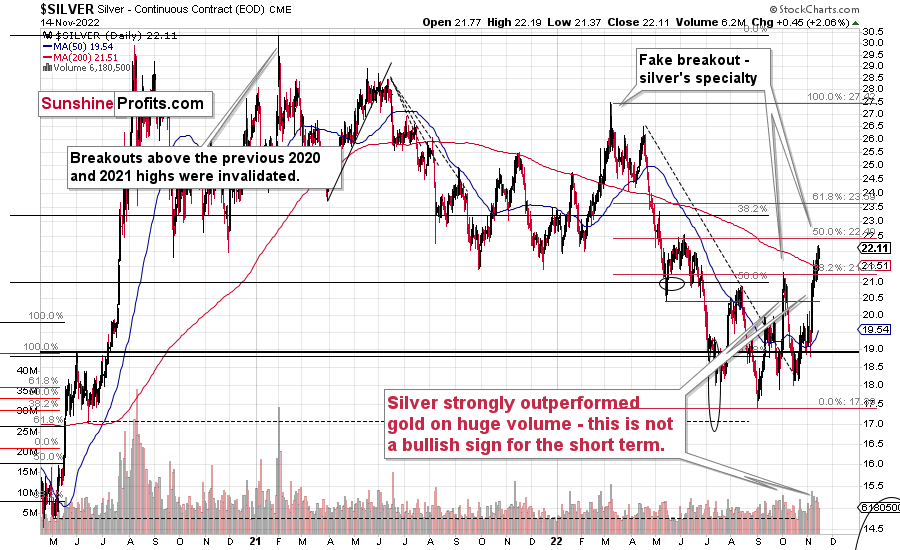
The white metal has been making higher highs and higher lows in the past few months, which might seem bullish at first sight.
However, higher lows and higher highs are only a short-term phenomenon!
From a broader point of view, what we saw recently is still a flag pattern, which is a continuation pattern.
Silver corrected less than a half of its preceding decline (please note the red Fibonacci retracements), and while it’s been stronger than gold and mining stocks on a relative basis recently, it doesn’t mean that the downtrend has ended.
In fact, silver’s strength can often be viewed as a bearish indication because it tends to catch up and outperform gold in the final parts of a given upswing. This is particularly visible in the case of medium-term upswings.
Ok, so the medium-term trend is bearish, but what about the near term?
Truth be told, it wouldn’t surprise me to see silver move slightly higher before declining profoundly - with vengeance. The reason is that silver is very close to its June 2022 high as well as its 50% Fibonacci retracement.
The silver price broke above the other resistance levels, so it’s likely to move higher. Then again, the fact that two resistance levels coincide at a similar price level (~$22.5) means that this resistance is particularly strong.
Consequently, it seems that we’re in a “pennies to the upside, dollars to the downside” situation in silver.
Let’s keep in mind that since silver tends to outperform the rest of the precious metals sector in the final parts of a given upswing, the above-mentioned small rally in silver might not translate into higher gold or mining stock prices.
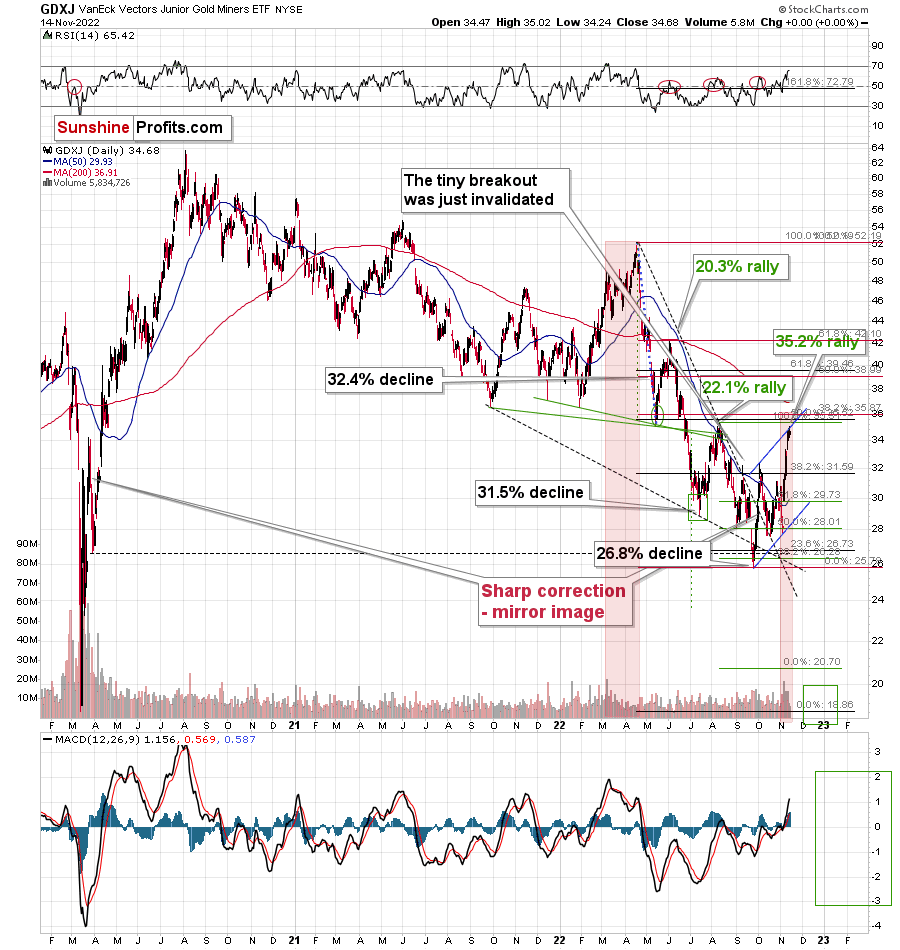
In fact, while silver moved higher by about 2% yesterday, the junior mining stocks were flat.
As I mentioned yesterday, there are additional resistance levels just above the current price, but since the GDXJ already reached one of them, I wouldn’t say that a move even higher here is likely. Conversely, the upside potential appears even more limited here than it is in the case of silver.
What could be the potential trigger for another small move higher in silver?
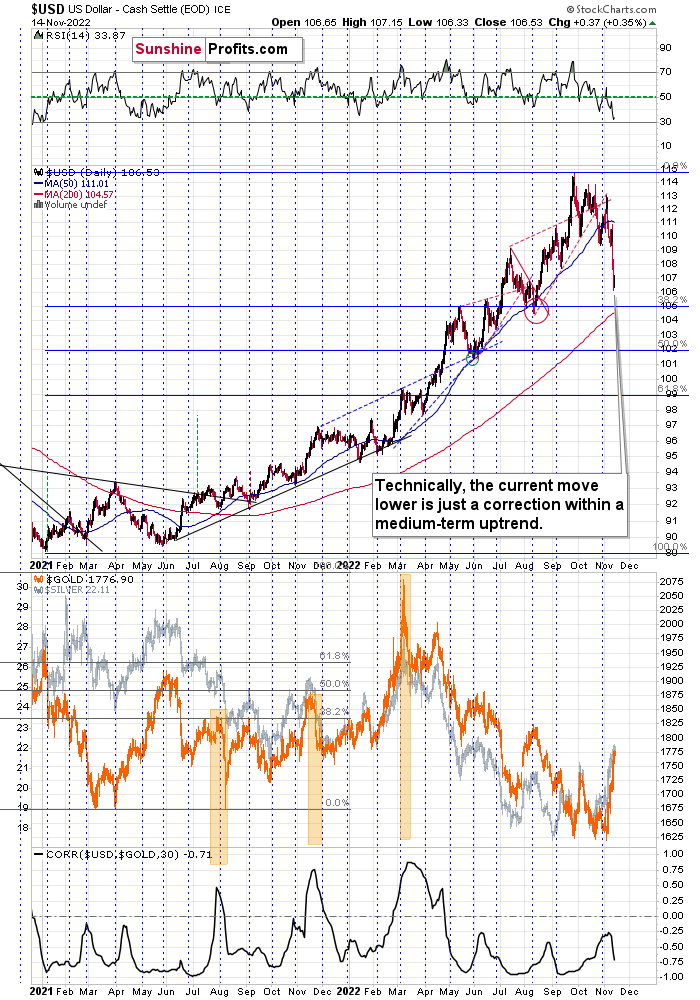
For example, the USD Index could decline to its strong support level at the 38.2% Fibonacci retracement and the August 2022 low as well as the May 2022 high. Such a move would likely imply the RSI at about 30, which would be a crystal-clear signal for many traders that the bottom is in.
To clarify, if that happened, the USD Index would be as oversold from a short-term point of view, as it was at its 2021 bottom – when it was trading at about 90.
The trigger could also come from the declining stock market.
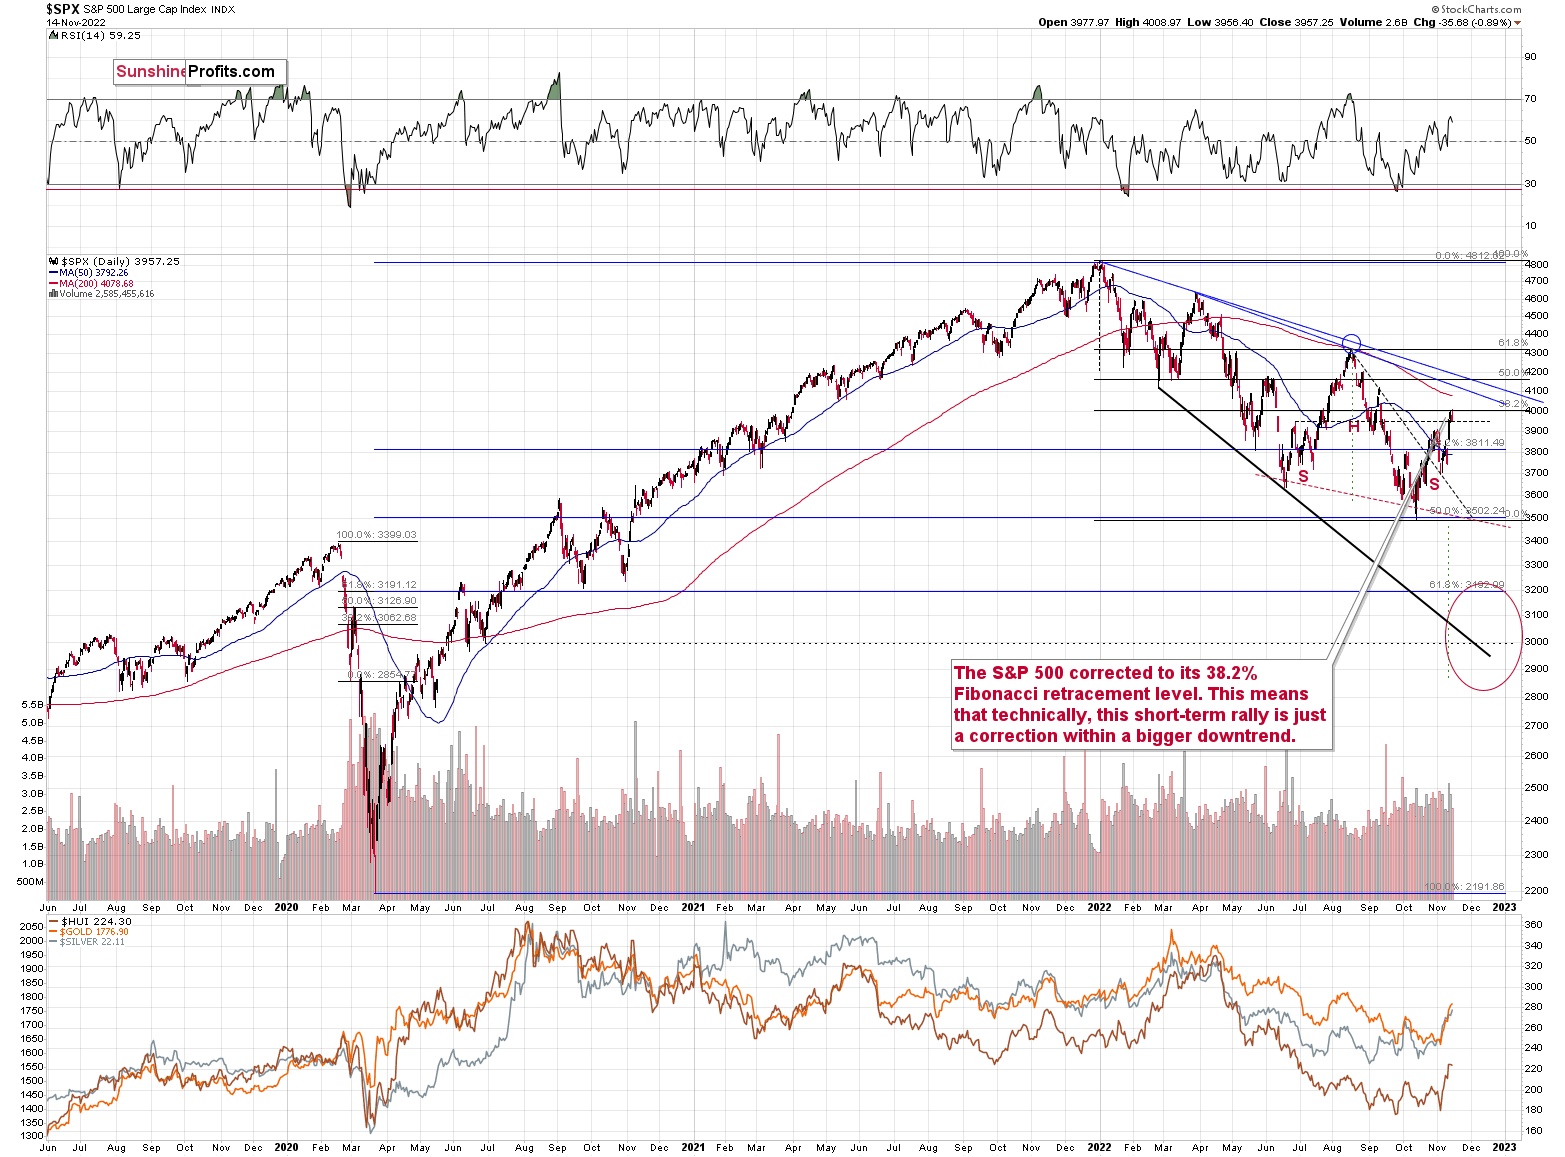
As I wrote yesterday, the S&P 500 moved to its 38.2% Fibonacci retracement, which serves as a strong resistance level.
Indeed, stocks declined yesterday after a tiny attempt to move higher. In other words, the S&P 500 failed to rally above the 38.2% retracement, which increases the odds that the top is already in. At the moment of writing these words, the S&P 500 futures are trading slightly below 4,000, which means that there was no breakout above the above-mentioned retracement.
A decline from here would be bearish for gold, silver, and mining stocks, but particularly for the last two due to their higher correlations with stocks. The link with crude oil is less certain, but the implications are more likely to be bearish than bullish, in my view.
All in all, it seems that the corrective upswing in the precious metals sector is over or about to be over and that the truly powerful downtrend will resume any day now.
Having said that, let’s take a look at the market from a more fundamental point of view.
Storytellers
With the S&P 500 selling off into the close on Nov. 14, the general stock market took a breather from its recent sprint higher. Moreover, with gold, silver, and mining stocks ending the day mixed, investors are waiting for the next fundamental catalyst.
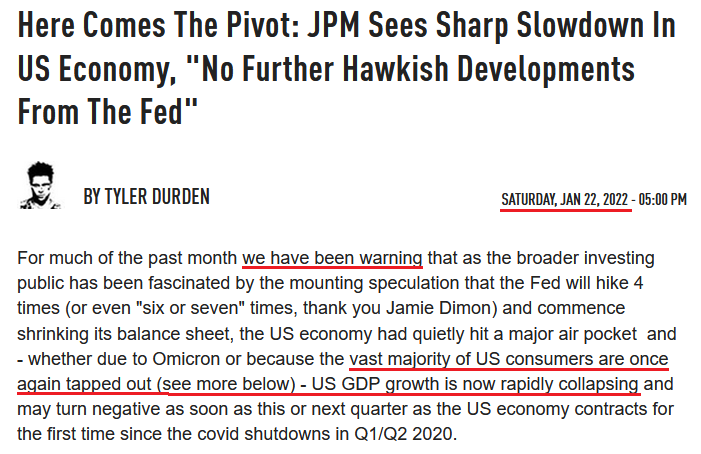
However, with misguided narratives guiding them in the wrong direction, the rhetoric from ZeroHedge continues to lead the crowd down an unprofitable road. For example, the latest musing has the Fed increasing its inflation target to 3%, and the article cites the familiar arguments that the Fed can’t tolerate a recession or high employment, so it will let inflation rage.
Yet, while each upload may seem like a fresh take on the fundamentals, please remember that ZeroHedge is a broken clock when it comes to pivot predictions. To explain, I wrote on Oct. 27:
 Source: ZeroHedge
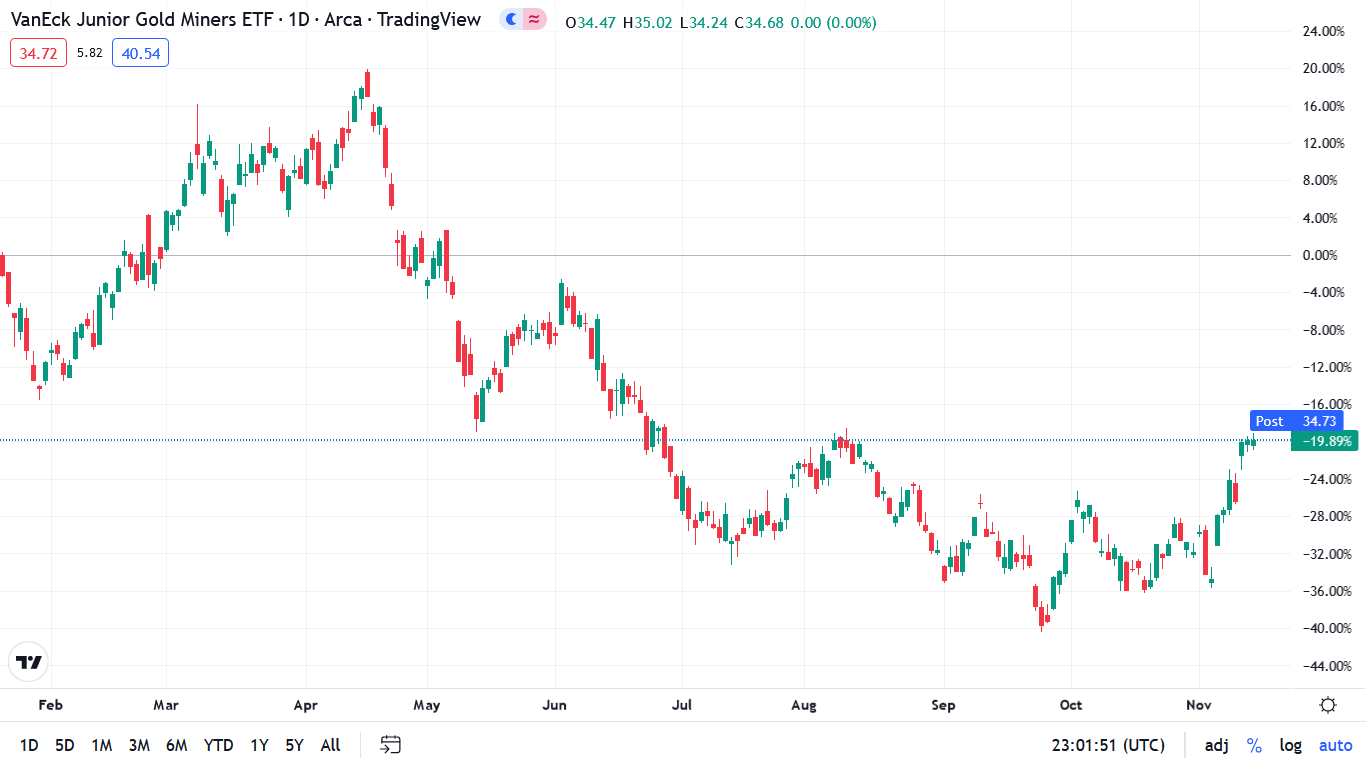
So while ZeroHedge has amplified the false pivot narrative for much of 2022, imagine if you had bought the PMs in January. You would have suffered major losses.
While the site proclaimed that “U.S. GDP growth is now rapidly collapsing” in January, it’s been several months and the Atlanta Fed raised its Q3 real GDP estimate to 3.1% on Oct. 26. Thus, it’s prudent to pay less attention to narratives and more attention to the data
To that point, Q3 real GDP came in at 2.6%, and the Atlanta Fed has a 4% prediction for Q4 (made on Nov. 9). Consequently, if you positioned for ZeroHedge’s pivot warning and bought the GDXJ ETF in late January, you would have suffered substantial losses, even considering the recent rally.
Please see below:
Overall, the moral of the story is to scrutinize where the information comes from; and while ZeroHedge has useful data, its analysis is biased. Therefore, if you take its conclusions at face value, you may be disappointed with the results.
In addition, you can’t reverse engineer a stable economy. With inflation still unanchored, a Fed that listens to ZeroHedge will only make a bad situation worse. As a result, while investors assume that a cautious central bank is bullish, they’ll realize in hindsight that it creates more problems than it solves.
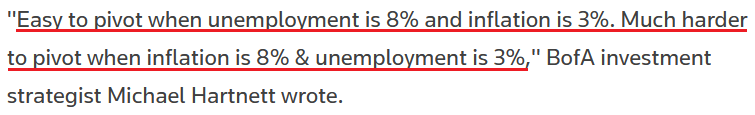
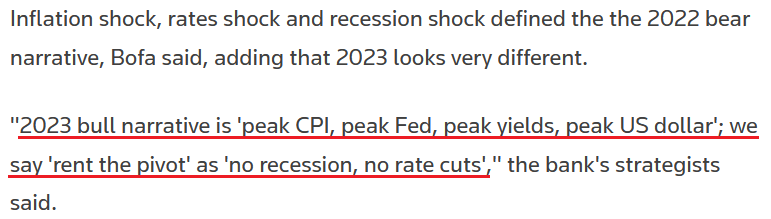
Furthermore, please remember that false optimism is nothing new to those that understand the fundamentals. For example, Michael Hartnett, Chief Investment Strategist at Bank of America, told clients on Nov. 11:
“’Inflation shock’ is over, but 'inflation stick' of briskly rising services and wage inflation is here to stay; inflation will come down but to remain above range past 20 years.”
As such, while I’ve warned repeatedly that the Fed’s inflation fight will be one of attrition, Hartnett still sees the S&P 500 hitting ~3,000 in 2023. That means the investors expecting a sustainable pivot and low inflation are living in la-la land.
Please see below:
 Source: Reuters
Also, while ZeroHedge insinuates that a crashing U.S. economy will let the Fed pivot and push asset prices to new highs, the reality is that resilient growth and employment coupled with high inflation are bullish for the U.S. federal funds rate (FFR); and unless all three collapse, the idea of rate cuts is ridiculous.
Please see below:
 Source: Reuters
Likewise, please remember that investors are often the most bearish at the bottom and the most bullish at the top. Thus, while the PMs and the S&P 500 have enjoyed material rallies, their ascents make it more challenging to sustain the optimism.
Please see below:
 Source: CNN
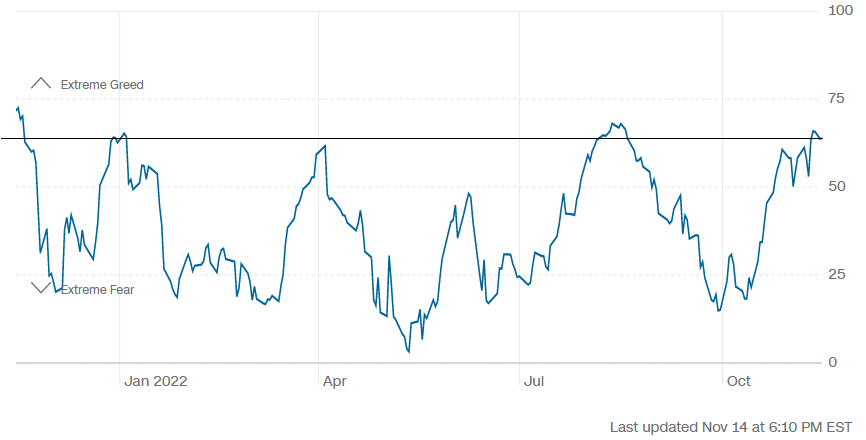
To explain, the blue line above tracks CNN’s Fear & Greed Index. For context, the metric is a contrarian indicator, and high values are considered bearish. If you analyze the right side of the chart, you can see that the metric is at one of its highest levels in 2022.
Moreover, before the S&P 500’s decline on Nov. 14, it was only two points below its 2022 high; and while extreme fear was present in early October, sentiment has shifted and greed reigns.
However, while seasonality is bullish for the S&P 500, the fundamentals are bearish, and the crowd should find it difficult to sustain higher prices without the fundamental support. So, while sentiment can keep gold, silver, mining stocks, and the S&P 500 uplifted in the short term, the peaks and troughs in the blue line above highlight how quickly things can change.
As further evidence, while CNN’s Fear & Greed Index signals greed, though, it’s still below extreme greed, the materials sector is on another level.
Please see below:
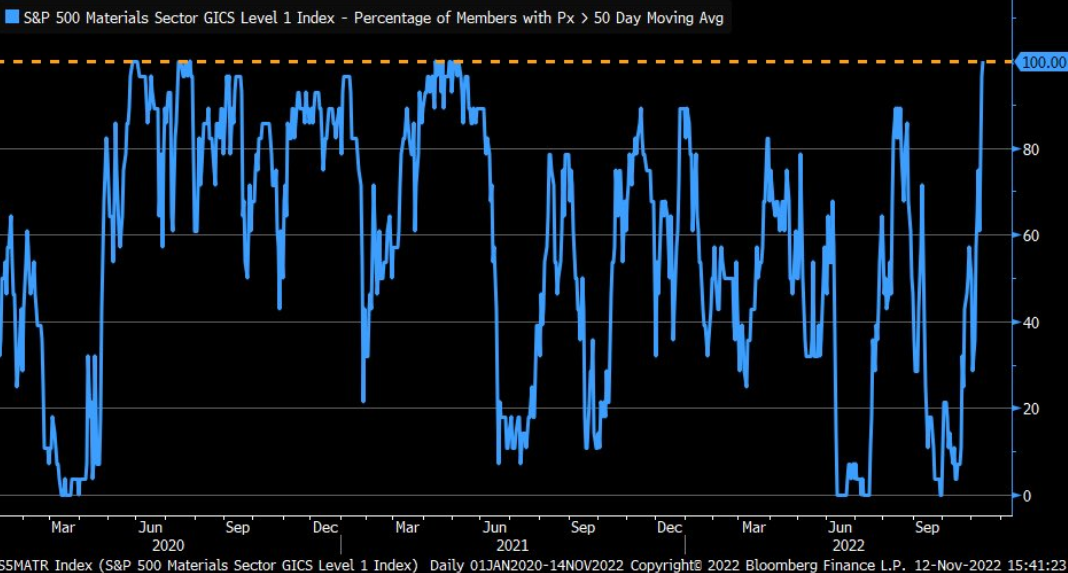
To explain, the blue line above tracks the percentage of companies in the materials sector trading above their 50-day moving average. For context, metals and mining make up roughly 14% of the sector. If you analyze the right side of the chart, you can see that the figure stands at 100%, which is a sizable shift from the 0% present in late September.
As a result, the data highlights why we’re likely much closer to the top than the bottom; and notice how abnormally high and low readings are nearly impossible to sustain? This is because periods of too much pessimism and optimism often revert to the average when investors take a thoughtful look at the fundamentals.
Therefore, since the metric can’t go any higher, a material reversal should result in substantial declines for gold, silver, and mining stocks over the medium term.
Reality Checks
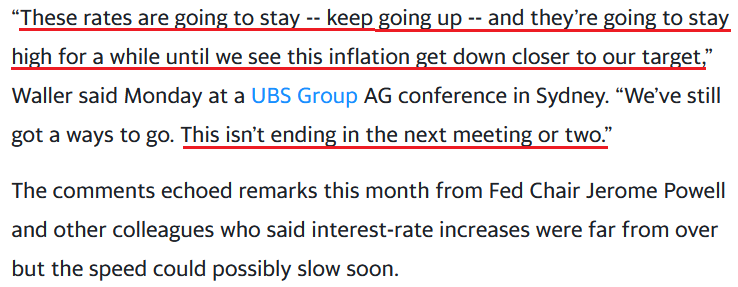
While investors are known to buy hope and sell reality, Fed Governor Christopher Waller said on Nov. 13:
“We’ve got to see [rate hikes] continue because the worst thing you can do is stop [tightening financial conditions] and then [inflation] takes off again, and you’re caught (…). This is exactly the situation we had gotten into in July.”
He added:
“I can’t speak for [Fed Chairman Jerome Powell], but as I watched the press conference, that was the signal: to quit paying attention to the pace and start paying attention to where the end point [FFR] is going to be. Until we get inflation down, that endpoint is still a ways out there.”
As such, while the crowd thinks they can create their own reality, the fundamentals guide the Fed, and the Fed has a substantial inflation problem.
Please see below:
 Source: Bloomberg
Also, Fed Vice Chair Lael Brainard said on Nov. 14:
“I think it will probably be appropriate soon to move to a slower pace of increases, but I think what’s really important to emphasize is (...) we have additional work to do.”
Thus, while Brainard is known for her dovish disposition, a data-dependent approach is no different than officials’ stance in 2021. In a nutshell: if inflation recedes, they’ll stop hiking. If not, they won’t. However, with inflation still materially underestimated, the Fed’s conundrum is far from priced in.
For example, Brainard added:
“We have raised rates very rapidly (...) and we’ve been reducing the balance sheet, and you can see that in financial conditions, you can see that in inflation expectations, which are quite well-anchored.”
Yet, I noted the re-acceleration of inflation expectations earlier on Nov. 14. I wrote:
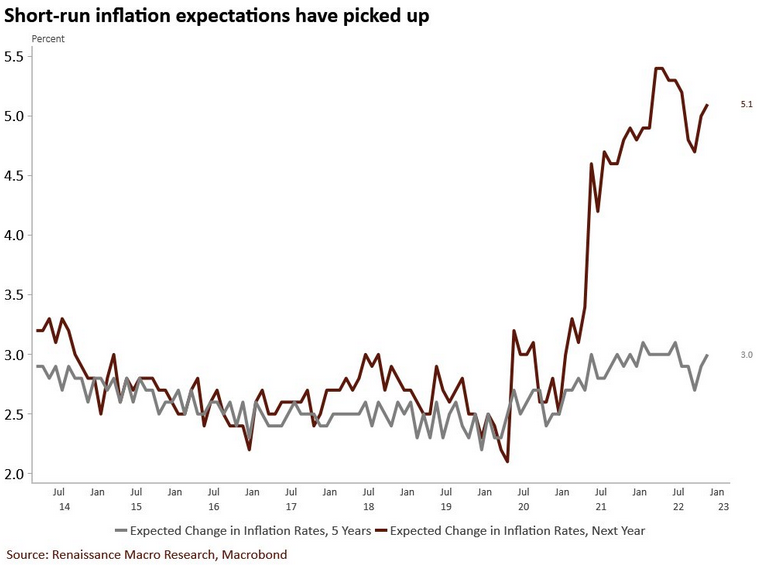
To explain, the brown line above tracks Americans’ 12-month inflation expectation, while the gray line above tracks their five-year forecast [University of Michigan data]. If you analyze the right side of the chart, you can see that both metrics have risen recently, which highlights the stickiness of inflation psychology. So, while the crowd assumes the war is over, the reality is that the Fed has made little progress in solving the problem.
Furthermore, Fed Chairman Jerome Powell said during his press conference on Nov. 2:
 Source: U.S. Fed
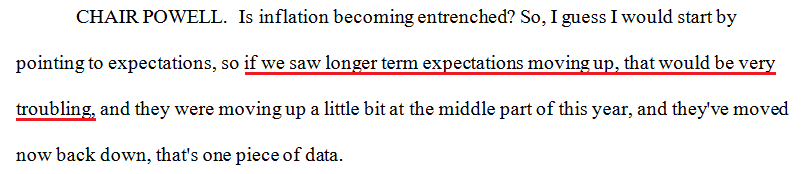
Well, the New York Fed released its Survey of Consumer Expectations (SCE) on Nov. 14, and the jump was similar. The report stated:
“Median one-and-three-year-ahead inflation expectations increased to 5.9 percent and 3.1 percent from 5.4 percent and 2.9 percent, respectively. The median five-year-ahead inflation expectations, meanwhile, rose by 0.2 percentage point to 2.4 percent.”
Please see below:
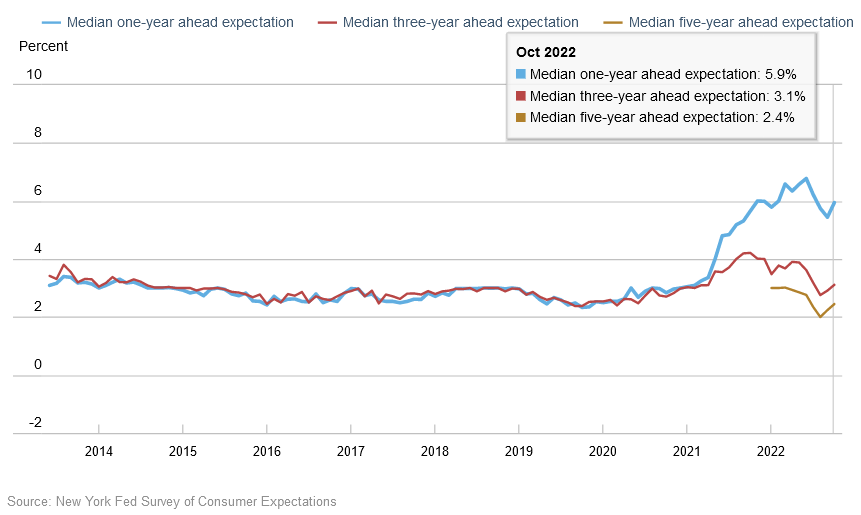
More importantly:
“Household income growth expectations touched a series high of 4.3 percent, up from 3.5 percent in September.”
Please see below:
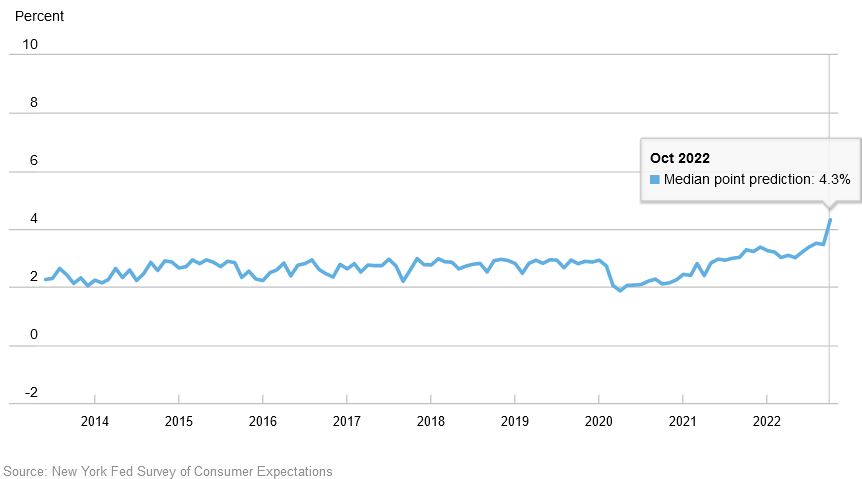
In addition:
“Median household spending growth expectations increased to 7.0% from 6.0%.”
Please see below:
Thus, with Americans’ income, spending, and inflation expectations rising in October, does this seem like an environment that supports a dovish pivot? Moreover, the latter two metrics are well above their pre-pandemic highs, and I warned repeatedly that record-high checkable deposits and robust wage inflation have Americans flush with cash. Therefore, their ability and willingness to spend should keep the Consumer Price Index (CPI) elevated for much longer than the consensus expects.
The Bottom Line
While the crowd and ZeroHedge jump from one narrative to the next, our fundamental message has been consistent: reducing inflation is extremely difficult, and history shows that every inflation fight since 1954 has ended with a recession. Plus, the periods where the Fed turned dovish amid high inflation (“stop-go” monetary policy) resulted in even worse outcomes for the U.S. economy and the S&P 500. So, while the consensus assumes the Fed can achieve the near impossible, history and the current data suggest otherwise.
In conclusion, the PMs were mixed on Nov. 14, as the GDX ETF ended the day in the red. However, the USD Index and the U.S. 10-Year real yield increased, and more upside should materialize in the months ahead. As a result, we believe gold, silver, and mining stocks have not seen their medium-term lows.
Overview of the Upcoming Part of the Decline
- It seems to me that the corrective upswing is over (or about to be over) and that the next big move lower is already underway (or that it’s about to start).
- If we see a situation where miners slide in a meaningful and volatile way while silver doesn’t (it just declines moderately), I plan to – once again – switch from short positions in miners to short positions in silver. At this time, it’s too early to say at what price levels this could take place and if we get this kind of opportunity at all – perhaps with gold prices close to $1,500 - $1,550.
- I plan to switch from the short positions in junior mining stocks or silver (whichever I’ll have at that moment) to long positions in junior mining stocks when gold / mining stocks move to their 2020 lows (approximately). While I’m probably not going to write about it at this stage yet, this is when some investors might consider getting back in with their long-term investing capital (or perhaps 1/3 or 1/2 thereof).
- I plan to return to short positions in junior mining stocks after a rebound – and the rebound could take gold from about $1,450 to about $1,550, and it could take the GDXJ from about $20 to about $24. In other words, I’m currently planning to go long when GDXJ is close to $20 (which might take place when gold is close to $1,450), and I’m planning to exit this long position and re-enter the short position once we see a corrective rally to $24 in the GDXJ (which might take place when gold is close to $1,550).
- I plan to exit all remaining short positions once gold shows substantial strength relative to the USD Index while the latter is still rallying. This may be the case with gold prices close to $1,400 and GDXJ close to $15 . This moment (when gold performs very strongly against the rallying USD and miners are strong relative to gold after its substantial decline) is likely to be the best entry point for long-term investments, in my view. This can also happen with gold close to $1,400, but at the moment it’s too early to say with certainty.
- The above is based on the information available today, and it might change in the following days/weeks.
You will find my general overview of the outlook for gold on the chart below:
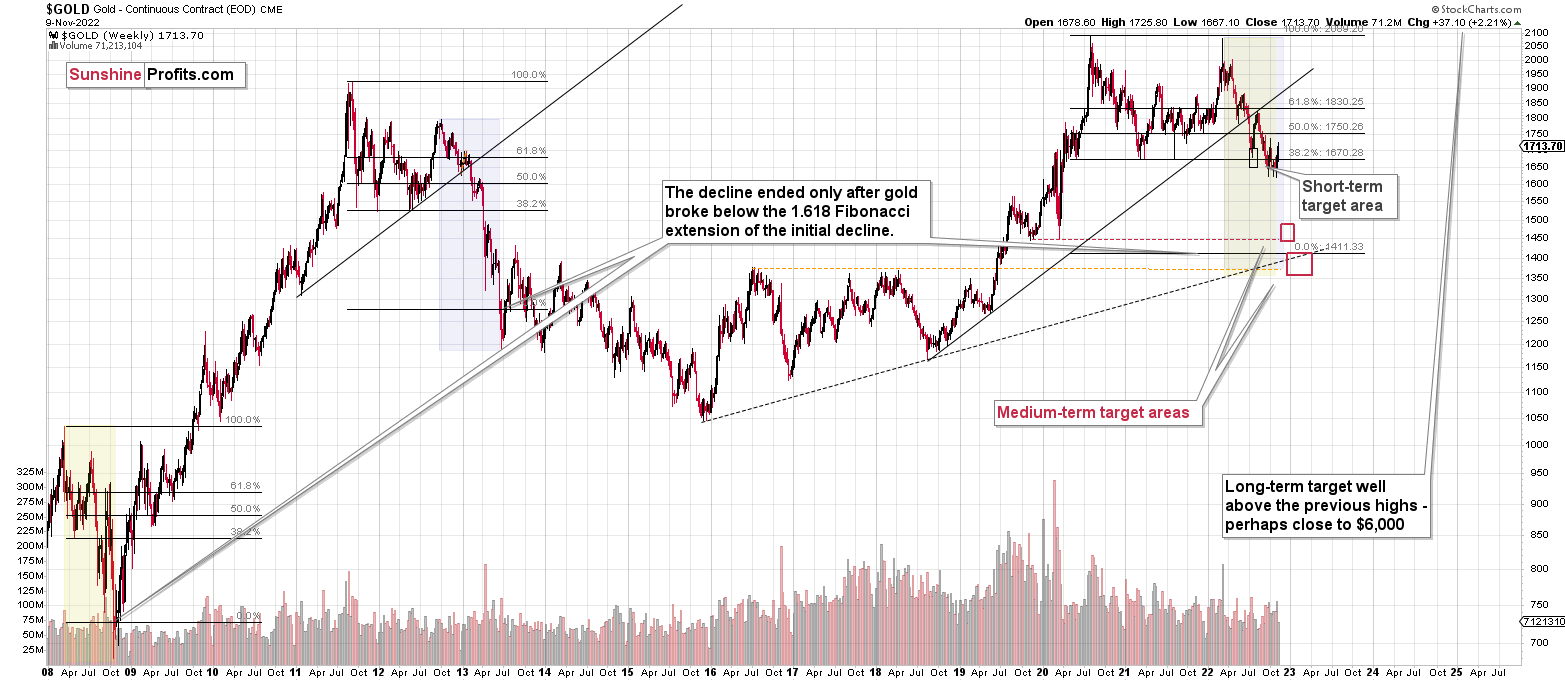
Please note that the above timing details are relatively broad and “for general overview only” – so that you know more or less what I think and how volatile I think the moves are likely to be – on an approximate basis. These time targets are not binding nor clear enough for me to think that they should be used for purchasing options, warrants, or similar instruments.
Summary
Summing up, while the precious metals sector moved higher last week, it seems that it’s just a part of a bigger – bearish – analogy to what we saw in 2008. I realize that volatile upswings generate a lot of emotions, but taking a calm, broad look at the markets shows that nothing really changed.
In fact, I would like to take this opportunity to congratulate you on your patience with this trade (and I’m grateful for your understanding that not every corrective upswing can be “caught” in trading terms). Many investors and traders panic, and get out of the market exactly at the wrong time, and your patience and self-discipline mean that you’re poised to make the most of what the market brings us this and next year.
Moving back to the market, it appears to be yet another time when the markets are incorrectly expecting the Fed to make a dovish U-turn, and based on this, the part of the 2008 decline where we saw the biggest corrective upswing materialized.
In my opinion, the current trading position is going to become profitable in the following weeks, and quite possibly in the following days. And while I can’t promise any kind of performance, I fully expect it to become very profitable before it’s over and it to prolong our 2022 winning streak.
After the final sell-off (that takes gold to about $1,350-$1,500), I expect the precious metals to rally significantly. The final part of the decline might take as little as 1-5 weeks, so it's important to stay alert to any changes.
As always, we'll keep you – our subscribers – informed.
To summarize:
Trading capital (supplementary part of the portfolio; our opinion): Full speculative short positions (300% of the full position) in junior mining stocks are justified from the risk to reward point of view with the following binding exit profit-take price levels:
Mining stocks (price levels for the GDXJ ETF): binding profit-take exit price: $20.32; stop-loss: none (the volatility is too big to justify a stop-loss order in case of this particular trade)
Alternatively, if one seeks leverage, we’re providing the binding profit-take levels for the JDST (2x leveraged). The binding profit-take level for the JDST: $27.87; stop-loss for the JDST: none (the volatility is too big to justify a SL order in case of this particular trade).
For-your-information targets (our opinion; we continue to think that mining stocks are the preferred way of taking advantage of the upcoming price move, but if for whatever reason one wants / has to use silver or gold for this trade, we are providing the details anyway.):
Silver futures downside profit-take exit price: $12.32
SLV profit-take exit price: $11.32
ZSL profit-take exit price: $74.87
Gold futures downside profit-take exit price: $1,504
HGD.TO – alternative (Canadian) 2x inverse leveraged gold stocks ETF – the upside profit-take exit price: $18.47
HZD.TO – alternative (Canadian) 2x inverse leveraged silver ETF – the upside profit-take exit price: $46.87
Long-term capital (core part of the portfolio; our opinion): No positions (in other words: cash)
Insurance capital (core part of the portfolio; our opinion): Full position
Whether you’ve already subscribed or not, we encourage you to find out how to make the most of our alerts and read our replies to the most common alert-and-gold-trading-related-questions.
Please note that we describe the situation for the day that the alert is posted in the trading section. In other words, if we are writing about a speculative position, it means that it is up-to-date on the day it was posted. We are also featuring the initial target prices to decide whether keeping a position on a given day is in tune with your approach (some moves are too small for medium-term traders, and some might appear too big for day-traders).
Additionally, you might want to read why our stop-loss orders are usually relatively far from the current price.
Please note that a full position doesn't mean using all of the capital for a given trade. You will find details on our thoughts on gold portfolio structuring in the Key Insights section on our website.
As a reminder - "initial target price" means exactly that - an "initial" one. It's not a price level at which we suggest closing positions. If this becomes the case (as it did in the previous trade), we will refer to these levels as levels of exit orders (exactly as we've done previously). Stop-loss levels, however, are naturally not "initial", but something that, in our opinion, might be entered as an order.
Since it is impossible to synchronize target prices and stop-loss levels for all the ETFs and ETNs with the main markets that we provide these levels for (gold, silver and mining stocks - the GDX ETF), the stop-loss levels and target prices for other ETNs and ETF (among other: UGL, GLL, AGQ, ZSL, NUGT, DUST, JNUG, JDST) are provided as supplementary, and not as "final". This means that if a stop-loss or a target level is reached for any of the "additional instruments" (GLL for instance), but not for the "main instrument" (gold in this case), we will view positions in both gold and GLL as still open and the stop-loss for GLL would have to be moved lower. On the other hand, if gold moves to a stop-loss level but GLL doesn't, then we will view both positions (in gold and GLL) as closed. In other words, since it's not possible to be 100% certain that each related instrument moves to a given level when the underlying instrument does, we can't provide levels that would be binding. The levels that we do provide are our best estimate of the levels that will correspond to the levels in the underlying assets, but it will be the underlying assets that one will need to focus on regarding the signs pointing to closing a given position or keeping it open. We might adjust the levels in the "additional instruments" without adjusting the levels in the "main instruments", which will simply mean that we have improved our estimation of these levels, not that we changed our outlook on the markets. We are already working on a tool that would update these levels daily for the most popular ETFs, ETNs and individual mining stocks.
Our preferred ways to invest in and to trade gold along with the reasoning can be found in the how to buy gold section. Furthermore, our preferred ETFs and ETNs can be found in our Gold & Silver ETF Ranking.
As a reminder, Gold & Silver Trading Alerts are posted before or on each trading day (we usually post them before the opening bell, but we don't promise doing that each day). If there's anything urgent, we will send you an additional small alert before posting the main one.
Thank you.
Przemyslaw K. Radomski, CFA
Founder, Editor-in-chief

