

Briefly: in our opinion, full (300% of the regular position size) speculative short positions in junior mining stocks are justified from the risk/reward point of view at the moment of publishing this Alert. I’m moving the binding take-profit levels for the current short position in mining stocks lower.
Friday’s analysis took a rather extensive form, so now I’ll briefly introduce today’s technical part.
Practically everything that I wrote about the medium-term (bearish) outlook for the precious metals sector remains up-to-date. Only the short-term situation was somewhat unclear.
Given Friday’s movement and today’s pre-market trading, the situation has been clarified. Of course, it doesn’t mean that what I’m going to describe is bound to happen, but it does mean that a certain near-term outcome just became more likely.
Let’s take a closer look at the charts for details.
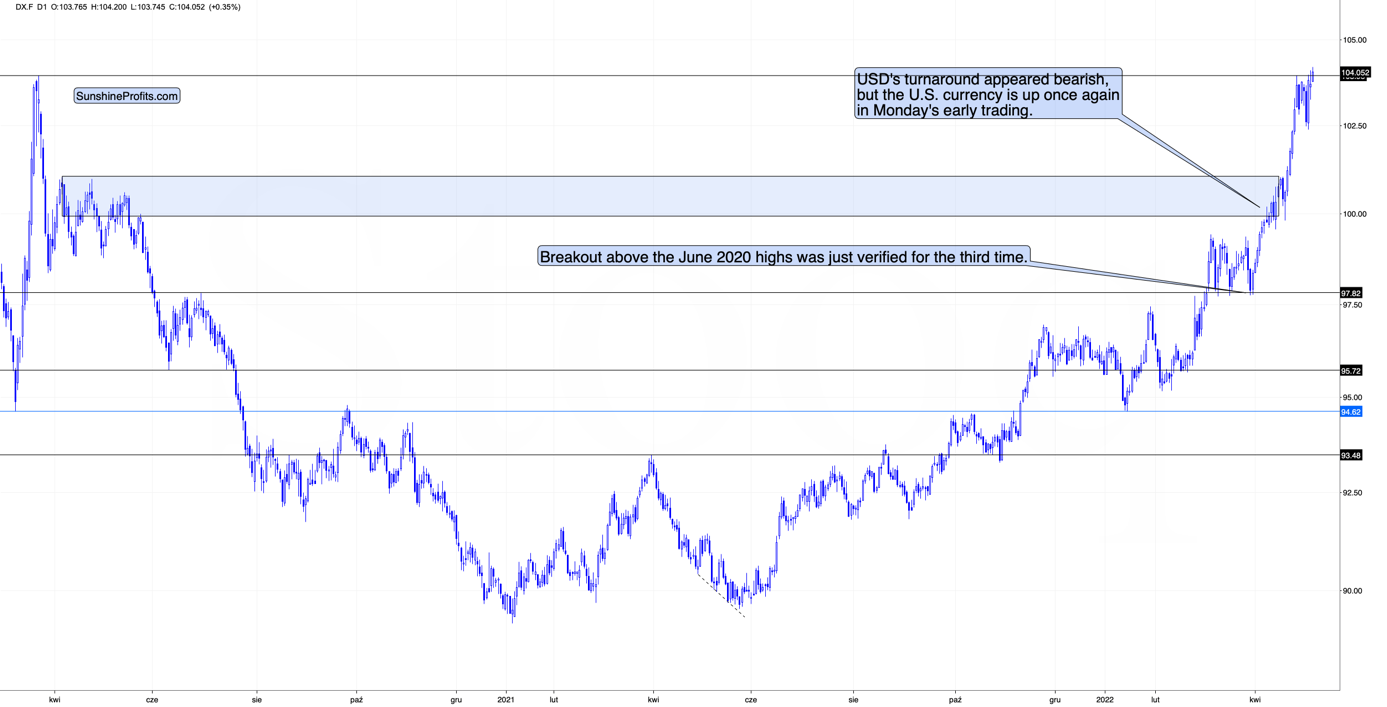
As you can see above, the USD Index just moved above its 2020 high and above its recent highs. This is a major breakout. However, given how the USD Index performed after a similar breakout (in 2014), it seems that we might see a corrective move soon (perhaps after an additional rally). I previously described it in the following way:
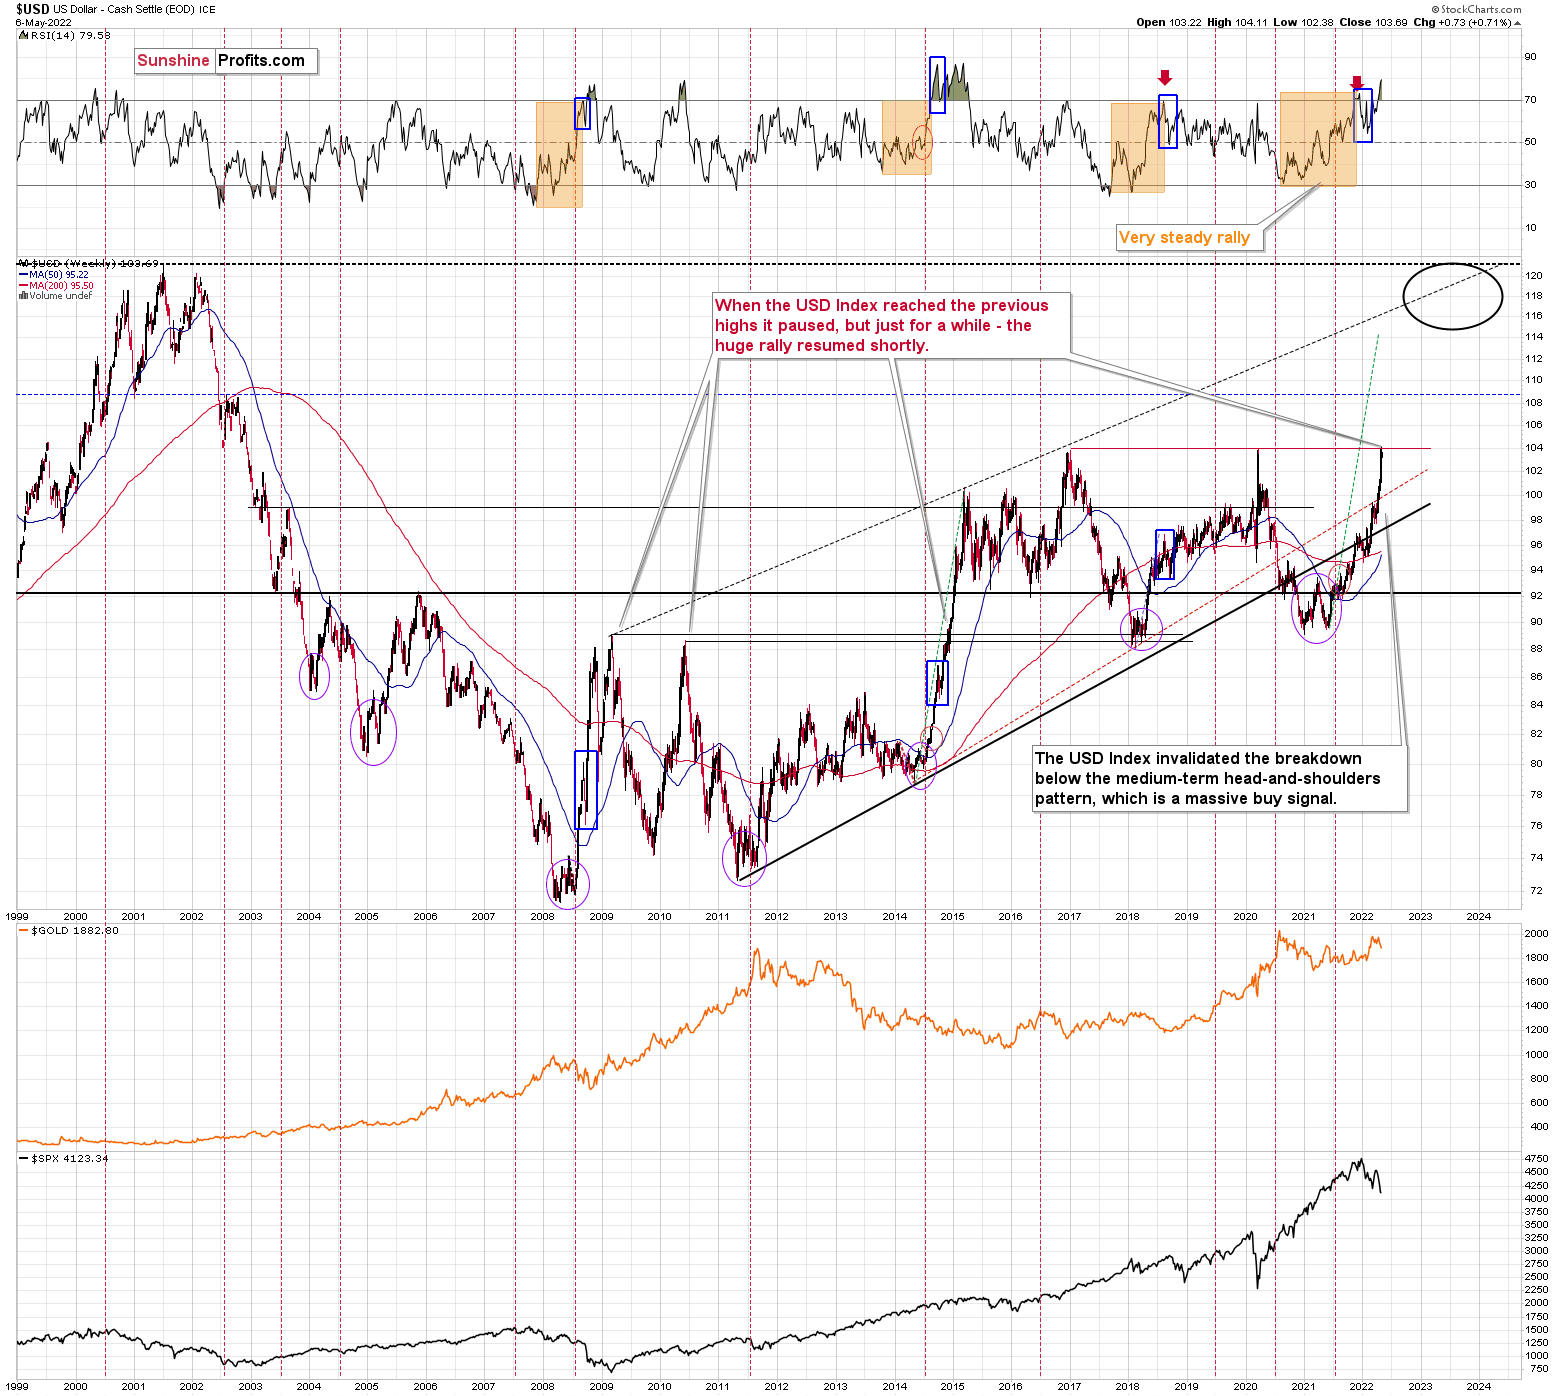
I would like to add one important detail. Back in 2014, the USD Index didn’t correct after reaching its previous high. It corrected after moving above it. The higher of the highs was the March 2009 high, at 89.11.
The higher of the recent highs is at 103.96 right now, so if the analogy to 2014 is to remain intact, the USD Index could now top at close to 104.5 or even 105.
So far, today’s pre-market high is 104.2, so the USDX could still move higher before correcting.
The important detail about today’s early trading is that while the USD Index moved above its recent highs, gold didn’t move below its recent lows.
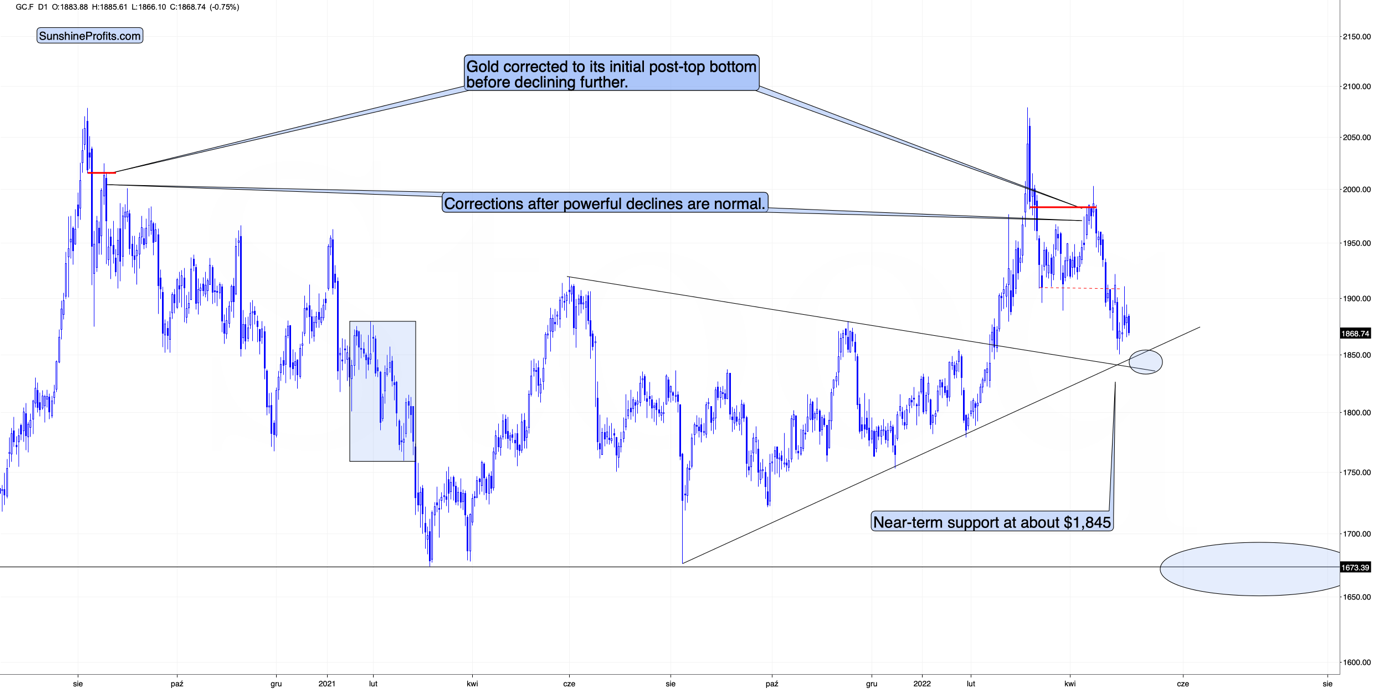
It remains above the recent highs and not that far from its downside target area, provided by the rising and declining support lines, as well as by the very recent lows.
From gold’s perspective, the short-term (!) downside appears limited.
From USD’s perspective, the short-term (!) upside appears limited.
We see that gold is acting relatively strong today given what’s happening in the USDX. This is a bullish combination for the short term and suggests that a short-term bottom in gold is near. Of course, the medium-term trend remains bearish nonetheless.
Interestingly, while gold didn’t move to new short-term lows, silver and junior mining stocks did.
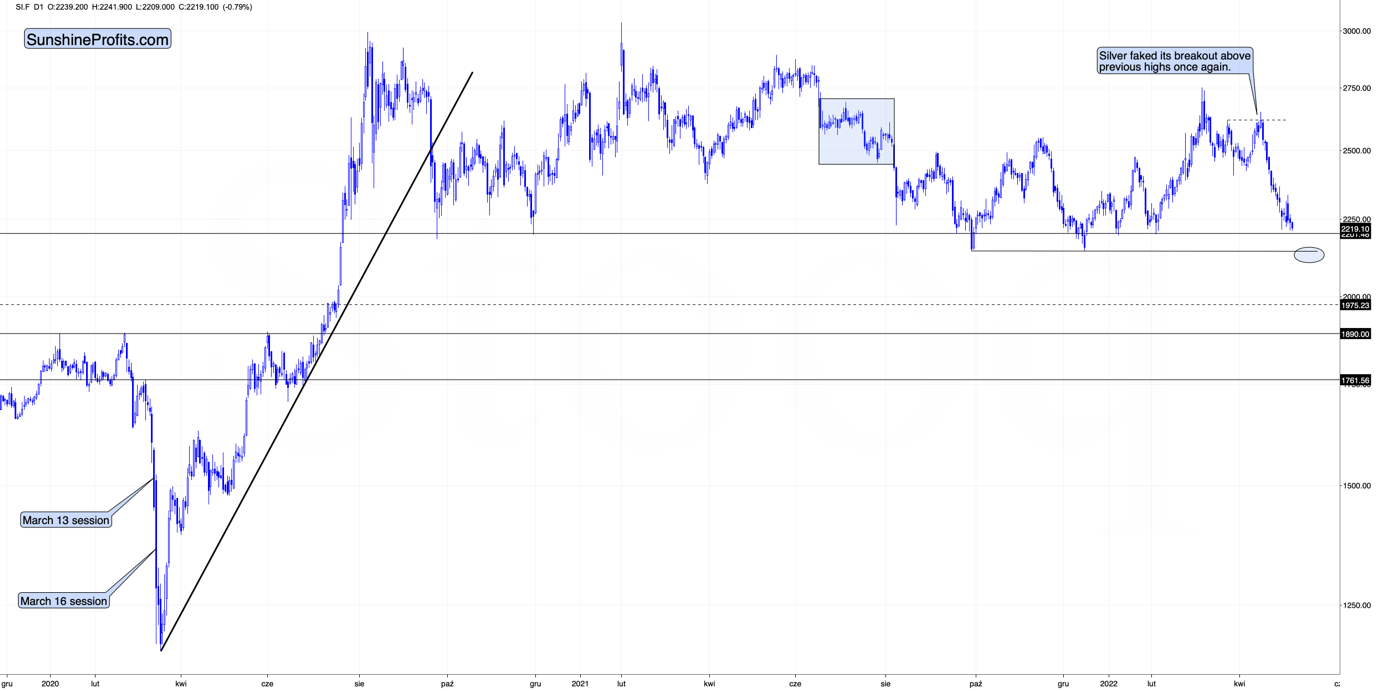
Silver moved just slightly lower, but that was enough for it to move below the previous local lows.
The support provided by the recent lows is quite close (marked with a blue ellipse), but silver is not there yet.
Here’s what the GDXJ ETF is doing in today’s London trading.
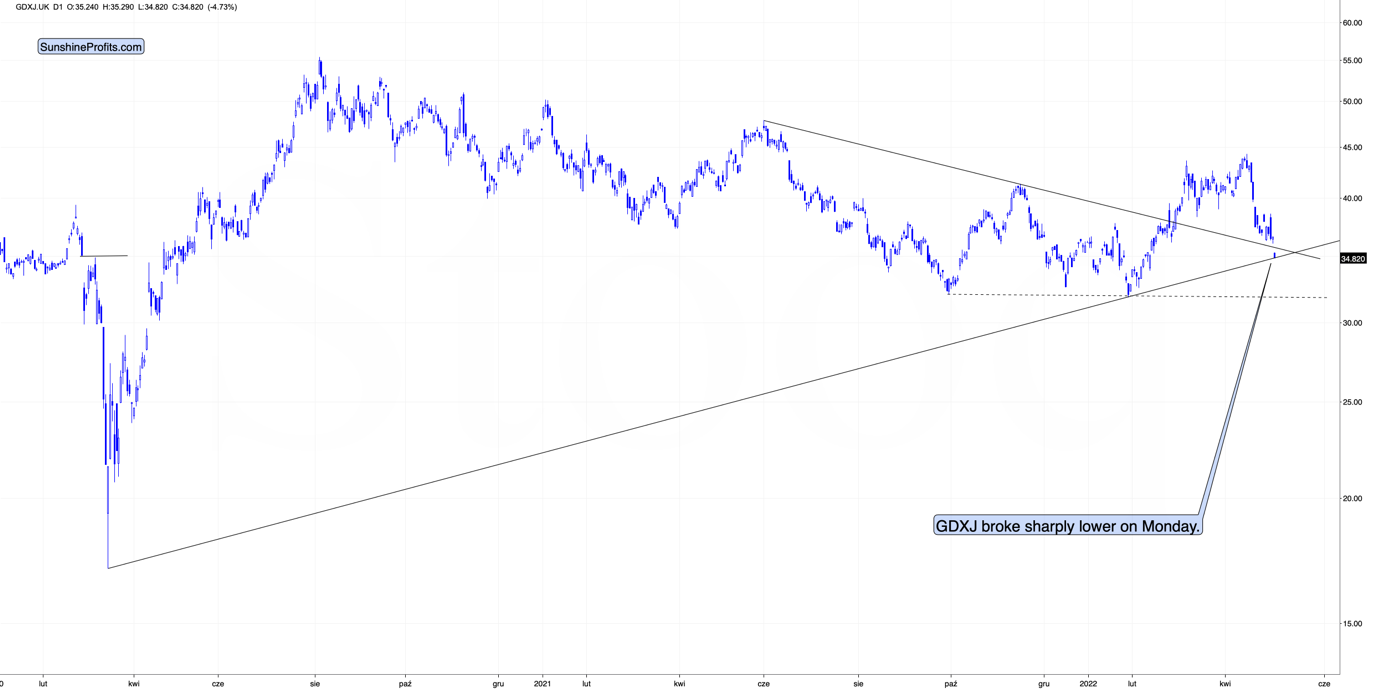
It declined sharply and moved to the rising support line based on the 2020 and 2022 lows. This level is what I described (on the analogous version of the above chart, based on the prices from the U.S.) as something that could stop the current short-term decline.
So, will the GDXJ bottom today or is it bottoming (from the European point of view) right now?
To better answer that question, let’s take a look at the likely reason for today’s silver and miners’ weakness – the general stock market.
Before moving to the overnight changes, let’s recall what I wrote about stocks on Friday:
After the immediate “phew-its-not-a-0.75-rate-hike rally”, we saw a “hold-up-rates-are-still-soaring-aaah-decline”. Is the relief rally already over?
That, ladies and gentlemen, is the key question right now.
It could be the case that one rally is over, but it doesn’t mean that another one couldn’t start from just slightly lower levels.
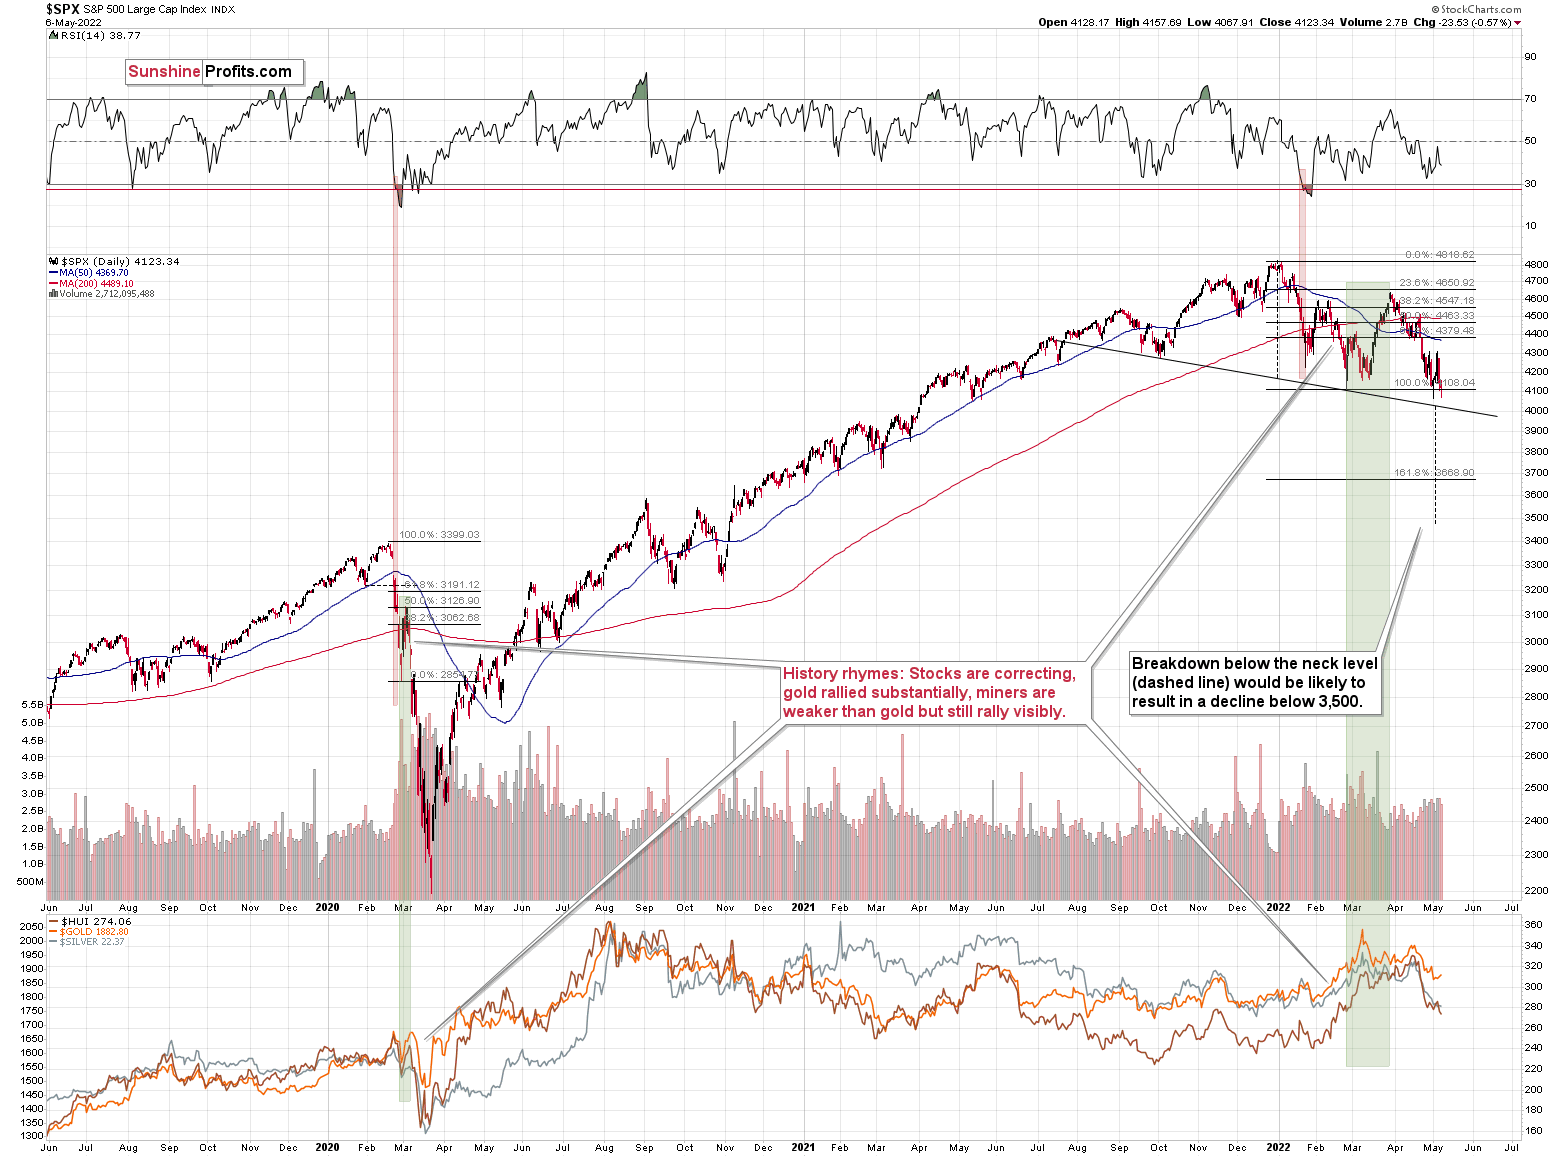
The S&P 500 is currently forming a (potential so far) head and shoulders pattern, and once it moves below its neck level (slightly above 4,000), the formation will be complete, and the next target will be below 3,500. So, yes, I expect the S&P 500 to decline below its 2021 lows in the near future.
Still, it doesn’t mean that we can’t get another brief rally in the meantime. In fact, the head and shoulders formations are often immediately followed by a brief corrective upswing – one that takes the market close to or right back to the previously broken neck level of the H&S pattern. Seeing this kind of rally would perfectly correspond to the scenario in which S&P rallies when the RSI indicator moves to 30, and it would perfectly match other potential price moves that I mentioned earlier today.
In other words, if stocks decline somewhat and then correct, it could translate into the same thing in gold, silver, and mining stocks. Given the stronger link between stocks and silver and miners duo, the latter could correct more visibly.
The chart below features the S&P 500 futures chart.
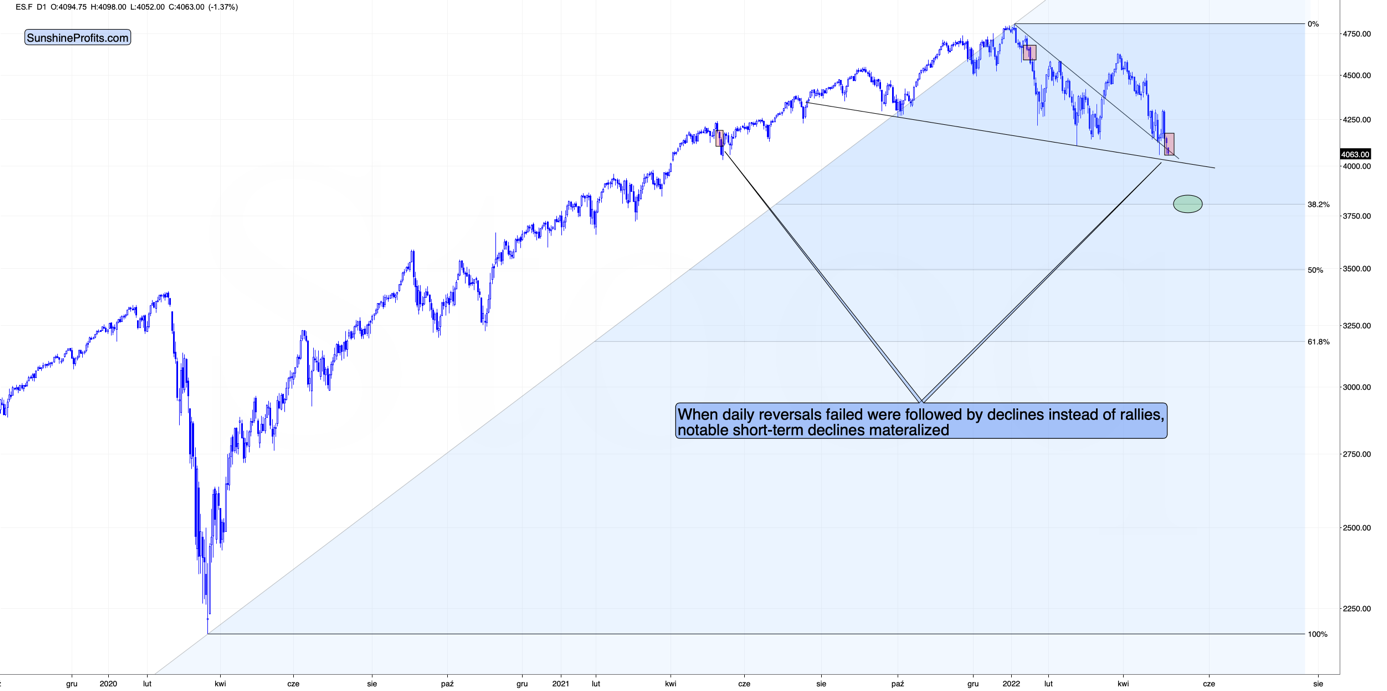
On Friday, the S&P 500 had its lowest daily close of the year. While investors might not see many technical patterns, they’ll definitely notice something like that. That’s bearish – it could trigger some panic selling among investors, and today’s pre-market decline indicates that it might already be taking place.
Interestingly, Friday’s session was a daily reversal, so it seems that stocks should be rallying today, but… they are not. Technically, it’s the futures market that shows declines, not the index itself, but futures can be used as the index’s proxy here.
That’s where the situation gets really interesting. There were very few cases when a daily reversal was followed by a decline below the reversal’s low. In fact, in the recent past, there were just two such cases, and I marked them with red rectangles. In both cases, short-term declines followed. What’s notable is that this was the way in which the January decline started, and the decline that followed was sizable.
if stocks are about to decline (continuing their pre-market decline), then they would do so after a consolidation that took the form of a flag. Thus, the price would be likely to fall by about the same amount as it had fallen before the pattern. One could argue when the previous short-term decline started (at the recent top or at the very recent top before the decline accelerated), but overall, it seems that stocks would be likely to decline below the neck level of their head and shoulders formation, and then decline some more.
Is there any nearby support level that would be strong enough to stop this short-term decline? Yes: it’s the 38.2% Fibonacci retracement level based on the 2020-2022 rally.
Back in 2020, the very first decline erased 50% of the preceding rally, but back then the market was much more volatile than it is right now, so it’s understandable.
If we see a decline to the 38.2% Fibonacci retracement and then a comeback to the previously broken neck level of the head and shoulders pattern, it would fit practically everything that I wrote above.
It would trigger a sizable decline in junior mining stocks in the near term.
If so, then it’s unlikely that junior miners are bottoming right now, as one might expect based on the chart that I featured earlier today. Instead, it seems that the GDXJ might indeed have managed to decline to its previous 2022 lows and then correct sharply from there.
In order for gold to reach its target, it only needs to decline by as much as it has already declined today.
However, in order for the general stock market to reach its downside target, it would need to decline several times as much as it has already declined today.
In today’s pre-market trading, junior miners are taking the stock market’s bearish lead. Consequently, they could decline much more than just as much as they already have today.
Therefore, the scenario in which junior miners move to their previous lows before bouncing is currently the most important one, in my opinion. Consequently, I’m lowering the exit prices for the current short position, in order to capitalize on a bigger move lower.
Having said that, let’s take a look at the markets from a fundamental point of view.
A Falling Knife
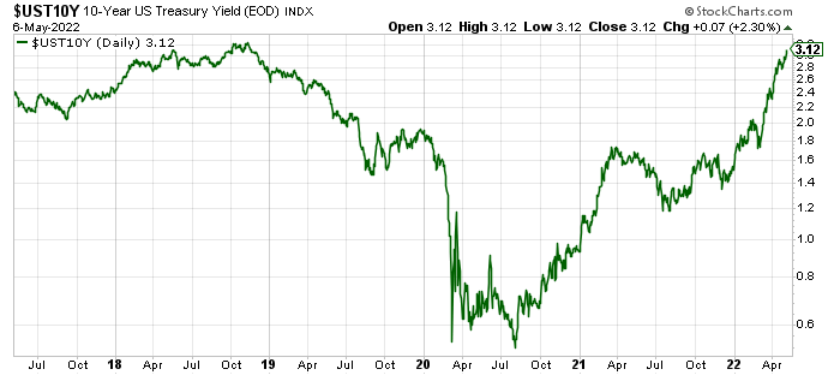
Month after month, investors hope that bond prices will bottom and yields will top. However, as the consensus gets cut each time they attempt to catch the falling knife, the U.S. 10-Year Treasury yield continues to hit new post-pandemic highs. Moreover, with the interest rate benchmark ending the May 6 session at 3.12%, higher highs and higher lows should remain the story over the medium term.
Please see below:
To explain why, I wrote on Apr. 20:
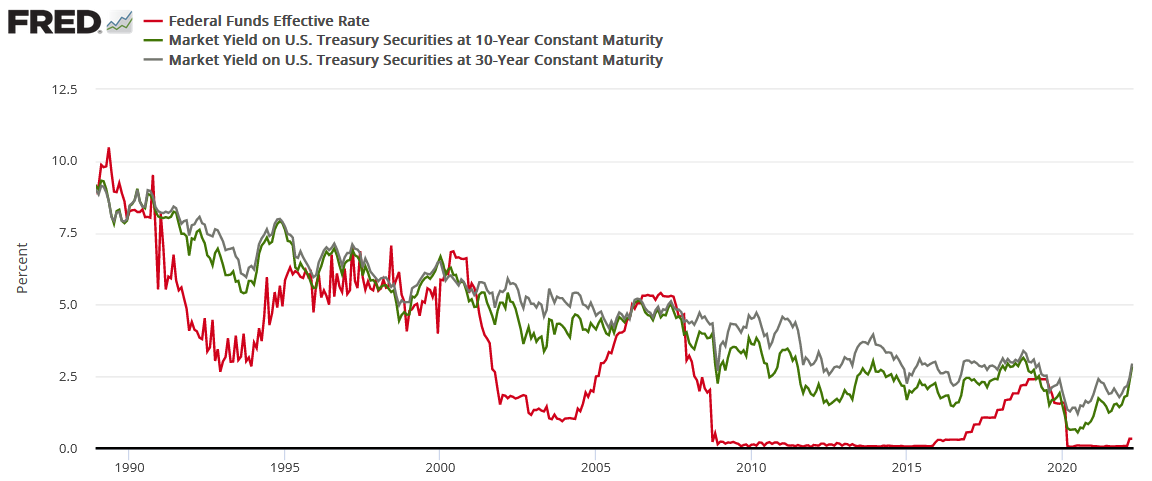
The red line above tracks the U.S. federal funds rate, while the green and gray lines above track the U.S. 10-Year and 30-Year Treasury yields. If you analyze the connection, you can see that the latter two often take their orders from the former. In a nutshell: when the Fed raises interest rates, it takes several hikes of 0.25% before long-term yields rollover. For example:
- In 2018, the U.S. 10-Year Treasury yield peaked after ~9 rate hikes.
- In 2006, the U.S. 10-Year Treasury yield peaked after ~17 rate hikes.
- In 2000, the U.S. 10-Year Treasury yield peaked after ~7 rate hikes.
- In 1994, the U.S. 10-Year Treasury yield peaked after ~12 rate hikes.
Thus, with modern history showcasing that the U.S. 10-Year Treasury yield doesn't peak until the Fed is well within its rate hike cycle, please remember that the Fed has only hiked [three times]. Therefore, with seven rate hikes the minimum to elicit a peak over the last ~28 years, the U.S. 10-Year Treasury yield should have room to run, and this is bullish for real yields and bearish for gold.
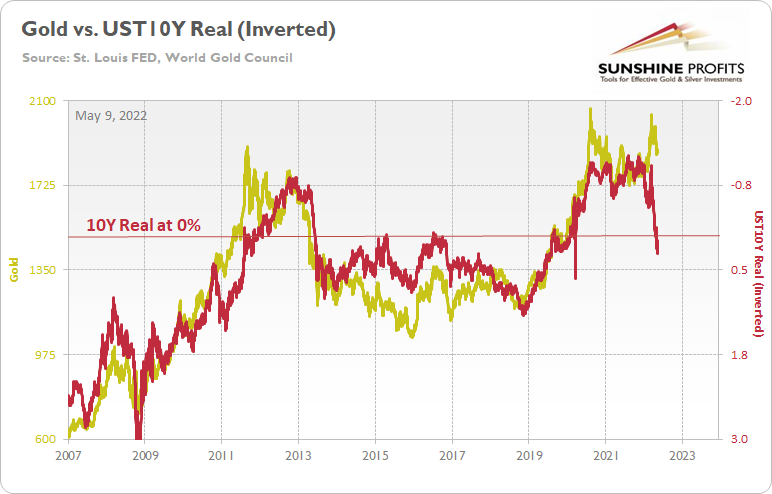
To that point, as the U.S. 10-Year Treasury yield reaches new heights, the U.S. 10-Year real yield has followed suit. Moreover, with the U.S. 10-Year real yield ending the May 6 session at 0.26%, the USD Index, the GDXJ ETF, silver, the S&P 500 and the NASDAQ Composite have taken note of the implications. However, with gold still stuck in the denial phase, a rude awakening should confront the yellow metal over the medium term.
Please see below:
In addition, I’ve been warning for months that real yields need to rise to help tame inflation. Moreover, with the PMs highly allergic to higher real interest rates, their domestic fundamental outlooks couldn’t be more bearish. To explain, I wrote on Jan. 12:
The PMs are less volatile than speculative assets. However, it's important to remember that gold, silver and mining stocks peaked amid the liquidity-fueled surge in the summer of 2020. Likewise, their uprisings coincided with real interest rates that were at all-time lows at the time. Conversely, with the Fed's liquidity drain already unfolding and real interest rates poised to rise in the coming months, the PMs should suffer from the likely re-pricings.
Thus, while things have gotten really ‘real’ in recent months, the ‘real’ story is likely still ahead of us. To explain, Fed Chairman Jerome Powell basically said on May 4 that the FOMC will hike interest rates by 50 basis points at the next two monetary policy meetings. For context, a realization likely requires that inflation and employment remain elevated in the interim (which are extremely likely).
Please see below:
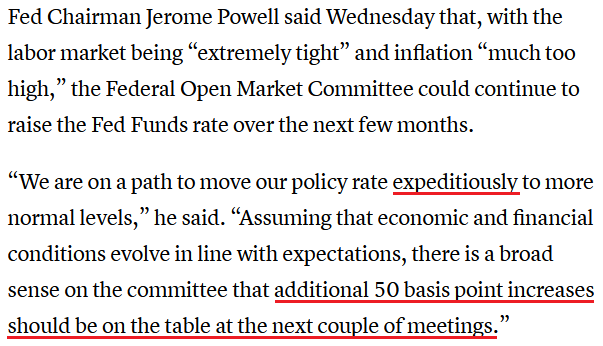 Source: CNBC
On top of that, Minneapolis Fed President Neel Kashkari (a major dove) took the words right out of my mouth on May 6. He said:
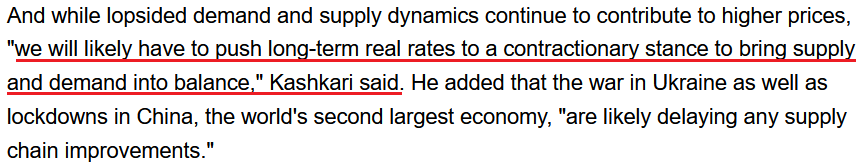 Source: Seeking Alpha
Therefore, with “contractionary” implying a U.S. 10-Year real yield at or above the highs from 2018 (> 1%), a realization is profoundly bearish for the PMs.
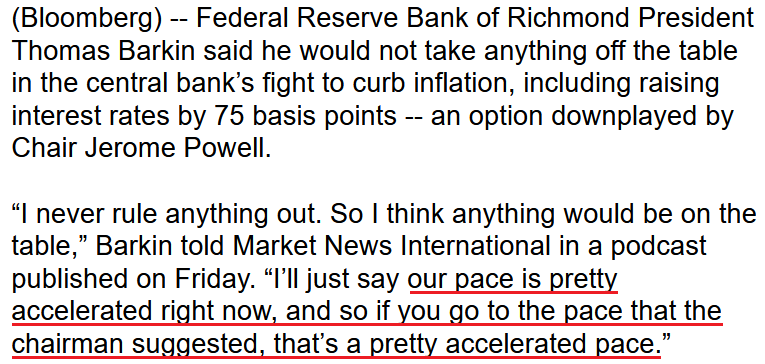
Supporting the thesis, Richmond Fed President Thomas Barkin said on May 6 that “Demand is very strong and inflation is very high. Both are pointing in the direction that you can raise rates and you can raise rates relatively quickly.... As imperfect as inflation expectation assessments are, if you start convincing yourself that inflation expectations are starting to move, that’s to me the strongest case to try to move faster,”
As a result, Barkin may support a 75 basis point rate hike. However, whether it’s 75 or 50, the important point is that the Fed’s rate hike cycle is poised to commence at “a pretty accelerated pace.”
Please see below:
 Source: Bloomberg
Furthermore, Fed Governor Christopher Waller said on May 6 that "If we knew then what we know now, I believe the [FOMC] would have accelerated tapering and raised rates sooner. But no one knew, and that’s the nature of making monetary policy in real time."
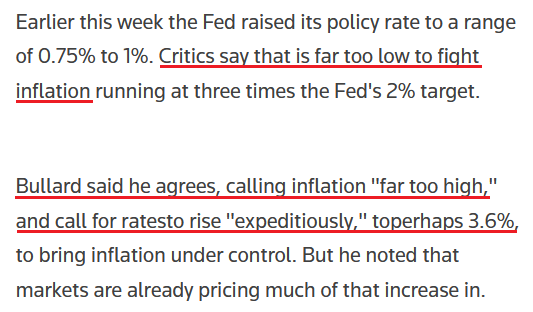
Likewise, St. Louis Fed President James Bullard reiterated on May 6 that interest rates are “going in the right direction” and “hopefully we'll be able to get away from this behind-the-curve characterization soon."
Please see below:
 Source: Reuters
If that wasn’t enough, former Fed Vice Chairman Richard Clarida – who left in January 2022 – had this to say on May 5:
“Expeditiously getting to neutral will not be enough this cycle to return inflation over the forecast horizon back to the 2% longer-run goal. The funds rate will, I believe, ultimately need to be raised well into restrictive territory, by at least a percentage point above the estimated nominal neutral rate of 2.5%.”
As a result, lifting the U.S. federal funds rate “at least a percentage point above the estimated nominal neutral rate of 2.5%” implies an overnight lending rate of 3.5% or more.
Therefore, despite the surge in the USD Index and sharp drawdowns of the S&P 500 and the NASDAQ Composite, current and former Fed officials have not cowered in their calls for “expeditiously” higher interest rates in 2022.
Moreover, when major doves like Kashkari – who believes that the neutral rate is closer to 2% – advocate for higher real interest rates, gold is the only asset not getting the memo. As such, the yellow metal’s attempt to re-write history should end in failure over the medium term.
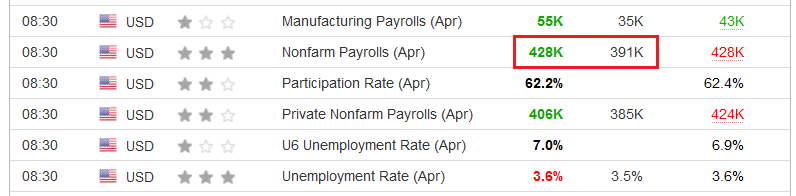
Adding fuel to the hawkish fire, U.S. nonfarm payrolls came in at 428,000 versus 391,000 expected on May 6. Thus, the U.S. labor market is humming along and should help keep the Fed’s foot on the hawkish accelerator.
Please see below:
 Source: Investing.com
In addition, the U.S. Bureau of Labor Statistics (BLS) revealed that “Average hourly earnings for all employees on private nonfarm payrolls rose by 10 cents, or 0.3 percent, to $31.85 in April. Over the past 12 months, average hourly earnings have increased by 5.5 percent.”
As such, while average hourly earnings (wage inflation) met expectations on a year-over-year (YoY) basis and missed on a month-over-month (MoM) basis, it’s important to remember that retail earnings declined by 5.1% MoM (the largest one-month drop since October 2020). Outside of that, wage inflation was abundant.
Please see below:
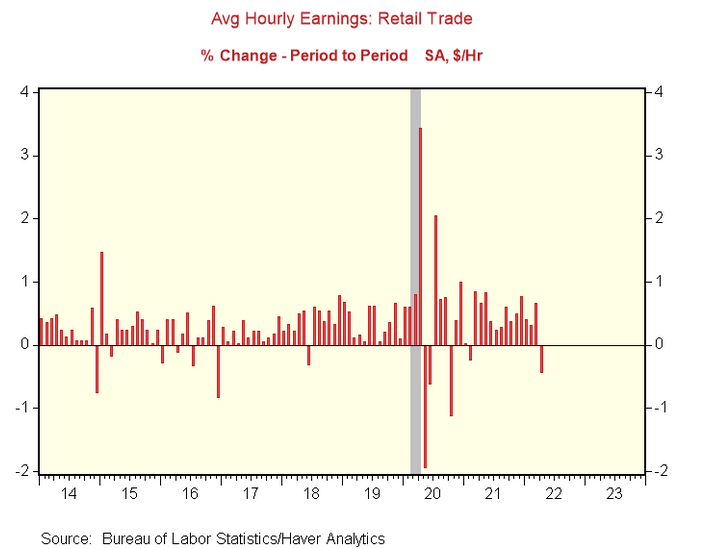
To explain, the red bars above track the MoM percentage change in retail average hourly earnings. If you analyze the right side of the chart, you can see that the metric declined sharply in April. However, the weakness is likely an outlier, as MoM declines are often followed by increases the following month. As a result, the fundamentals continue to support several rate hikes over the next several months.
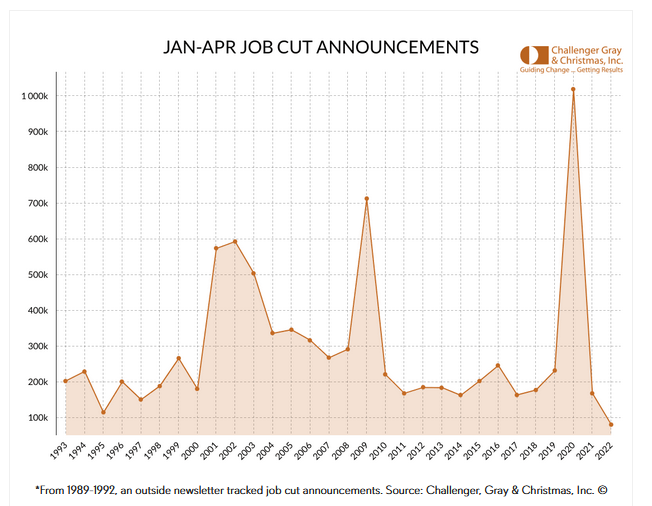
Finally, Challenger, Gray & Christmas released their latest job cuts report on May 5. An excerpt read:
“U.S.-based employers announced 24,286 cuts in April, a 14% increase from the 21,387 announced in March and up 6% from the 22,913 cuts announced in April 2021. It is the first time this year job cuts were higher than the corresponding month a year earlier.”
However:
“So far this year, employers announced plans to cut 79,982 jobs, down 52% from the 167,599 cuts announced through the same period in 2021. It is the lowest recorded January-April total since Challenger began tracking monthly job cut announcements in 1993.”
As a result, by smoothing out the data on a four-month basis, the group found that the number of layoffs are at an all-time low.
The bottom line? While investors keep waiting for bond yields to fall, history shows that long-term interest rates continue to rise until the Fed is well into its rate hike cycle. Moreover, with inflation still extremely elevated and Fed officials upping the hawkish ante, investors should find little fundamental reprieve until inflation materially slows down. However, this can only happen if stock, and more importantly, commodity prices decline materially as well. Therefore, my comments from Apr. 6 should prove prescient over the next several months:
Please remember that the Fed needs to slow the U.S. economy to calm inflation, and rising asset prices are mutually exclusive to this goal. Therefore, officials should keep hammering the financial markets until investors finally get the message.
Moreover, with the Fed in inflation-fighting mode and reformed doves warning that the U.S. economy “could teeter” as the drama unfolds, the reality is that there is no easy solution to the Fed’s problem. To calm inflation, it has to kill demand. And as that occurs, investors should suffer a severe crisis of confidence.
In conclusion, the PMs were mixed on May 6, as gold remains in la-la land. However, with silver, mining stocks and the general stock market suffering mightily in recent weeks, their price action is likely an appetizer of what should unfold over the next few months. As a result, the PMs' medium-term outlooks remain profoundly bearish, even though a buy signal may present us with a short-term trading opportunity in the coming days.
Naturally, as always, I’ll keep you – my subscribers – informed.
Overview of the Upcoming Part of the Decline
- It seems to me that the post-decline consolidation is now over, and that gold, silver, and mining stocks are now likely to continue their medium-term decline. A brief, short-term rally could materialize soon, anyway.
- It seems that the first ( bigger ) stop for gold will be close to its previous 2021 lows, slightly below $1,800 . Then it will likely correct a bit, but it’s unclear if I want to exit or reverse the current short position based on that – it depends on the number and the nature of the bullish indications that we get at that time.
- After the above-mentioned correction, we’re likely to see a powerful slide, perhaps close to the 2020 low ($1,450 - $1,500).
- If we see a situation where miners slide in a meaningful and volatile way while silver doesn’t (it just declines moderately), I plan to – once again – switch from short positions in miners to short positions in silver. At this time, it’s too early to say at what price levels this could take place, and if we get this kind of opportunity at all – perhaps with gold close to $1,600.
- I plan to exit all remaining short positions once gold shows substantial strength relative to the USD Index while the latter is still rallying. This may be the case with gold close to $1,350 - $1,400. I expect silver to fall the hardest in the final part of the move. This moment (when gold performs very strongly against the rallying USD and miners are strong relative to gold after its substantial decline) is likely to be the best entry point for long-term investments, in my view. This can also happen with gold close to $1,375, but at the moment it’s too early to say with certainty.
- As a confirmation for the above, I will use the (upcoming or perhaps we have already seen it?) top in the general stock market as the starting point for the three-month countdown. The reason is that after the 1929 top, gold miners declined for about three months after the general stock market started to slide. We also saw some confirmations of this theory based on the analogy to 2008. All in all, the precious metals sector is likely to bottom about three months after the general stock market tops.
- The above is based on the information available today, and it might change in the following days/weeks.
You will find my general overview of the outlook for gold on the chart below:
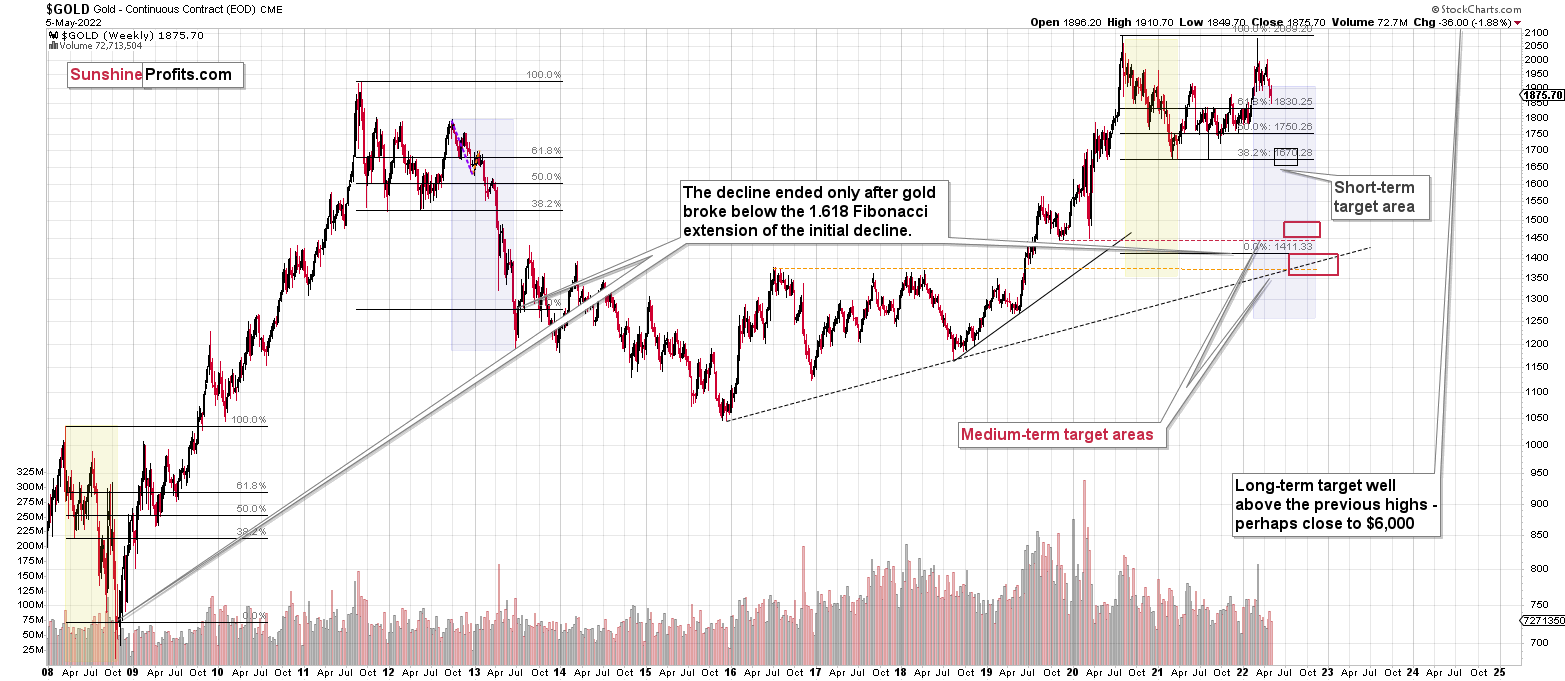
Please note that the above timing details are relatively broad and “for general overview only” – so that you know more or less what I think and how volatile I think the moves are likely to be – on an approximate basis. These time targets are not binding or clear enough for me to think that they should be used for purchasing options, warrants or similar instruments.
Summary
Summing up, it seems that we are about to see a short-term corrective upswing in the precious metals sector (after another very short-term move lower), even though the medium-term trend remains clearly down.
The medium-term downtrend is likely to continue shortly (perhaps after a weekly or a few-day long correction). As investors are starting to wake up to the reality, the precious metals sector (particularly junior mining stocks) is declining sharply. Here are the key aspects of the reality that market participants have ignored:
- rising real interest rates,
- rising USD Index values.
Both of the aforementioned are the two most important fundamental drivers of the gold price. Since neither the USD Index nor real interest rates are likely to stop rising anytime soon (especially now that inflation has become highly political), the gold price is likely to fall sooner or later. Given the analogy to 2012 in gold, silver, and mining stocks, “sooner” is the more likely outcome.
It seems that our profits from short positions are going to become truly epic in the coming months.
For now, I’m adjusting the exit price levels. Please note that they are “binding exit prices”, which means that I think that exiting the short positions without an additional (manual) confirmation from me is a good idea. I think that once these short positions are closed, entering long ones (100% of the regular position size) is also a good idea. If one wants to use a leveraged ETF for this long trade, the JNUG might be worth considering. However, it seems that in most cases, simply using the GDXJ would be sufficient (I’m writing about 100% of the regular position size, not 200% or 300% as I am right now in the case of the short positions). Then again, it’s your capital, and you can do with it whatever you want and are comfortable with.
Of course, if you’re not comfortable with such short-term trading, you can ignore this quick trade and focus on the bigger downturn.
After the final sell-off (that takes gold to about $1,350-$1,500), I expect the precious metals to rally significantly. The final part of the decline might take as little as 1-5 weeks, so it's important to stay alert to any changes.
As always, we'll keep you – our subscribers – informed.
To summarize:
Trading capital (supplementary part of the portfolio; our opinion): Full speculative short positions (300% of the full position) in junior mining stocks are justified from the risk to reward point of view with the following binding exit profit-take price levels:
Mining stocks (price levels for the GDXJ ETF): binding profit-take exit price: $37.23; stop-loss: none (the volatility is too big to justify a stop-loss order in case of this particular trade)
Alternatively, if one seeks leverage, we’re providing the binding profit-take levels for the JDST (2x leveraged) and GDXD (3x leveraged – which is not suggested for most traders/investors due to the significant leverage). The binding profit-take level for the JDST: $11.59; stop-loss for the JDST: none (the volatility is too big to justify a SL order in case of this particular trade); binding profit-take level for the GDXD: $15.79; stop-loss for the GDXD: none (the volatility is too big to justify a SL order in case of this particular trade).
For-your-information targets (our opinion; we continue to think that mining stocks are the preferred way of taking advantage of the upcoming price move, but if for whatever reason one wants / has to use silver or gold for this trade, we are providing the details anyway.):
Silver futures downside profit-take exit price: $21.63
SLV profit-take exit price: $20.14
ZSL profit-take exit price: $27.89
Gold futures downside profit-take exit price: no position (the target was already reached)
HGD.TO – alternative (Canadian) inverse 2x leveraged gold stocks ETF – the upside profit-take exit price: $7.78
HZD.TO – alternative (Canadian) inverse 2x leveraged silver ETF – the upside profit-take exit price: $21.47
Long-term capital (core part of the portfolio; our opinion): No positions (in other words: cash
Insurance capital (core part of the portfolio; our opinion): Full position
Whether you already subscribed or not, we encourage you to find out how to make the most of our alerts and read our replies to the most common alert-and-gold-trading-related-questions.
Please note that we describe the situation for the day that the alert is posted in the trading section. In other words, if we are writing about a speculative position, it means that it is up-to-date on the day it was posted. We are also featuring the initial target prices to decide whether keeping a position on a given day is in tune with your approach (some moves are too small for medium-term traders, and some might appear too big for day-traders).
Additionally, you might want to read why our stop-loss orders are usually relatively far from the current price.
Please note that a full position doesn't mean using all of the capital for a given trade. You will find details on our thoughts on gold portfolio structuring in the Key Insights section on our website.
As a reminder - "initial target price" means exactly that - an "initial" one. It's not a price level at which we suggest closing positions. If this becomes the case (like it did in the previous trade), we will refer to these levels as levels of exit orders (exactly as we've done previously). Stop-loss levels, however, are naturally not "initial", but something that, in our opinion, might be entered as an order.
Since it is impossible to synchronize target prices and stop-loss levels for all the ETFs and ETNs with the main markets that we provide these levels for (gold, silver and mining stocks - the GDX ETF), the stop-loss levels and target prices for other ETNs and ETF (among other: UGL, GLL, AGQ, ZSL, NUGT, DUST, JNUG, JDST) are provided as supplementary, and not as "final". This means that if a stop-loss or a target level is reached for any of the "additional instruments" (GLL for instance), but not for the "main instrument" (gold in this case), we will view positions in both gold and GLL as still open and the stop-loss for GLL would have to be moved lower. On the other hand, if gold moves to a stop-loss level but GLL doesn't, then we will view both positions (in gold and GLL) as closed. In other words, since it's not possible to be 100% certain that each related instrument moves to a given level when the underlying instrument does, we can't provide levels that would be binding. The levels that we do provide are our best estimate of the levels that will correspond to the levels in the underlying assets, but it will be the underlying assets that one will need to focus on regarding the signs pointing to closing a given position or keeping it open. We might adjust the levels in the "additional instruments" without adjusting the levels in the "main instruments", which will simply mean that we have improved our estimation of these levels, not that we changed our outlook on the markets. We are already working on a tool that would update these levels daily for the most popular ETFs, ETNs and individual mining stocks.
Our preferred ways to invest in and to trade gold along with the reasoning can be found in the how to buy gold section. Furthermore, our preferred ETFs and ETNs can be found in our Gold & Silver ETF Ranking.
As a reminder, Gold & Silver Trading Alerts are posted before or on each trading day (we usually post them before the opening bell, but we don't promise doing that each day). If there's anything urgent, we will send you an additional small alert before posting the main one.
Thank you.
Przemyslaw Radomski, CFA
Founder, Editor-in-chief

