

Briefly: in our opinion, full (300% of the regular position size) speculative short positions in junior mining stocks are justified from the risk/reward point of view at the moment of publishing this Alert.
Another day, another slide in gold. And silver. And miners, especially juniors. And there’s much more to come! However, when will the declines stop, and when will the first correction occur? Let’s check.
As far as the first question is concerned, then if you’ve been reading my analyses for some time (or at least you read last week’s flagship analysis), you know that it’s likely that the final bottoms in gold, silver, and mining stocks are likely to be much lower than the current price levels. It will probably be below $1,500 in gold, perhaps close to $1,400 or slightly below it.
However, no market moves up or down in a straight line. Consequently, there will be corrections, and perhaps we’ll see one within a week.
I already discussed the key details behind the above in yesterday’s Gold & Silver Trading Alert, so today, I’ll update you on the key changes.
Let’s start today’s analysis with a quick look at changes in the long-term HUI Index chart – the flagship proxy for gold stocks.
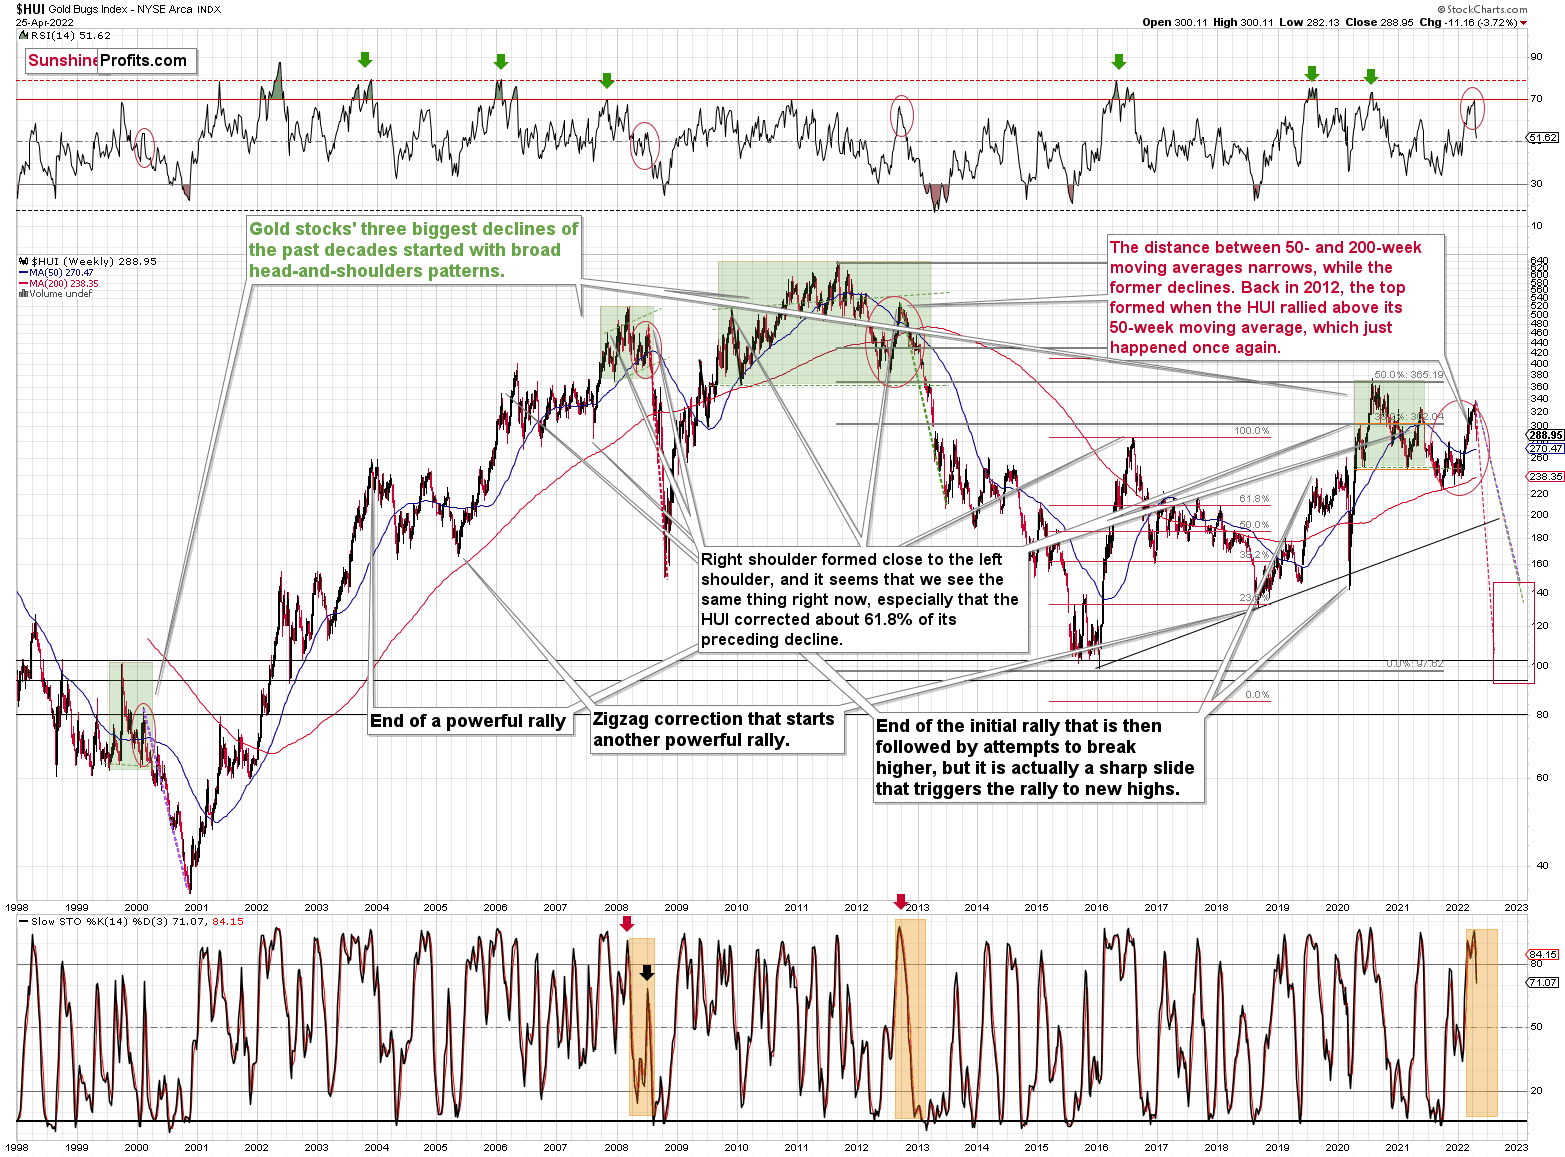
Last week, we saw a powerful weekly reversal, a decline in the RSI indicator from about 70, which confirmed the previous sell signal, and a fresh medium-term sell signal from the stochastic indicator.
In particular, the weekly reversal and the sell signal from stochastic are important, as they closely link last week with what we saw right after the final top in 2008 and 2012.
History is likely about to rhyme, and the implications are extremely bearish for mining stocks for the next few months.
Let’s zoom in.
While senior gold stocks declined by a bit less than 10%, junior miners fell by a bit more than 10% last week.
Juniors closed almost 4% lower yesterday, too.
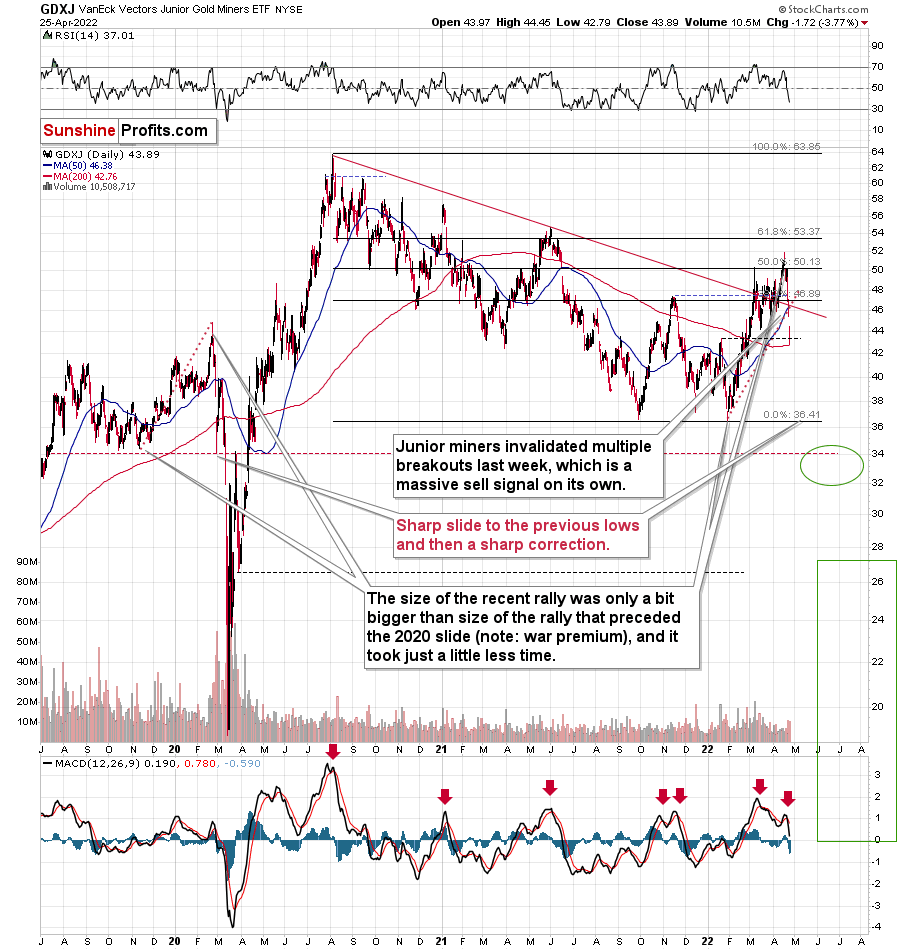
Yesterday, I wrote about multiple sell signals from the GDXJ ETF chart, and the price indeed fell yesterday. I wrote the following:
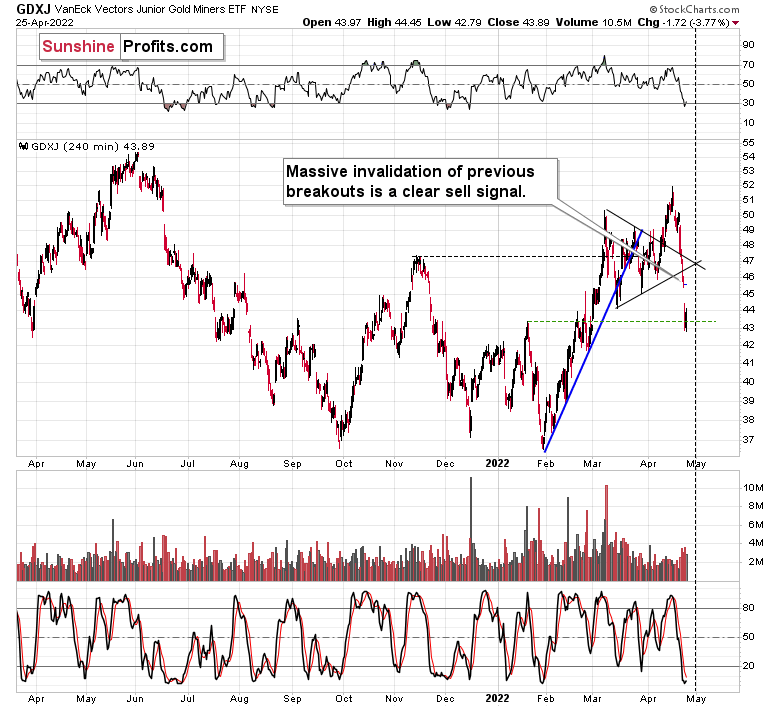
The key thing is that practically all the seemingly bullish breakouts that we saw recently were just invalidated.
The breakout above the declining red resistance line was invalidated.
The breakout above the late-2021 high was invalidated.
The breakout above the 50% Fibonacci retracement level based on the 2020-2022 decline had been (earlier) invalidated.
The breakout above the upper border of the previous triangle pattern was invalidated.
The breakout above the lower border of the previous triangle pattern was invalidated.
That’s a sell signal on top of a sell signal, on top of a sell signal, on top of a sell signal, on top of a sell signal.
We saw sell signals from the GDXJ-based MACD indicator too.
Speaking of the triangle on the above chart, its vertex is at the end of April, so we might see some kind of turnaround then – perhaps a volatile comeback, which is then followed by another – even bigger – slide.
All of the above remains up-to-date. I would like to add two things, though:
- The GDXJ reached its January high, which provided support – that’s normal. It might or might not mean that a short-term bottom is in. I wouldn’t say that it’s bullish at this point.
- The 2022 rally is somewhat similar to what we saw in late 2019 and early 2020. I marked it with red, dotted lines on the first GDXJ chart. The rally was a bit bigger this year (war premium would explain that) and it was a bit shorter. However, the thing that I would like to emphasize is that back in 2020, the decline didn’t end until the GDXJ erased its entire rally, and the road to the initial lows was very rapid.
So, if the analogy described in point 2 continues, we might see another huge wave down before seeing a corrective upswing.
Back in 2020, the corrective upswing was very sharp, and if we see a decline that’s very volatile beforehand, I would expect to see a similarly volatile upswing.
Can GDXJ really decline to $37 within a week? That seems unlikely at first, but when one considers that it was trading above $50 about a week ago, it becomes quite possible.
Let’s take a look at gold for more insights.
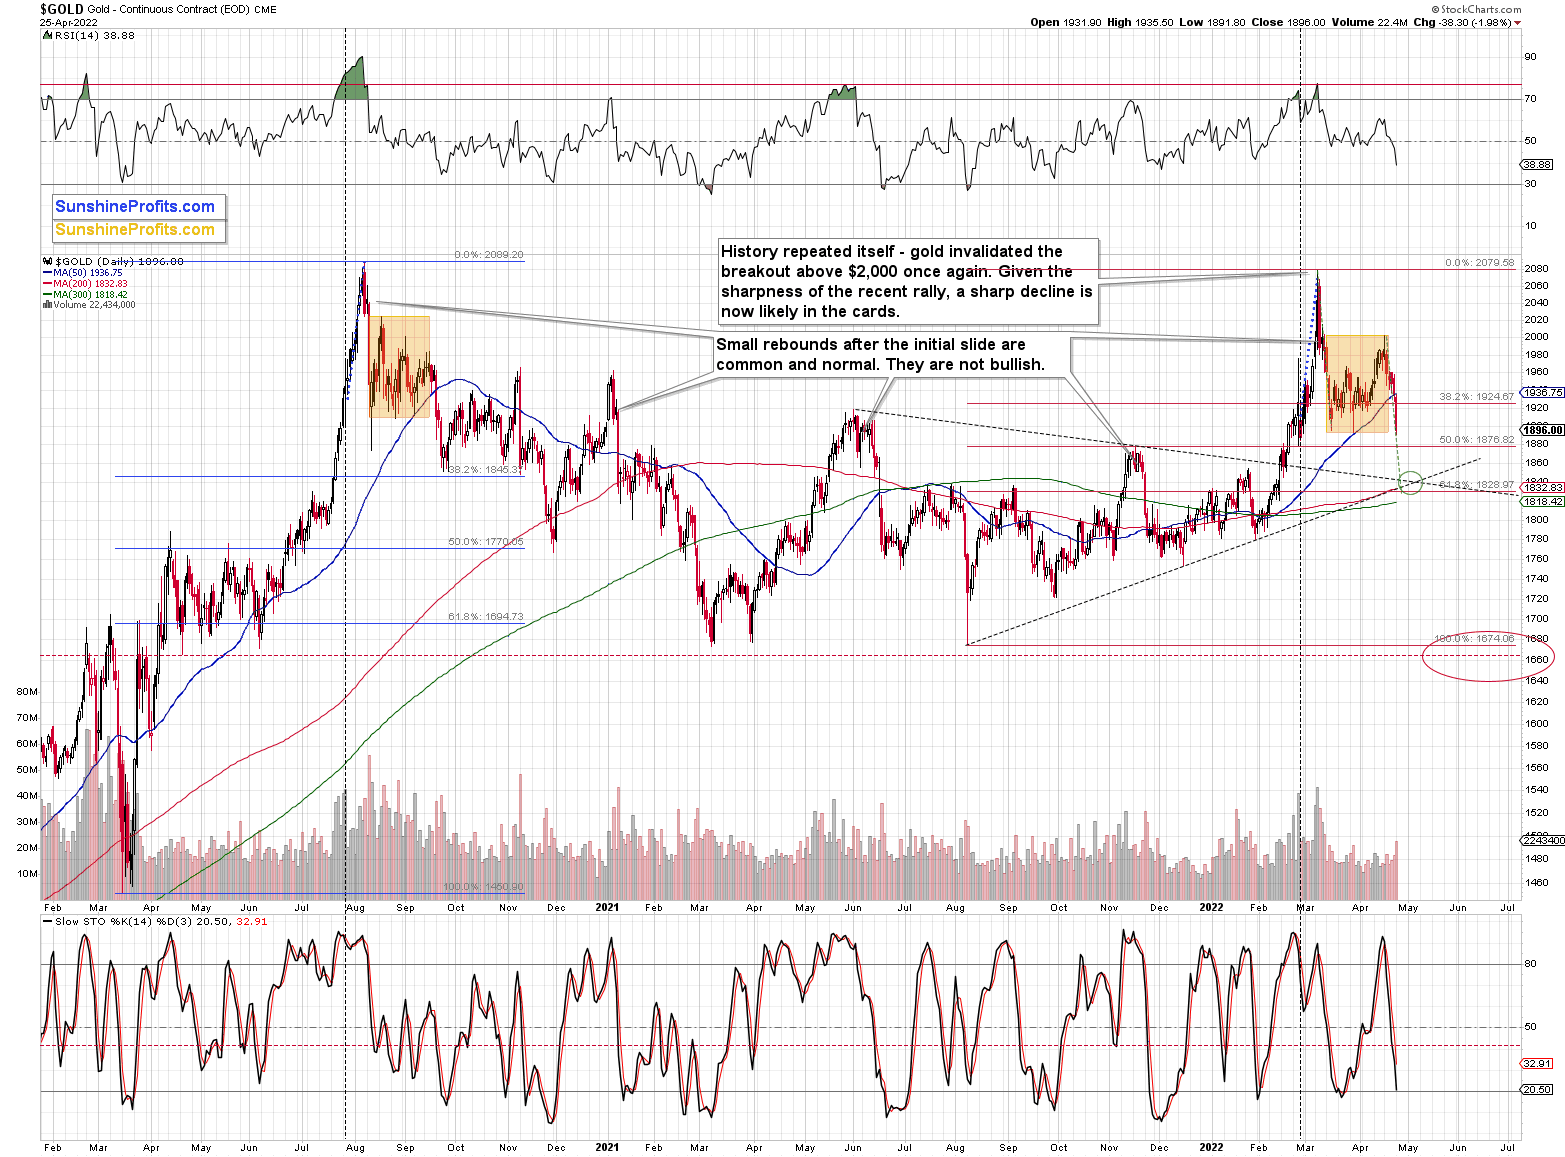
Gold has a triangle-vertex-based reversal point nearby, which confirms the analogous point in the GDXJ. They both confirm each other.
In the case of gold, please note how it followed its self-similarity to the post-2020 top trading patterns. The yellow metal moved slightly above its initial post-top bottom, and then it immediately turned south.
The support lines cross at about $1,845, so that’s where we might see the next short-term rebound, but let’s keep in mind that it’s not likely to be anything more than that – a corrective rebound that is then followed by another move lower.
The ~$1,845 target is additionally supported by the markets’ tendency to repeat the move that took place before a given consolidation. In this case, a decline preceded the consolidation (marked in orange), so the consolidation is likely to be followed by one too.
In addition, this is what we saw in 2020, after the analogous top. I also marked the previous consolidation with an orange rectangle, and, as you can see, the move that preceded the consolidation was similar to the one that followed it.
In the current situation, the above supports the move to about $1,840, which is in perfect tune with the above-mentioned short-term target.
So, if gold declines to $1,845 (which appears likely), GDXJ is likely to decline as well.
However, will it decline all the way down to $37 or so?
This might depend on the stock market.
Back in 2020 and in 2008, mining stocks fell like stones in water because both gold and stocks were declining. If both gold and stocks decline, the mining stock bears simply take no prisoners.
Therefore, the question is: what about the stock market?
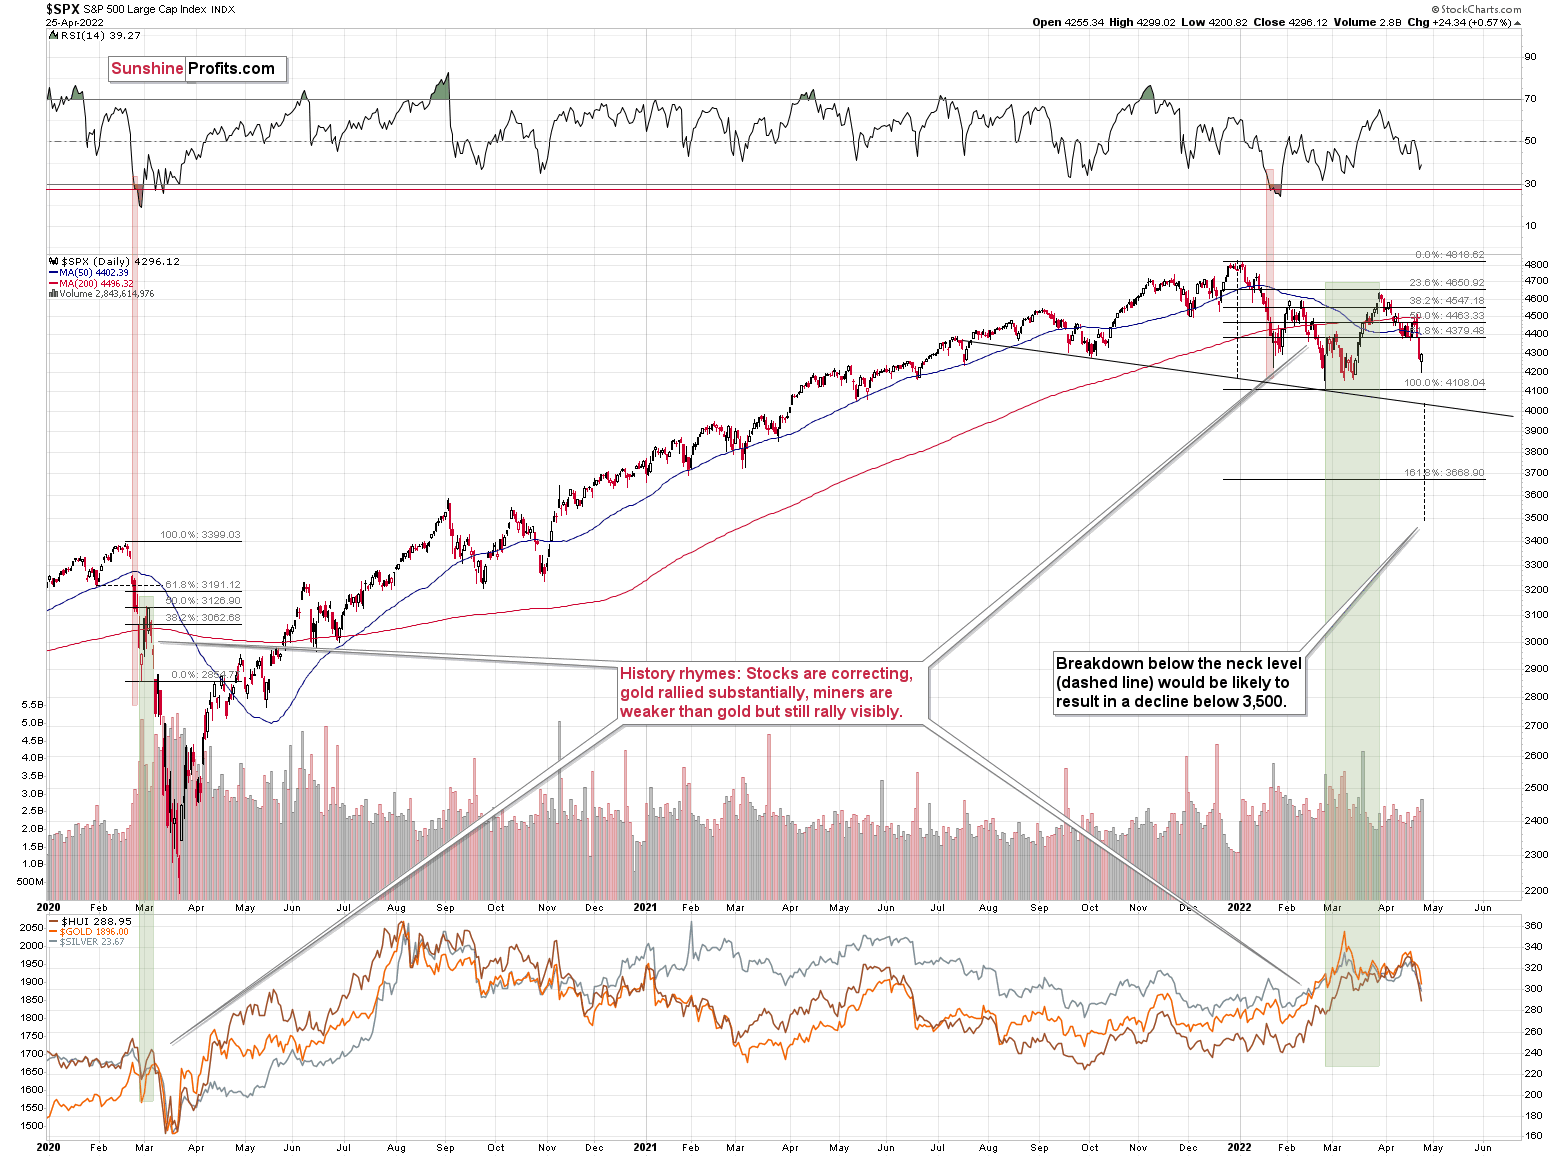
In short, the stock market reversed yesterday, which is a bullish indication. The volume that accompanied this move was sizable, which strengthens the bullish case for the very short term.
Consequently, we’re likely to see some kind of corrective upswing here, but the important thing is that it doesn’t have to be big, and it doesn’t have to last long. For example, if we see an intraday rally and then a decline (so, the opposite of yesterday’s reversals), the decline can then resume in the following part of the week.
At this time, it’s too early to tell if the above is going to take place, but if it does, then $37 will become a likely near-term target for the GDXJ.
What about silver?
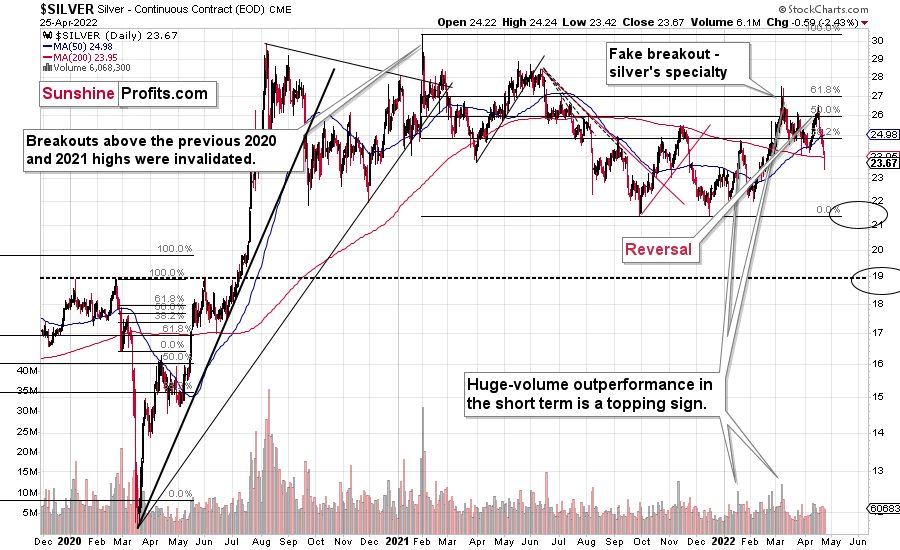
Silver declined profoundly recently, and just like miners, it invalidated multiple previous breakouts. Most interestingly, though, it now clearly invalidates the breakout above its January 2022 high.
The next strong support is based on the previous lows, close to the $22 level. That’s where silver might correct before moving much lower.
Provided that stocks continue to decline, silver and miners are likely to fall even more than gold.
Let’s keep in mind what happened in the previous cases when stocks declined profoundly – in early 2020 and in 2008. Miners and silver declined in a truly epic manner, and yes, the same is likely to take place in the following months, as markets wake up to the reality, which is that the USD Index and real interest rates are going up.
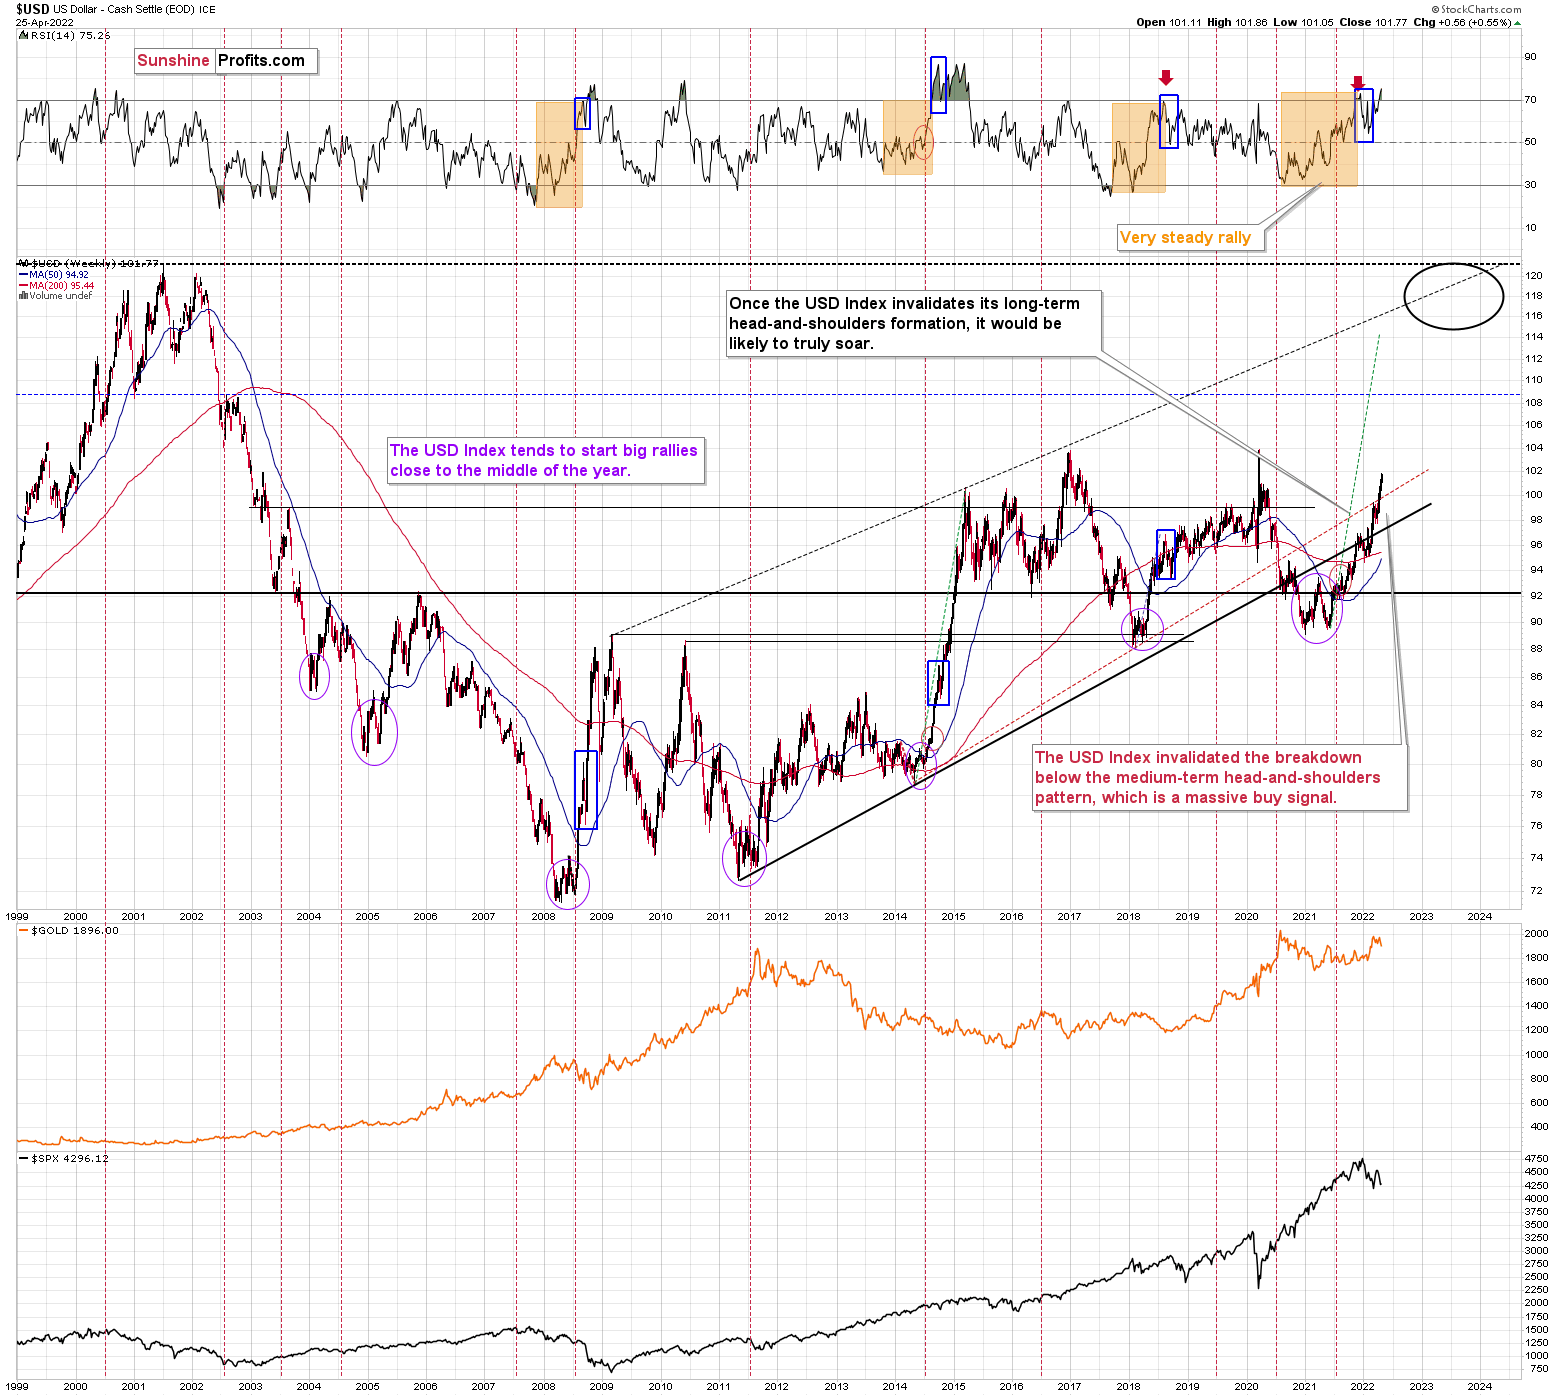
Speaking of the USD Index, after invalidating the breakout below the multi-year head-and-shoulders pattern, the USDX is poised to soar, just like I’ve been expecting it to do for more than a year.
The RSI is above 70, but since the USDX is in a medium-term rally and is already after a visible correction, it can rally further. Please note that we saw the same thing in 2008 and in 2014. I marked the corrections with blue rectangles.
The next strong resistance is at the previous highs – close to the 104 level.
It doesn’t mean that the USD Index’s rally is likely to end there. It’s not – but the USDX could take a breather when it reaches 104. Then, after many investors think that the top has been reached as the USDX corrects, the big rally is likely to continue.
All in all, the technical picture for mining stocks is extremely bearish for the following months, even though we might see a short-term correction close to the end of April.
Do I plan to trade this correction? It depends on how likely it is and where the prices of gold, silver, and mining stocks are. If they are close to relatively strong support levels while gold and miners are at their reversal points, I might indeed temporarily get out of the short positions. Of course, I’ll keep you informed.
Having said that, let’s take a look at the markets from a more fundamental point of view.
You Can’t Run From Reality
While investors’ optimism suffers a death by a thousand cuts, I’ve warned on numerous occasions that old habits die hard. As a result, while the financial markets teetered near a breaking point on Apr. 25, the ‘buy the dip’ crowd swooped in and pushed the S&P 500 higher. In the process, the GDXJ ETF also closed off its lows.
However, the lessons investors learned after the global financial crisis (GFC) should be their undoing this time around. To explain, investors buy the dip in hopes that the Fed will come to their rescue. With the strategy making money more often than not since the GFC, why not continue the charade?
Well, the reality is that optimism is contagious. Therefore, when the S&P 500 refuses to die, other areas of the financial markets showcase similar resiliency. However, with higher asset prices antithetical to the Fed’s goal of taming inflation, buying dips should result in even more pain over the medium term. For context, I wrote on Apr. 6:
Please remember that the Fed needs to slow the U.S. economy to calm inflation, and rising asset prices are mutually exclusive to this goal. Therefore, officials should keep hammering the financial markets until investors finally get the message.
Moreover, with the Fed in inflation-fighting mode and reformed doves warning that the U.S. economy “could teeter” as the drama unfolds, the reality is that there is no easy solution to the Fed’s problem. To calm inflation, it has to kill demand. As that occurs, investors should suffer a severe crisis of confidence.
Thus, with the optimistic close on Apr. 25 only reinforcing the thesis, investors don’t realize that they’re digging their own graves.
Please see below:
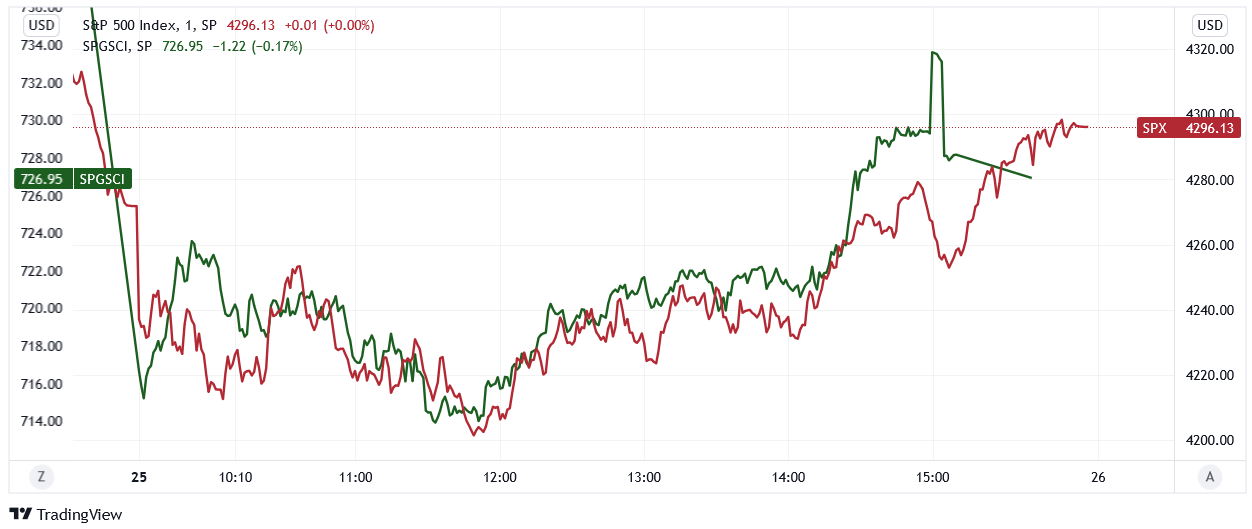
To explain, the red line above tracks the one-minute movement of the S&P 500, while the green line above tracks the one-minute movement of the S&P Goldman Sachs Commodity Index (S&P GSCI). If you analyze the relationship, you can see that both sank at the open, bottomed mid-day, then rallied off of the lows.
However, the important point is that the Fed needs the S&P GSCI to decline to curb inflation. Therefore, when the index says to the S&P 500, “I go where you go,” buying the dip only encourages more hawkish actions from the Fed.
Remember, post-GFC was a period of relatively low inflation and outperformance by technology stocks. As a result, the Fed would be happy to replicate that environment once again. However, with commodities unwilling to decline materially unless the S&P 500 and the NASDAQ Composite follow suit, the more the latter rally, the more inflation remains. As such, investors’ inability to see the forest through the trees should cause them plenty of pain over the next few months.
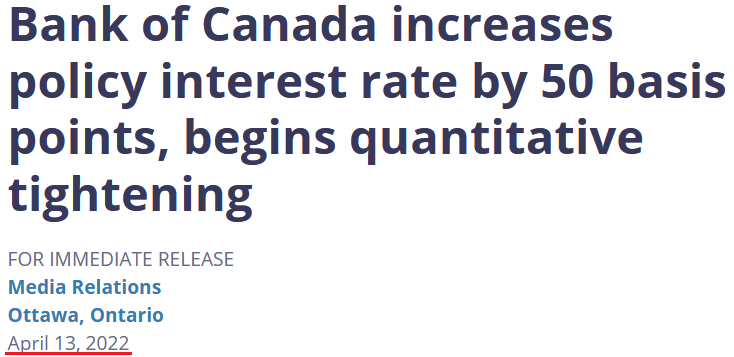
To that point, I warned previously that Canada is the hawkish canary in the coal mine. With more than 76% of Canadian exports sent to the U.S. in February, the two economies are increasingly intertwined. Moreover, I noted on Apr. 14 and updated on Apr. 22 how the Bank of Canada (BoC) announced a jumbo rate hike and that Canadian inflation is still raging. I wrote:
The BoC announced a 50 basis point rate hike on Apr. 13, and with the Fed likely to follow suit in May, the domestic fundamental environment confronting the PMs couldn’t be more bearish.
Please see below:
 Source: BoC
Moreover, BoC Governor Tiff Macklem (Canada's Jerome Powell) said: "We are committed to using our policy interest rate to return inflation to target and will do so forcefully if needed."
Furthermore, while he added that the BoC could "pause our tightening" if inflation subsides, he cautioned that "we may need to take rates modestly above neutral for a period to bring demand and supply back into balance and inflation back to target."
However, with the latter much more likely than the former, the BoC's decision is likely a preview of what the Fed should deliver in the months ahead.
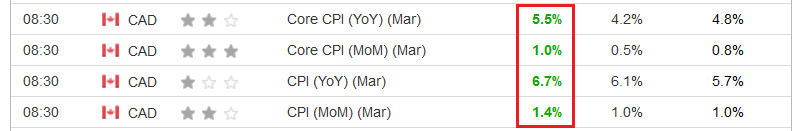
To that point, Canadian inflation data was released on Apr. 20, and, surprise, surprise, the scorching results came in hotter than expected. For context, the figures in the middle column represent economists’ consensus estimates.
Please see below:
 Source: Investing.com
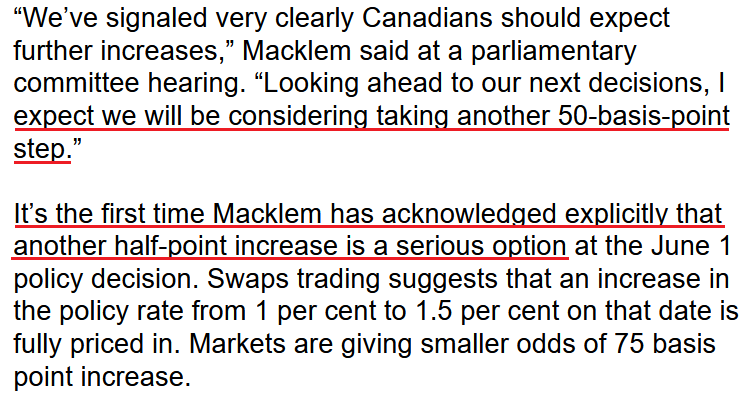
Furthermore, after admitting that the first 50 basis point rate hike in 20 years was an “unusual step,” Macklem said on Apr. 25 that investors should expect more of the same in the coming months.
Please see below:
 Source: Bloomberg
Again, the Canadian economy is highly leveraged to U.S. economic growth. Therefore, with Macklem increasingly willing to fire a second 50 basis point bullet, the Fed shouldn’t be far behind.
Likewise, Canadian headline inflation hit 6.7% year-over-year (YoY) in March, while the U.S. stands at 8.6%. Thus, with the buy the dippers making Macklem and Fed Chairman Jerome Powel’s jobs even more difficult, don’t be surprised if they drop the hawkish hammer over the medium term.
In addition, while Bank of America notes that the “Hike Brigade” has already staged an offensive, the ramifications of evaporating liquidity are far from priced in.
Please see below:
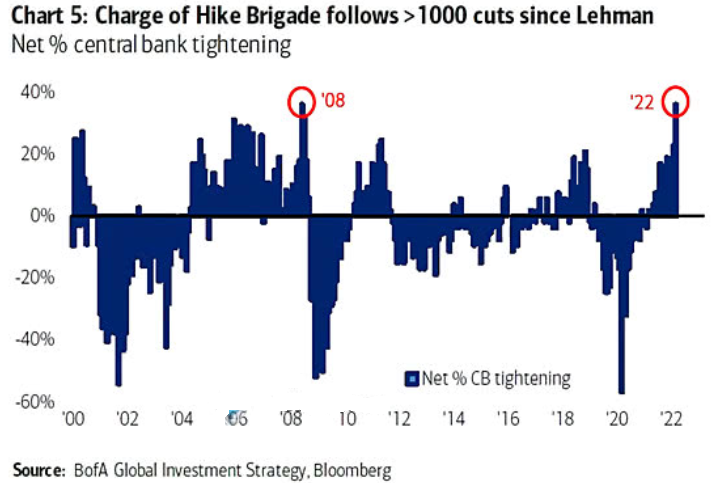
To explain, the blue bars above track the net percentage of global central banks tightening monetary policy. If you analyze the two red circles above, you can see that the current state of play rivals the lead-up to the GFC. Moreover, the Fed has barely even started its hiking cycle, and if investors keep buying the dip, the BoC may be talking about a third 50 basis point rate hike. As a result, the domestic fundamental environment is profoundly bearish for the PMs.
Furthermore, while Fed officials have warned about the potential “collateral damage” from their war with inflation, I warned on Apr. 6 that recessionary winds should gain steam in the coming months. I wrote:
Does a U.S. economy that “could teeter” sound bullish for the S&P 500 or the PMs? Moreover, while [Daly’s] relatively optimistic assessment assumes that a recession is unlikely, the data suggests otherwise. With annualized inflation at ~8% and the latest PMI and rental market data signaling even more price increases in March, plenty of demand destruction needs to unfold to reduce inflation to normalized levels.
Expecting just that, the Federal National Mortgage Association (Fannie Mae) – a U.S. government-sponsored enterprise – released its Economic and Housing Outlook report on Apr. 19. An excerpt reads:
“Our updated forecast includes an expectation of a modest recession in the latter half of 2023 (…).”
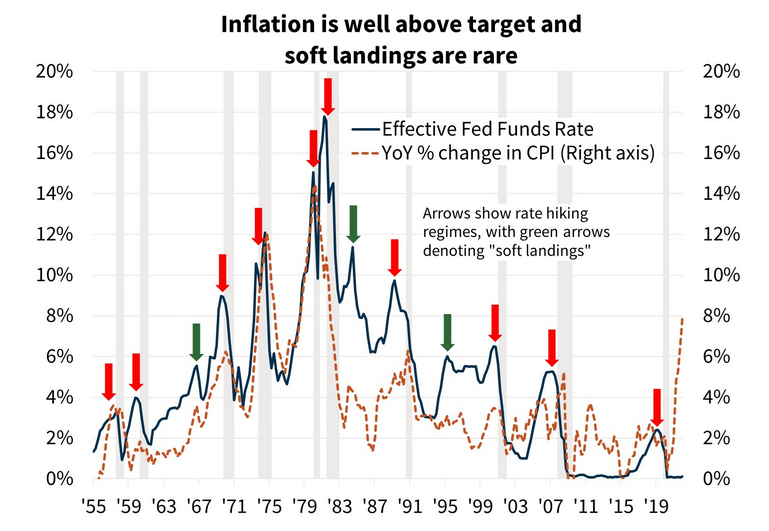
“While a ‘soft landing’ for the economy is possible, which is where inflation subsides without economic contraction, historically such an outcome is an exception, not the norm. With the most recent inflation readings at levels not seen since the early 1980s and wage growth exceeding that which is consistent with a 2-percent inflation objective, we believe the odds of a soft landing are even lower.”
Please see below:
 Source: Fannie Mae
To explain, the green line above tracks the U.S. federal funds rate, while the dashed brown line above tracks the YoY percentage change in the headline Consumer Price Index (CPI). More importantly, the red arrows above depict hard landings, while the green arrows above depict soft landings. As such, the odds are not in the Fed’s favor.
Even more revealing, if you analyze the green arrows near 67, 83, and 95, you can see that the YoY inflation (the dotted brown line) was no more than ~4.5%. As a result, all of the soft landings occurred alongside manageable inflation, not a headline CPI of 8.6%.
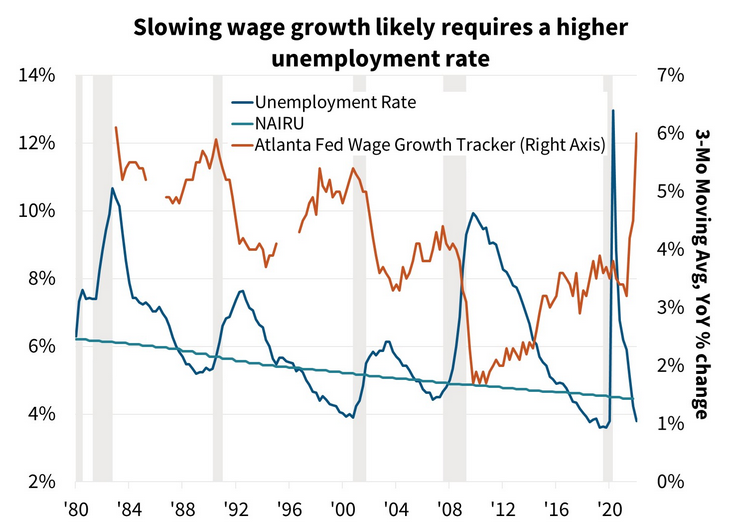
On top of that, with the Fed letting the U.S. labor market run too hot for too long – as evidenced by the nearly five million more job openings than unemployed – the Fed needs to increase the unemployment rate to curb wage inflation. Moreover, with the blue line below (unemployment) near an all-time low and the brown line below (wage inflation) at/near an all-time high, does a reversal of fortunes sound like fun for the U.S. economy?
Fannie Mae analysts stated:
“The unemployment rate is below the ‘full employment’ level, inflation is accelerating as growth slows, and the Federal Reserve is beginning to tighten policy. These conditions typically mark the beginning of the end of an economic expansion.”
 Source: Fannie Mae
The bottom line? While investors remain all-in on the post-GFC playbook, the reality is that this time is different. Before, the Fed could bow down to the financial markets without impacting the real economy. Now, inflation is raging, and the Fed can’t run from this reality. Not only will the economic consequences worsen the longer the Fed waits, but I’ve noted the political ramifications on numerous occasions. As a result, plenty of hawkish fireworks should erupt over the medium term.
In conclusion, the PMs declined on Apr. 25, as fundamental realities stifled sentiment. Unless the Fed performs the most reckless dovish pivot of all-time (highly unlikely), the PMs should suffer profound drawdowns over the next few months.
Overview of the Upcoming Part of the Decline
- It seems to me that the post-decline consolidation is now over or very close to being over , and that gold, silver, and mining stocks are now likely to continue their medium-term decline.
- It seems that the first (bigger) stop for gold will be close to its previous 2021 lows, slightly below $1,800 . Then it will likely correct a bit, but it’s unclear if I want to exit or reverse the current short position based on that – it depends on the number and the nature of the bullish indications that we get at that time.
- After the above-mentioned correction, we’re likely to see a powerful slide, perhaps close to the 2020 low ($1,450 - $1,500).
- If we see a situation where miners slide in a meaningful and volatile way while silver doesn’t (it just declines moderately), I plan to – once again – switch from short positions in miners to short positions in silver. At this time, it’s too early to say at what price levels this could take place, and if we get this kind of opportunity at all – perhaps with gold close to $1,600.
- I plan to exit all remaining short positions once gold shows substantial strength relative to the USD Index while the latter is still rallying. This may be the case with gold close to $1,350 - $1,400. I expect silver to fall the hardest in the final part of the move. This moment (when gold performs very strongly against the rallying USD and miners are strong relative to gold after its substantial decline) is likely to be the best entry point for long-term investments, in my view. This can also happen with gold close to $1,375, but at the moment it’s too early to say with certainty.
- As a confirmation for the above, I will use the (upcoming or perhaps we have already seen it?) top in the general stock market as the starting point for the three-month countdown. The reason is that after the 1929 top, gold miners declined for about three months after the general stock market started to slide. We also saw some confirmations of this theory based on the analogy to 2008. All in all, the precious metals sector is likely to bottom about three months after the general stock market tops.
- The above is based on the information available today, and it might change in the following days/weeks.
You will find my general overview of the outlook for gold on the chart below:
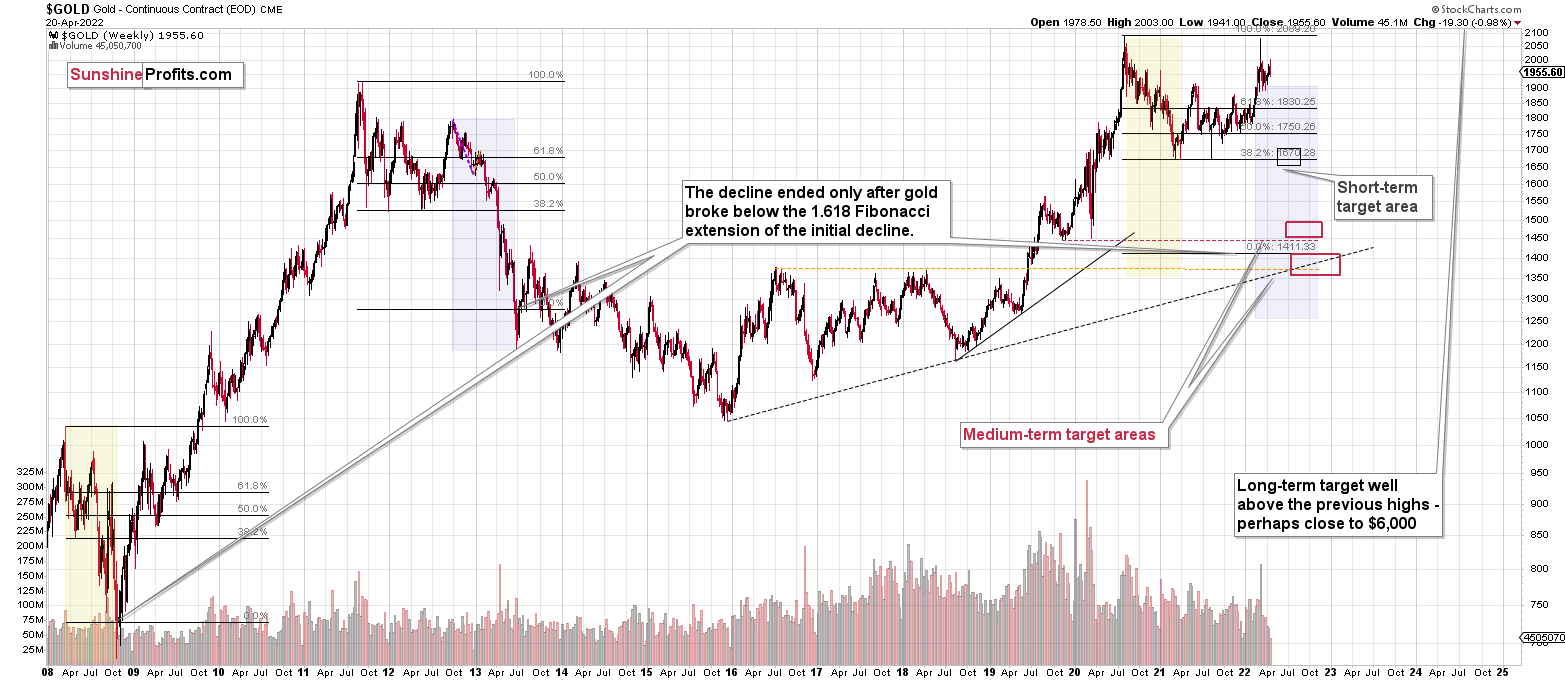
Please note that the above timing details are relatively broad and “for general overview only” – so that you know more or less what I think and how volatile I think the moves are likely to be – on an approximate basis. These time targets are not binding or clear enough for me to think that they should be used for purchasing options, warrants or similar instruments.
Summary
Summing up, despite the recent rally in gold, the outlook for junior mining stocks remains exactly as I described previously.
Investing and trading are difficult. If it was easy, most people would be making money – and they’re not. Right now, it’s most difficult to ignore the urge to trade along with the crowd that’s ignoring two critical factors:
- rising real interest rates,
- rising USD Index values.
Both of the aforementioned are the two most important fundamental drivers of the gold price. Since neither the USD Index nor real interest rates are likely to stop rising anytime soon (especially now that inflation has become highly political), the gold price is likely to fall sooner or later. Given the analogy to 2012 in gold, silver, and mining stocks, “sooner” is the more likely outcome.
It seems that our profits from short positions are going to become truly epic in the coming months.
Moreover, let’s keep in mind that we are not patient with this trade to just get out of it close to being even or with a reasonable (10%-30%) profit. Of course, I can’t promise anything, but this entire short trade is likely to end with gold below $1,500 and junior miners close to or below their 2020 lows. The upside potential for the inversely trading instruments is likely enormous. Yes, we might adjust the trade or exit it temporarily, only to get back to it shortly thereafter, but the overall potential remains gargantuan. It’s quite likely that none of those gains will be reaped by precious metals perma-bulls.
After the sell-off (that takes gold to about $1,350-$1,500), I expect the precious metals to rally significantly. The final part of the decline might take as little as 1-5 weeks, so it's important to stay alert to any changes.
As always, we'll keep you – our subscribers – informed.
To summarize:
Trading capital (supplementary part of the portfolio; our opinion): Full speculative short positions (300% of the full position) in junior mining stocks are justified from the risk to reward point of view with the following binding exit profit-take price levels:
Mining stocks (price levels for the GDXJ ETF): binding profit-take exit price: $34.63; stop-loss: none (the volatility is too big to justify a stop-loss order in case of this particular trade)
Alternatively, if one seeks leverage, we’re providing the binding profit-take levels for the JDST (2x leveraged) and GDXD (3x leveraged – which is not suggested for most traders/investors due to the significant leverage). The binding profit-take level for the JDST: $14.98; stop-loss for the JDST: none (the volatility is too big to justify a SL order in case of this particular trade); binding profit-take level for the GDXD: $25.48; stop-loss for the GDXD: none (the volatility is too big to justify a SL order in case of this particular trade).
For-your-information targets (our opinion; we continue to think that mining stocks are the preferred way of taking advantage of the upcoming price move, but if for whatever reason one wants / has to use silver or gold for this trade, we are providing the details anyway.):
Silver futures downside profit-take exit price: $19.12
SLV profit-take exit price: $17.72
ZSL profit-take exit price: $38.28
Gold futures downside profit-take exit price: $1,683
HGD.TO – alternative (Canadian) inverse 2x leveraged gold stocks ETF – the upside profit-take exit price: $11.79
HZD.TO – alternative (Canadian) inverse 2x leveraged silver ETF – the upside profit-take exit price: $29.48
Long-term capital (core part of the portfolio; our opinion): No positions (in other words: cash
Insurance capital (core part of the portfolio; our opinion): Full position
Whether you already subscribed or not, we encourage you to find out how to make the most of our alerts and read our replies to the most common alert-and-gold-trading-related-questions.
Please note that we describe the situation for the day that the alert is posted in the trading section. In other words, if we are writing about a speculative position, it means that it is up-to-date on the day it was posted. We are also featuring the initial target prices to decide whether keeping a position on a given day is in tune with your approach (some moves are too small for medium-term traders, and some might appear too big for day-traders).
Additionally, you might want to read why our stop-loss orders are usually relatively far from the current price.
Please note that a full position doesn't mean using all of the capital for a given trade. You will find details on our thoughts on gold portfolio structuring in the Key Insights section on our website.
As a reminder - "initial target price" means exactly that - an "initial" one. It's not a price level at which we suggest closing positions. If this becomes the case (like it did in the previous trade), we will refer to these levels as levels of exit orders (exactly as we've done previously). Stop-loss levels, however, are naturally not "initial", but something that, in our opinion, might be entered as an order.
Since it is impossible to synchronize target prices and stop-loss levels for all the ETFs and ETNs with the main markets that we provide these levels for (gold, silver and mining stocks - the GDX ETF), the stop-loss levels and target prices for other ETNs and ETF (among other: UGL, GLL, AGQ, ZSL, NUGT, DUST, JNUG, JDST) are provided as supplementary, and not as "final". This means that if a stop-loss or a target level is reached for any of the "additional instruments" (GLL for instance), but not for the "main instrument" (gold in this case), we will view positions in both gold and GLL as still open and the stop-loss for GLL would have to be moved lower. On the other hand, if gold moves to a stop-loss level but GLL doesn't, then we will view both positions (in gold and GLL) as closed. In other words, since it's not possible to be 100% certain that each related instrument moves to a given level when the underlying instrument does, we can't provide levels that would be binding. The levels that we do provide are our best estimate of the levels that will correspond to the levels in the underlying assets, but it will be the underlying assets that one will need to focus on regarding the signs pointing to closing a given position or keeping it open. We might adjust the levels in the "additional instruments" without adjusting the levels in the "main instruments", which will simply mean that we have improved our estimation of these levels, not that we changed our outlook on the markets. We are already working on a tool that would update these levels daily for the most popular ETFs, ETNs and individual mining stocks.
Our preferred ways to invest in and to trade gold along with the reasoning can be found in the how to buy gold section. Furthermore, our preferred ETFs and ETNs can be found in our Gold & Silver ETF Ranking.
As a reminder, Gold & Silver Trading Alerts are posted before or on each trading day (we usually post them before the opening bell, but we don't promise doing that each day). If there's anything urgent, we will send you an additional small alert before posting the main one.
Thank you.
Przemyslaw Radomski, CFA
Founder, Editor-in-chief

