

Briefly: in our opinion, full (300% of the regular position size) speculative short positions in junior mining stocks are justified from the risk/reward point of view at the moment of publishing this Alert.
Very little changed yesterday on the technical front, so once again, let’s start today’s discussion with the fundamentals.
Buyer Beware
While gold continues to ride the bullish wave of geopolitical tensions, confusion has arisen over whether Russia’s financial woes will support or hurt the yellow metal. For context, I wrote on Feb. 28:
Even if the recent escalation uplifts gold in the short term, the fundamental implications of Russia’s financial plight support lower gold prices over the medium term.
Please see below:
To explain, with Russia essentially blacklisted from many influential FX counterparties, the Russian ruble relative to the U.S. dollar was exchanged for a roughly 50% discount on Feb. 27. As a result, Russian's purchasing power is nearly half of what it was before Sunday's developments.
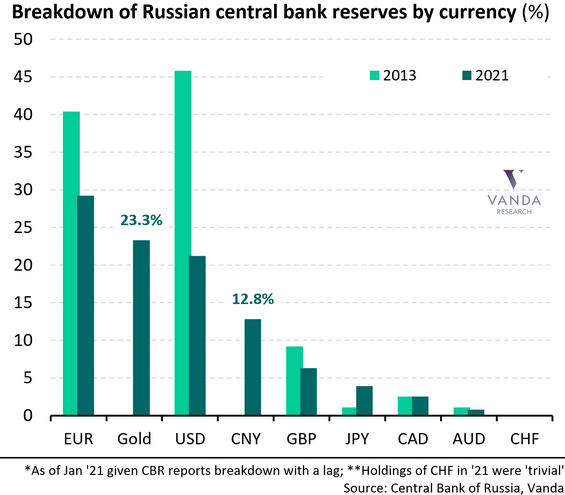
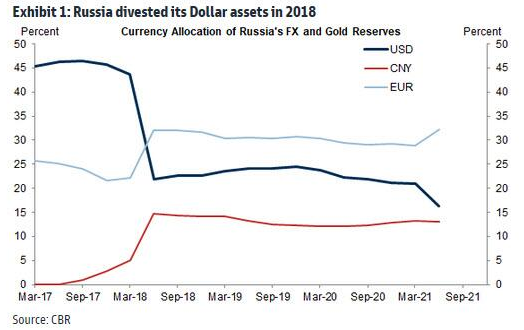
Furthermore, if you analyze the chart above, you can see that euros and U.S. dollars made up a large portion of Russia's monetary base in 2013 (the green bars on the left). Conversely, those holdings dropped dramatically in 2021 (the blue bars on the left).
In addition, if you focus your attention on the column labeled "Gold," you can see that FX has been swapped for gold, and the yellow metal accounts for roughly 23% of Russia's monetary base. Now, with the impaired state of the ruble offering little financial reprieve, Russia may have to sell its gold reserves to alleviate the pressure from NATO's economic sanctions.
As a result, while war is often bullish for gold, the fundamental implications of currency devaluation mean that gold is Russia's only worthwhile asset outside of oil. Thus, with bank runs already unfolding in the region, the yellow metal could be collateral damage.
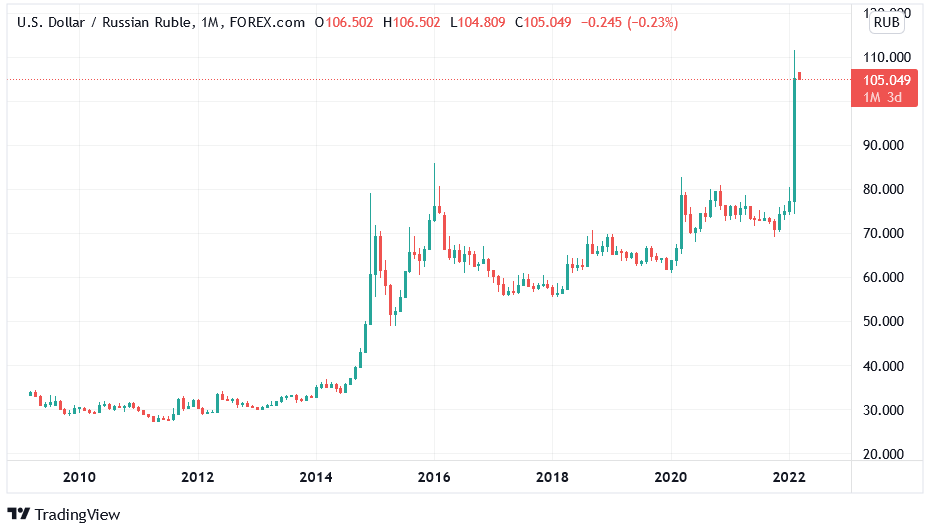
To that point, the USD/RUB closed at roughly 105 on Feb. 28. As a result, it costs 105 Russian rubles to obtain one U.S. dollar. With the spot gold price at around $1,900 per ounce, it costs roughly 199,500 Russian rubles to purchase an ounce of gold.
In stark contrast, the USD/RUB closed at approximately 75 on Feb. 16, which means that less than two weeks ago, it cost 142,500 Russian rubles to purchase an ounce of gold at the current price. As such, in currency-adjusted terms, the cost of an ounce of gold in Russia has increased by roughly 40% in recent days.
However, after Bloomberg posted an article on Feb. 27 titled “Bank of Russia Resumes Gold Buying After Two-Year Pause,” the revelation may have caused some anxiety about our short position (as a reminder, it’s not in gold, but in junior mining stocks). For context, an excerpt from the article read:
“The central bank will begin buying gold again on the domestic precious metals market, it said in a statement. The move comes after the monetary authority and several of the country’s commercial banks were sanctioned in response to Russia’s invasion of Ukraine.”
As a result, if Russia goes on a shopping spree for bullion, could the price skyrocket? Well, the reality is that the fundamentals don’t support the sentiment. As mentioned, the USD/RUB has surged in recent days, and the sharp decline in the value of the Russian currency is extremely bearish for the Russian economy.
Please see below:
Furthermore, while Russia may want to increase its gold reserves, it’s essential to focus on what Russia does and not what it says. For example, the Russian central bank increased its overnight lending rate from 9.5% to 20% on Feb. 28. While U.S. investors fret over a 25 basis point hike from the Fed (which, as mentioned previously, should occur in March), Russia had to increase interest rates by 10.5% to help stop the ruble’s bleeding.
Please see below:
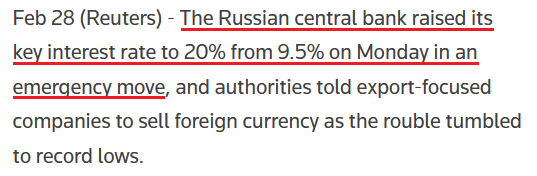 Source: Reuters
For context, higher interest rates encourage capital flows, and with the ruble in free-fall, Russia is hoping that investors will buy the currency, invest in Russian bonds, and potentially earn a 20% return. Moreover, if the currency rallies during the holding period, the carry trade would be highly lucrative for an institution willing to incur the risk.
However, the story is only sanguine in theory. In reality, though, crippling sanctions from NATO and private companies divesting their Russian assets mean that buying the ruble and other Russian securities requires a gambler’s mentality. For example, Viraj Patel, FX and Macro Strategist at Vanda Research, summed up the dynamic in a few simple words on Feb. 28:
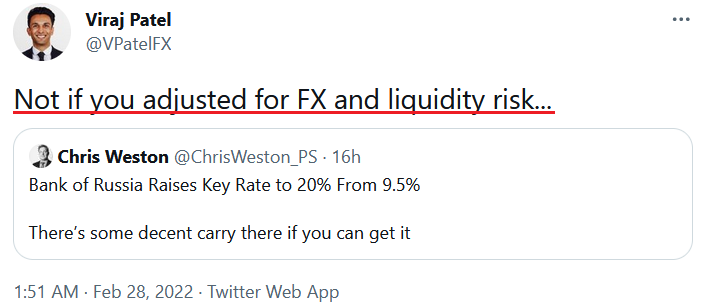 Source: Viraj Patel Twitter
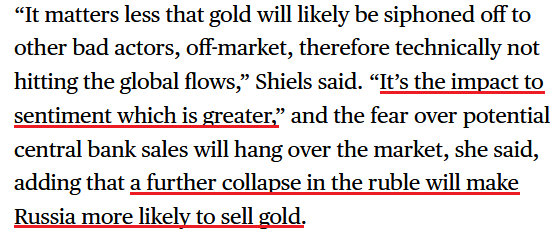
Thus, while Russia may claim it's buying gold, and who knows, maybe it will, the financial destruction plaguing the region will likely make Russia a net-seller over the medium term. To that point, if we circle back to the Bloomberg article referenced above, Nicky Shiels, head of metals strategy at MKS PAMP SA, said in the same piece that investors would interpret the actions as short-term bullish.
However, aligning with our expectations, she noted that investors have misjudged the medium-term impact of Russia's currency crisis.
Please see below:
 Source: Bloomberg
As a result, that’s why I wrote on Feb. 28 that while volatility may be the name of the game this week as investors struggle to digest the implications, the geopolitical risk premium that often supports gold may prove counterintuitive this time around.
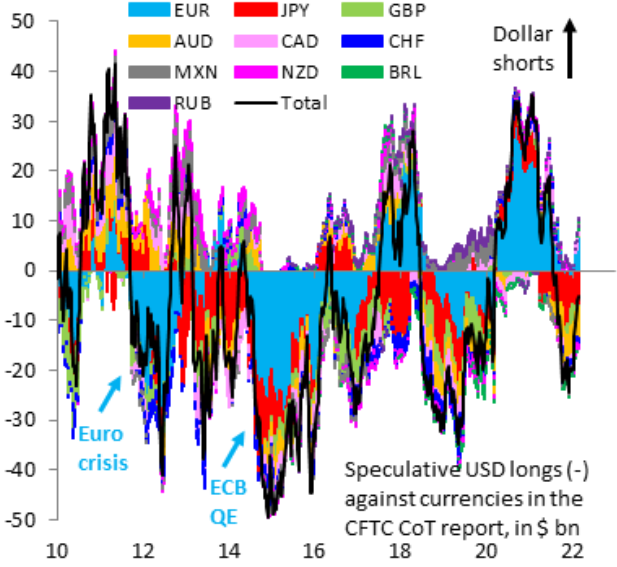
Furthermore, we shouldn't ignore the potential impact on the USD Index. For example, while the dollar basket defied expectations and rose materially in 2021, the momentum continued in 2022. However, after a sharp rally in January, investors repositioned their bets, and euro longs were in style once again. However, with the risk-on trade now disrupted by the Russia-Ukraine conflict, more downside for the euro implies more upside for the USD Index.
Please see below:
 Source: Institute of International Finance (IIF)/Robin Brooks
To explain, the color blocks above track the non-commercial (speculative) futures positioning for various currencies versus the U.S. dollar, while the black line above tracks the consolidated total. If you analyze the right side of the chart, you can see that the black line has moved higher recently, which signals fewer U.S. dollar long positions.
More importantly, though, if you focus your attention on the light blue blocks on the right side of the chart, you can see that speculative euro longs have increased and remain in positive territory. However, with the economic impact of the Russia-Ukraine conflict much more troublesome for the Eurozone than the U.S., speculative EUR/USD positioning still has plenty of room to move lower.
To that point, Mark Sobel, Senior Advisor at the Center for Strategic and International Studies (CSIS), wrote on Feb. 28 that “the overall impact of Russia’s actions on the U.S. economy may not be significant, assuming oil prices don’t soar, though that remains a significant risk.”
“The challenges for the ECB will be much greater in its debates over balancing the stagflationary consequences of the Russian invasion. Europe is a large net energy importer and remains dependent on Russia for oil and natural gas.”
As a result:
“European Central Bank President Christine Lagarde will feel the strain more than Federal Reserve Chair Jerome Powell. Higher oil prices will boost inflation, weaken growth prospects and stoke stagflation fears.”
Furthermore, if you analyze the right side of the chart below, you can see that Russia’s monetary base includes more euros (the light blue line) than U.S. dollars (the dark blue line). As a result, if Russia swaps its other FX holdings for rubles (to help stop the decline), the euro has more downside risk than the greenback.
The bottom line? While Russia may put on a brave face and claim that gold purchases are on the horizon, the reality is that its materially weak financial position requires more attention to more pressing matters. With bank runs and a currency crisis already unfolding, combined with NATO sanctions and private companies divesting their Russian assets, the country’s leaders need to stem the tide before a depression unfolds.
As a result, Russia’s oil revenues and the securities it can monetize are more likely to be used to support the Russian economy, rather than to buy gold. Thus, while the yellow metal has enjoyed short-term sentiment high (and so did the silver price), the fundamentals imply a much different outcome over the medium term.
In conclusion, the PMs were mixed on Feb. 28, as the GDX ETF ended the session roughly flat. However, the recent rallies are far from troublesome. For example, I noted previously how gold rallied following the 2001 terrorist attacks and after Russia annexed Crimea in 2014. However, those gains were short-lived, and the latter resulted in lower lows in the months that followed. As a result, while the recent volatility will likely continue, it doesn’t change the bearish medium-term thesis.
Having said that, let’s take a look at what the charts are suggesting.
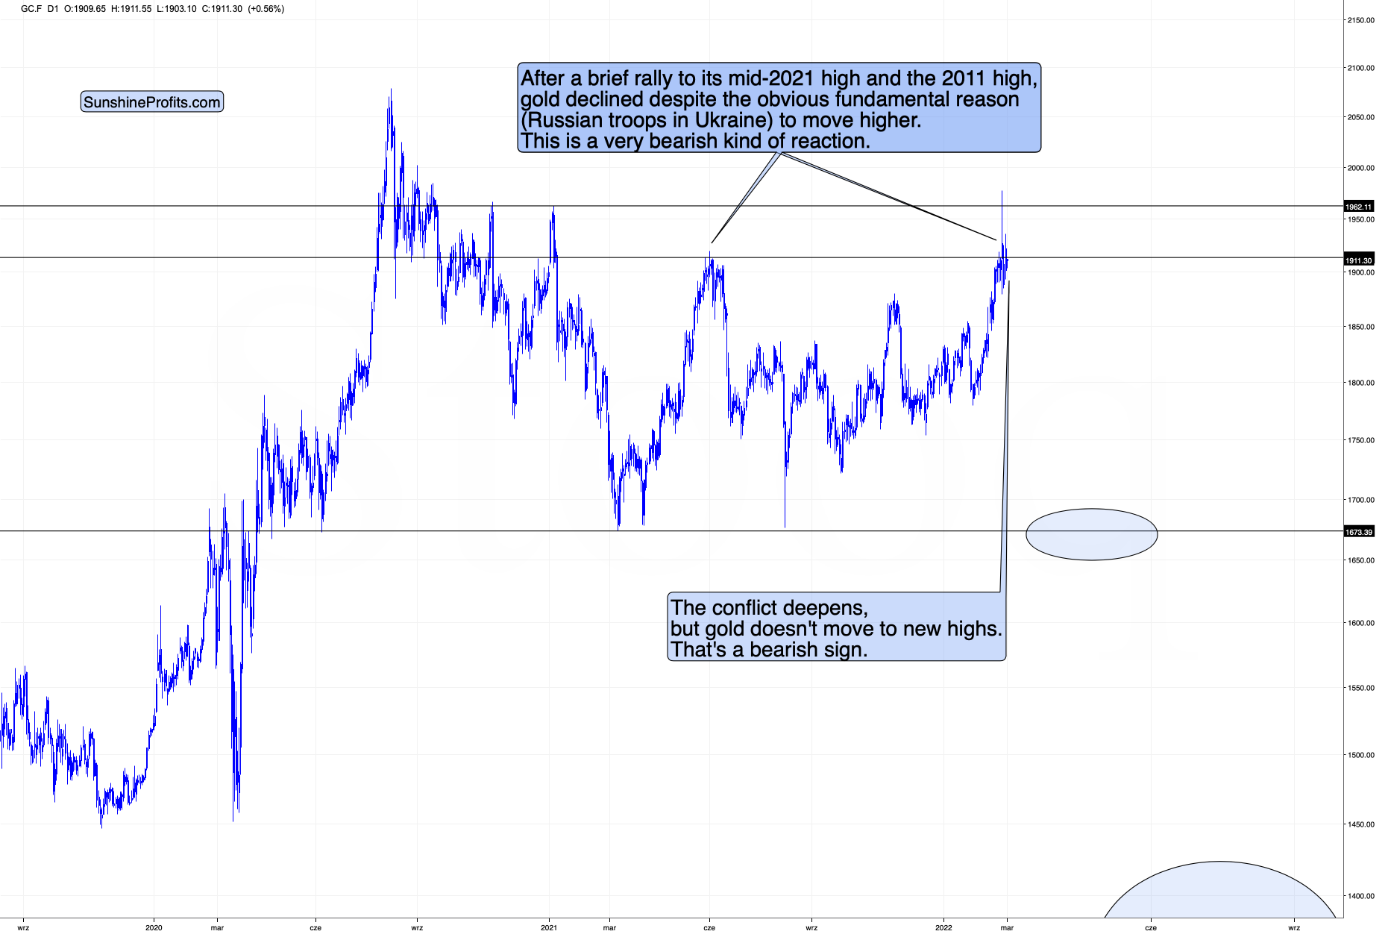
Gold moved higher by just a little in the last 24 hours, and therefore, my comments about peak-concern and thus peak-gold-price being behind us remain up-to-date:
There’s no doubt the situation in Ukraine got worse over the weekend, and the same goes for the sanctions and other reactions to Russia’s aggression. And yet, despite gold’s very initial rally, it then moved back down and is currently (at the moment of writing these words) trading back below $1,900. [Now it’s slightly above $1,900, but still well below its recent high.]
Gold was trading above $1,970 last week when the concern and uncertainty were at the maximum. That’s when I wrote that even if things get worse, the peak concern might be behind us, and the same was likely for gold prices. That was based on the analogy to previous times when troops of one country entered into another country. And the history appears to be rhyming once again.
Even though the conflict escalates, gold is not rallying, but rather topping. Today’s inability for gold to soar decisively above $1,900 and stay there is a meaningful confirmation of the bearish case.
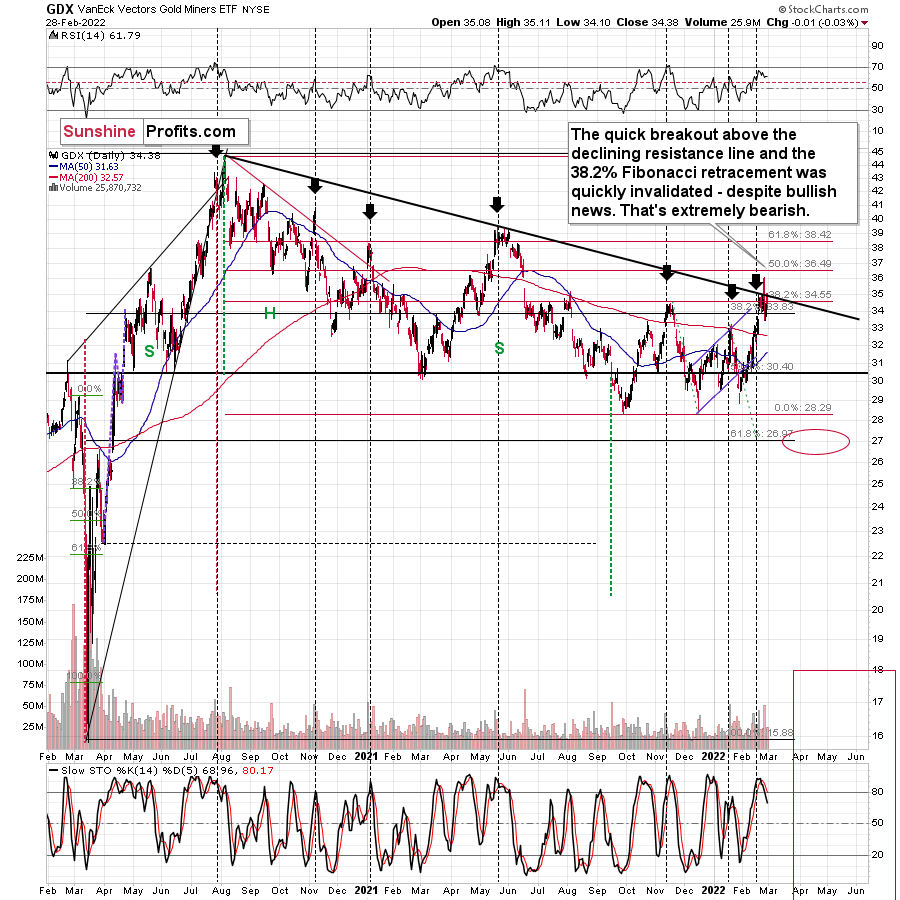
Gold miners moved a bit (less than 1%) higher on Friday and they declined by 1 cent on Monday, and these moves were not game-changers. That was very much in tune with how GDX topped in the previous cases. For instance, the mid-2021 top was not a one-day event, but rather several days of back-and-forth trading that then resulted in a big price decline, anyway.
On Friday and on Monday, the GDX ETF closed the day below the declining black resistance line, which means that technically, not much has changed since the invalidation of the previous attempt to break higher. In other words, gold miners are still likely to fall significantly due to the huge-volume invalidation.
In today’s early London trading, the GDXJ ETF (proxy for junior miners) remains below the declining resistance line and below the January high.
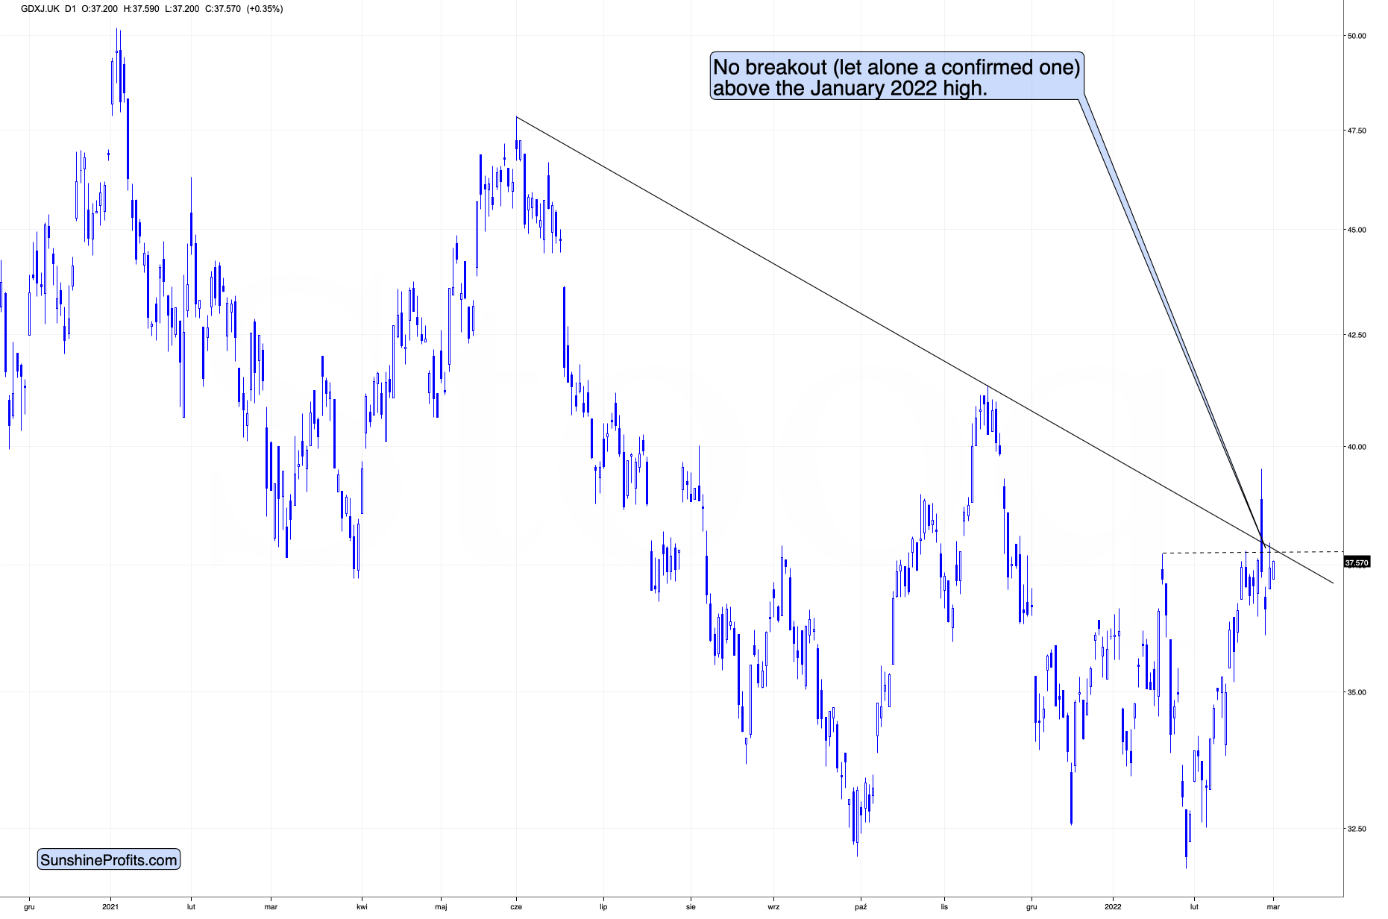
Therefore, the bearish implications of the previous breakout’s invalidation remain up-to-date.
This is in perfect tune with how mining stocks performed after the military action started in 2014, before Crimea was annexed.
Consequently, what I wrote about those analogies previously (Feb. 24) remains up-to-date: (please note that I wrote the above when gold was after a huge overnight rally, at that time it was still before the reversal; the quote below is exactly what I wrote on Feb. 24, so if you’ve read that analysis, feel free to skip the part in italics.)
Third, mining stocks, especially junior mining stocks, don’t have to react just as gold does. In fact, they are not likely to, based on the analogy to what happened when Russia took over Crimea in 2014. I already wrote about that previously, and it’s worth quoting it once again:
What would happen then is that PMs would be likely to rally until the conflict actually starts, then a bit more, and then they would likely continue their medium-term decline. It already happened in 2014, when Russia took over Crimea. Interestingly, it was more or less at the same time of year. By mid-Feb, the majority of the rally was over. The entire rally in gold was about $200, and the part that continued after mid-Feb. was about $50.
Thus, considering December 2021 as the starting point of this rally, gold is up by about $150 now – so the history rhymes here.
Consequently, IF (and that’s a big if) the tensions escalate and Russia takes over a part of Ukraine once again, we might be looking at “only” an extra $50 rally in gold or so and a top in mid-March – and then the medium-term slide would be likely to continue.
When I wrote the above, gold was trading at about $1,900. It’s trading just below $1,950 at the moment of writing these words, so we now have a to-the-letter analogy to 2014. And in this analogy, the “peak concern” and “peak gold” have likely already materialized.
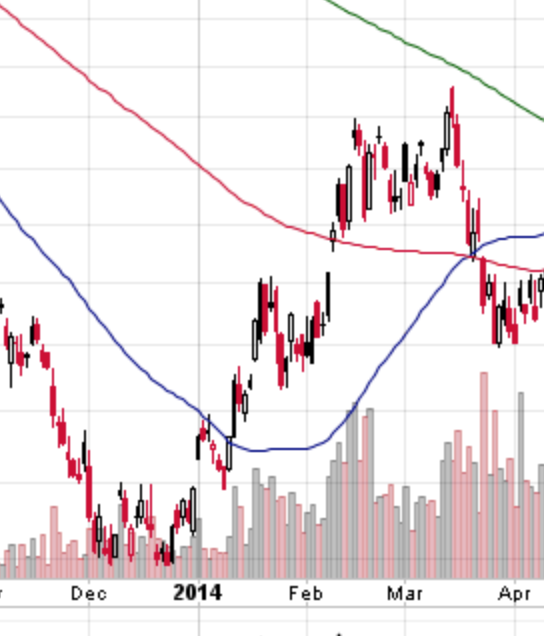
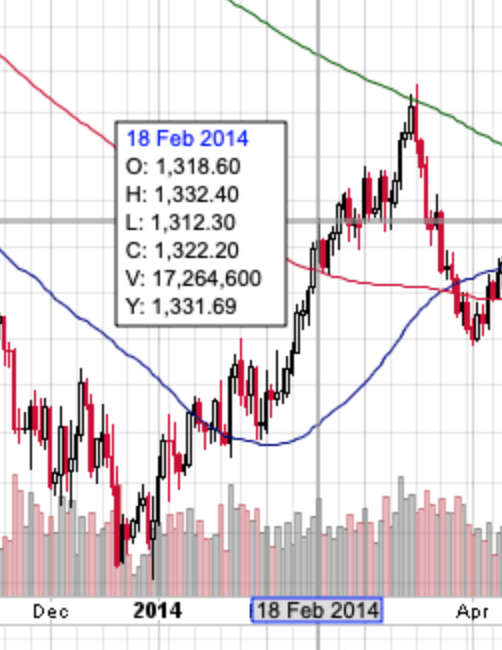
Oh, and by the way, GDXJ actually topped in mid-Feb 2014, and then it just moved back and forth until gold topped in mid-March 2014. OK, to be precise, the GDXJ’s intraday high in March was about 3% above its mid-Feb high, and it was then followed by an immediate decline.
It seems like the worst time to be exiting short positions in junior mining stocks. Instead, it might be a perfect time to be entering or adding to them (if one doesn’t have the desired exposure yet).
Well, since gold is about $200 above its late-2021 low, thus completing the analogy to 2014, let’s check if junior miners are also behaving similarly.
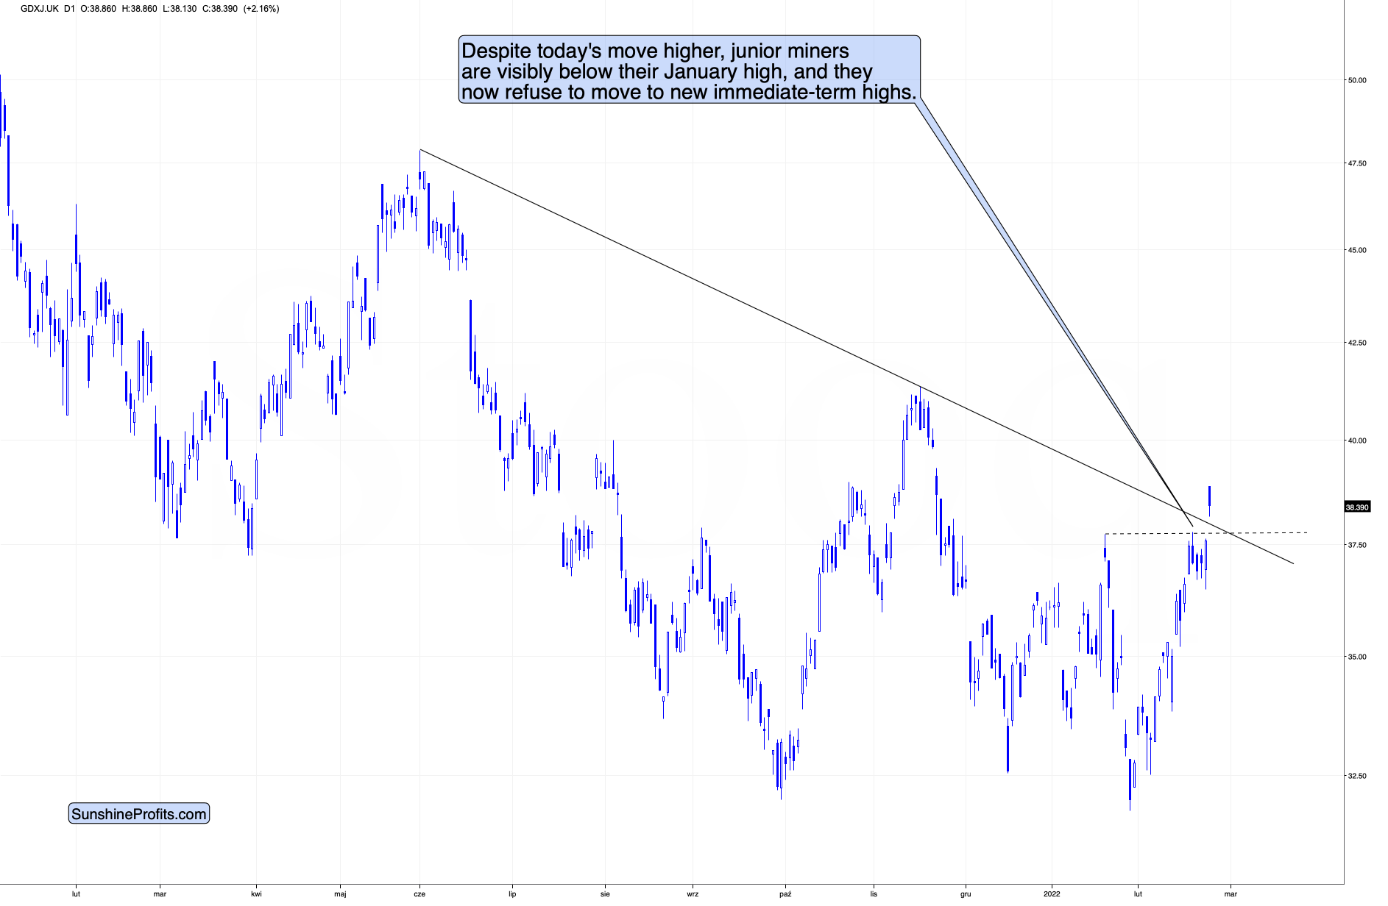
In today’s London trading, the GDXJ is up, but not very significantly so. Today’s intraday high (so far) is 38.86. The recent intraday high was 37.79. This means that today’s intraday high is 2.83% higher, which is in perfect tune with what happened in 2014.
Please note that we already saw an intraday decline, despite the higher open, which is also what accompanied the early-2014 top in the GDXJ. Of course, the session is far from being over, so this could change. It’s a weak (but present) indication, while the near-3% size of the rally above the previous highs is a strong indication that the situation is similar to what we saw in 2014. And this has bearish implications for the following weeks in case of the junior mining stocks.
And speaking of analogies to the past, let’s check what gold did when troops crossed borders in case of other relatively recent wars.
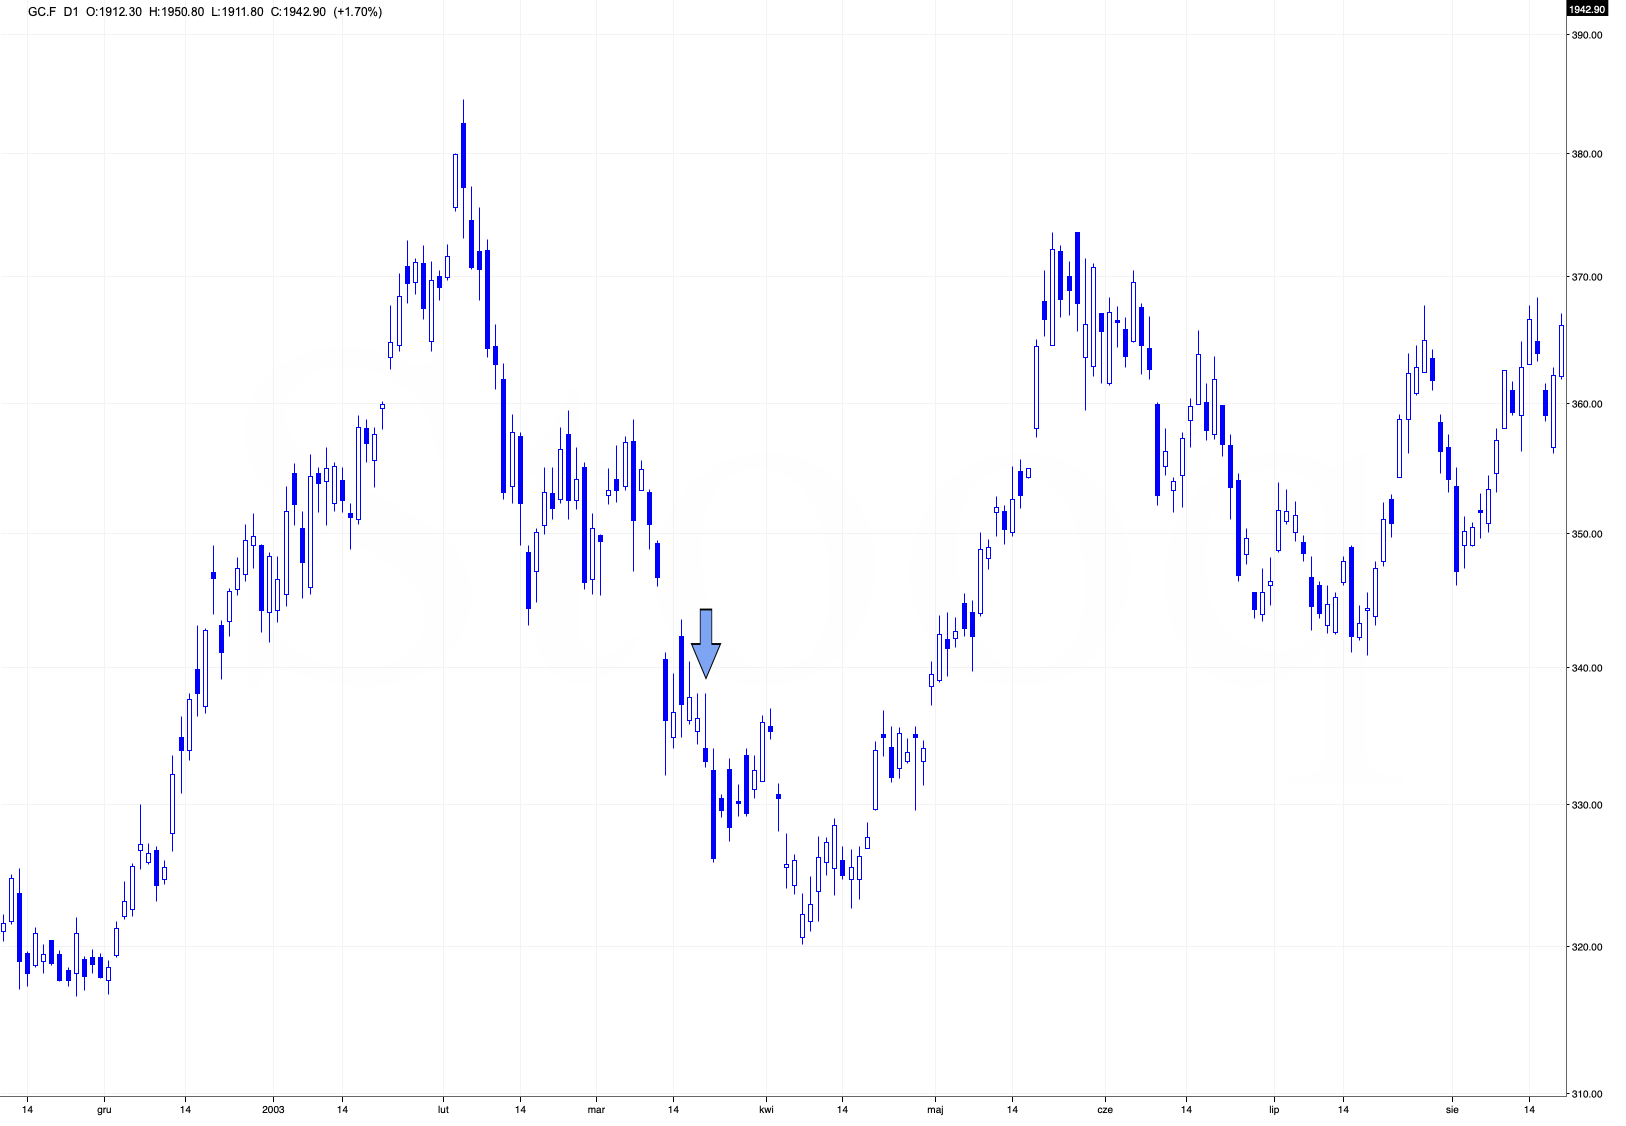
The arrow on the above chart shows what happened on the day when the U.S. – Iraq war started.
There was an intraday rally, but ultimately the start of the war itself was not a bullish factor for gold.
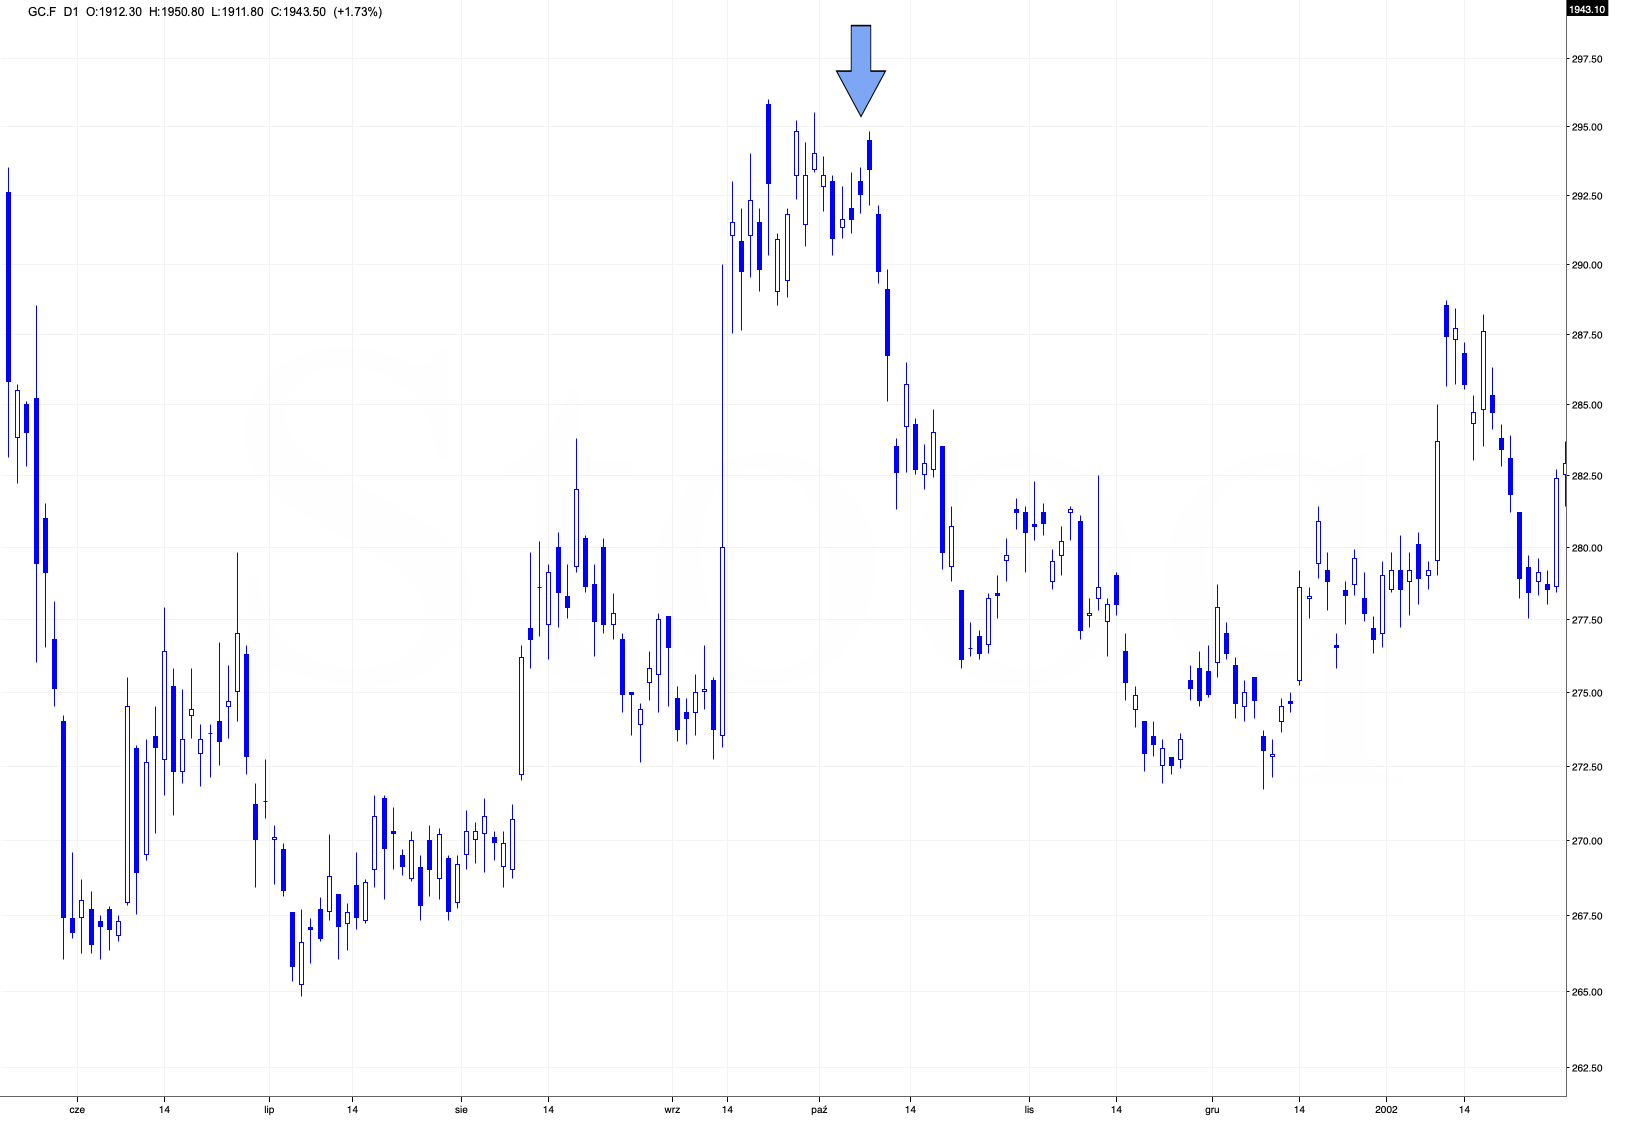
The above chart features the same thing with regard to the U.S. – Afghanistan war. Gold moved higher in the immediate aftermath, but then declined profoundly, as the tensions subsided.
You already saw the analogy to the invasion on Crimea in 2014, so you saw that there was only a short-term rally after the military action took place (in 2014, it took the following form: On 27 February, masked Russian troops without insignia took over the Supreme Council (parliament) of Crimea and captured strategic sites across Crimea.
So, while it might be contrary to one’s intuition about such events, based on the most recent historical analogies, it seems that the Ukraine-war-based rally in the precious metals sector is either over or very close to being over.
And this is even more likely to be the case with junior mining stocks. In case of the latter, it seems that we are witnessing a top in the making at this very moment.
It might be hard to view the above statement as justified in light of the huge rally in gold that we just saw, but the facts and analogies are in place nonetheless.
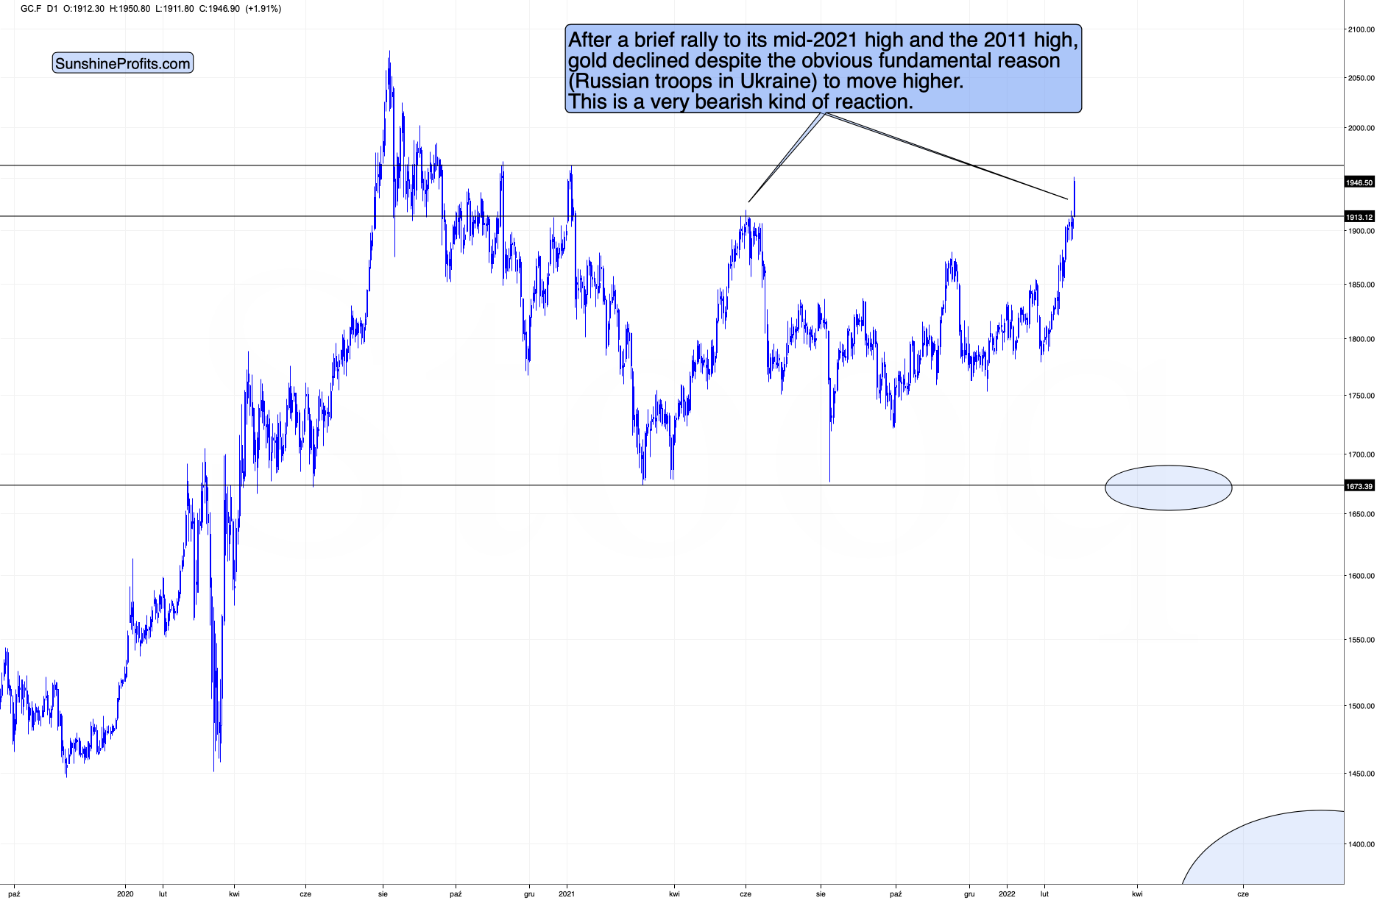
Technically, gold just encountered very strong resistance provided by its 2021 and late-2020 highs, and the breakout above the mid-2021 highs is not confirmed.
Let’s keep in mind that for gold to decline, the war doesn’t have to end, it doesn’t have to be won by either side. The only thing that matters with regard to it, is how big the uncertainty and concern is. And the peak uncertainty/concern might be today, as everything is new, and the situation is dramatically changing the geopolitical environment in Europe.
For comparison, remember Covid-19 cases, deaths in early 2020? That was just a tiny fraction of what we saw later. However, it was new and unknown. People were particularly scared then, and the markets moved particularly significantly then – not based on additional millions of cases and thousands of deaths next year.
Investing and trading are difficult. If it was easy, most people would be making money – and they’re not. Right now, it’s most difficult to ignore the urge to “run for cover” if you physically don’t have to. The markets move on rumor and sell the fact. This repeats over and over again in many (all?) markets, and we have direct analogies to similar situations in gold itself. And junior miners are likely to decline the most, also based on the massive declines that are likely to take place (in fact, it already started) in the stock markets.
Overview of the Upcoming Part of the Decline
- It seems to me that the corrective upswing is now over or very close to being over , and that gold, silver, and mining stocks are now likely to continue their medium-term decline.
- It seems that the first (bigger) stop for gold will be close to its previous 2021 lows, slightly below $1,700. Then it will likely correct a bit, but it’s unclear if I want to exit or reverse the current short position based on that – it depends on the number and the nature of the bullish indications that we get at that time.
- After the above-mentioned correction, we’re likely to see a powerful slide, perhaps close to the 2020 low ($1,450 - $1,500).
- If we see a situation where miners slide in a meaningful and volatile way while silver doesn’t (it just declines moderately), I plan to – once again – switch from short positions in miners to short positions in silver. At this time, it’s too early to say at what price levels this could take place, and if we get this kind of opportunity at all – perhaps with gold close to $1,600.
- I plan to exit all remaining short positions once gold shows substantial strength relative to the USD Index while the latter is still rallying. This may be the case with gold close to $1,350 - $1,400. I expect silver to fall the hardest in the final part of the move. This moment (when gold performs very strongly against the rallying USD and miners are strong relative to gold after its substantial decline) is likely to be the best entry point for long-term investments, in my view. This can also happen with gold close to $1,375, but at the moment it’s too early to say with certainty.
- As a confirmation for the above, I will use the (upcoming or perhaps we have already seen it?) top in the general stock market as the starting point for the three-month countdown. The reason is that after the 1929 top, gold miners declined for about three months after the general stock market started to slide. We also saw some confirmations of this theory based on the analogy to 2008. All in all, the precious metals sector is likely to bottom about three months after the general stock market tops.
- The above is based on the information available today, and it might change in the following days/weeks.
You will find my general overview of the outlook for gold on the chart below:
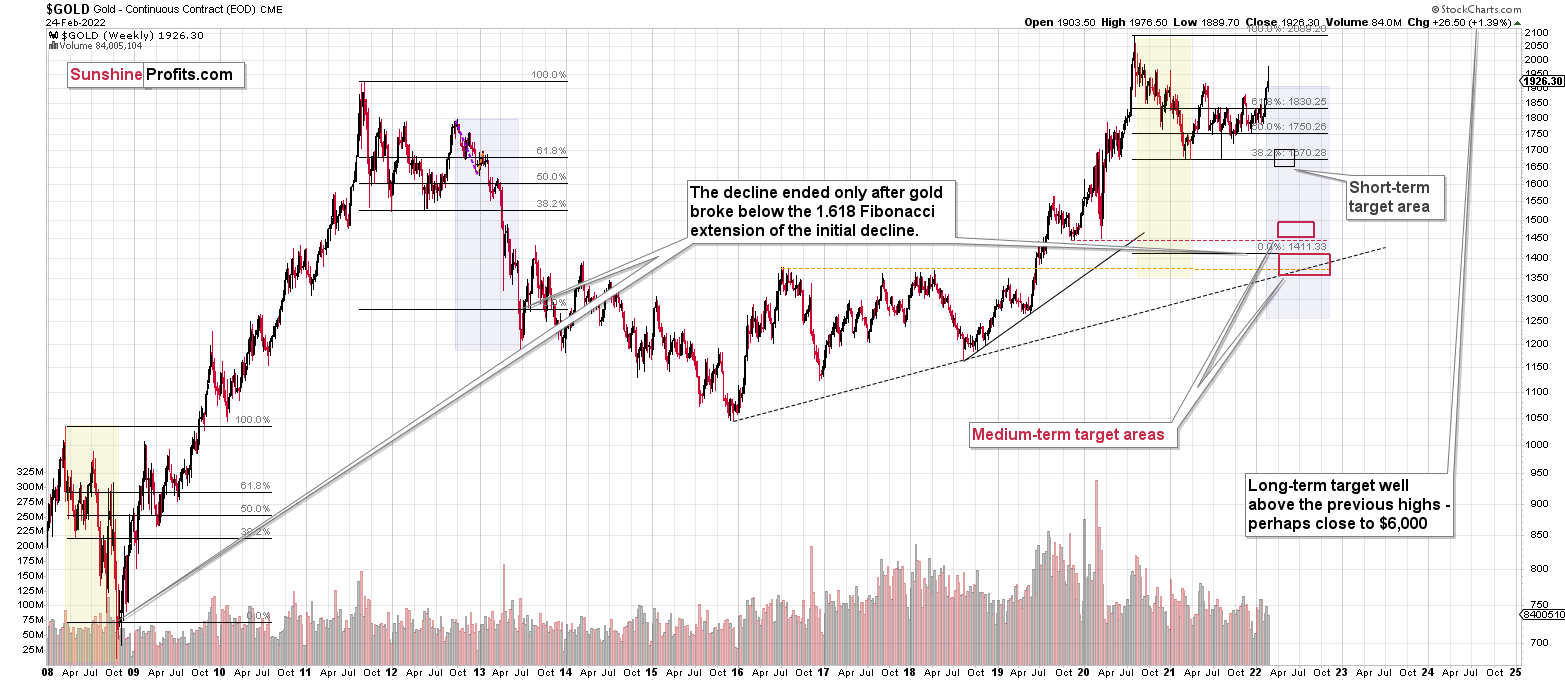
Please note that the above timing details are relatively broad and “for general overview only” – so that you know more or less what I think and how volatile I think the moves are likely to be – on an approximate basis. These time targets are not binding or clear enough for me to think that they should be used for purchasing options, warrants or similar instruments.
Letters to the Editor
Q: What's the price range you consider on the higher side at the moment?
A: I’d say that $2,000 seems to be the maximum that gold might reach before sliding, but I view it as very unlikely that it even gets to $1,970. The 2011 high provides strong resistance, and so does the mid-2021 high, at about $1,920. Most importantly, though, whatever gold does, I don’t think that mining stocks (in particular, junior mining stocks) would be likely to rally visibly.
In other words, it seems to me that junior mining stocks are in the pennies-to-the-upside-but-dollars-to-the-downside position, which makes the risk to reward ratio excellent for short positions in them.
Summary
Summing up, despite last week’s rally in gold, the outlook for junior mining stocks remains exactly as I described previously.
Gold was up about $200 from its late-2021 low, just like how much it rallied in 2014 when Russia took over Crimea. When that happened, junior miners moved about 3% above their previous highs, and we saw something very similar in last week’s GDXJ trading. Then, both gold and junior miners declined, despite the obvious fundamental reasons for their rally.
It looks like “peak uncertainty” and “peak gold” are already here or very, very close. It’s even more likely that the top in junior mining stocks is in.
Investing and trading are difficult. If it was easy, most people would be making money – and they’re not. Right now, it’s most difficult to ignore the urge to “run for cover” if you physically don’t have to. The markets move on “buy the rumor and sell the fact”. This repeats over and over again in many (all?) markets, and we have direct analogies to similar situations in gold itself. Junior miners are likely to decline the most, also based on the massive declines that are likely to take place (in fact, they have already started) in the stock markets.
From the medium-term point of view, the two key long-term factors remain the analogy to 2013 in gold and the broad head and shoulders pattern in the HUI Index. They both suggest much lower prices ahead.
It seems that our profits from the short positions are going to become truly epic in the coming months.
After the sell-off (that takes gold to about $1,350 - $1,500), I expect the precious metals to rally significantly. The final part of the decline might take as little as 1-5 weeks, so it's important to stay alert to any changes.
Most importantly, please stay healthy and safe. We made a lot of money last March and this March, and it seems that we’re about to make much more on the upcoming decline, but you have to be healthy to enjoy the results.
As always, we'll keep you - our subscribers - informed.
To summarize:
Trading capital (supplementary part of the portfolio; our opinion): Full speculative short positions (300% of the full position) in junior mining stocks are justified from the risk to reward point of view with the following binding exit profit-take price levels:
Mining stocks (price levels for the GDXJ ETF): binding profit-take exit price: $34.63; stop-loss: none (the volatility is too big to justify a stop-loss order in case of this particular trade)
Alternatively, if one seeks leverage, we’re providing the binding profit-take levels for the JDST (2x leveraged) and GDXD (3x leveraged – which is not suggested for most traders/investors due to the significant leverage). The binding profit-take level for the JDST: $14.98; stop-loss for the JDST: none (the volatility is too big to justify a SL order in case of this particular trade); binding profit-take level for the GDXD: $25.48; stop-loss for the GDXD: none (the volatility is too big to justify a SL order in case of this particular trade).
For-your-information targets (our opinion; we continue to think that mining stocks are the preferred way of taking advantage of the upcoming price move, but if for whatever reason one wants / has to use silver or gold for this trade, we are providing the details anyway.):
Silver futures downside profit-take exit price: $19.12
SLV profit-take exit price: $17.72
ZSL profit-take exit price: $38.28
Gold futures downside profit-take exit price: $1,683
HGD.TO – alternative (Canadian) inverse 2x leveraged gold stocks ETF – the upside profit-take exit price: $11.79
HZD.TO – alternative (Canadian) inverse 2x leveraged silver ETF – the upside profit-take exit price: $29.48
Long-term capital (core part of the portfolio; our opinion): No positions (in other words: cash
Insurance capital (core part of the portfolio; our opinion): Full position
Whether you already subscribed or not, we encourage you to find out how to make the most of our alerts and read our replies to the most common alert-and-gold-trading-related-questions.
Please note that we describe the situation for the day that the alert is posted in the trading section. In other words, if we are writing about a speculative position, it means that it is up-to-date on the day it was posted. We are also featuring the initial target prices to decide whether keeping a position on a given day is in tune with your approach (some moves are too small for medium-term traders, and some might appear too big for day-traders).
Additionally, you might want to read why our stop-loss orders are usually relatively far from the current price.
Please note that a full position doesn't mean using all of the capital for a given trade. You will find details on our thoughts on gold portfolio structuring in the Key Insights section on our website.
As a reminder - "initial target price" means exactly that - an "initial" one. It's not a price level at which we suggest closing positions. If this becomes the case (like it did in the previous trade), we will refer to these levels as levels of exit orders (exactly as we've done previously). Stop-loss levels, however, are naturally not "initial", but something that, in our opinion, might be entered as an order.
Since it is impossible to synchronize target prices and stop-loss levels for all the ETFs and ETNs with the main markets that we provide these levels for (gold, silver and mining stocks - the GDX ETF), the stop-loss levels and target prices for other ETNs and ETF (among other: UGL, GLL, AGQ, ZSL, NUGT, DUST, JNUG, JDST) are provided as supplementary, and not as "final". This means that if a stop-loss or a target level is reached for any of the "additional instruments" (GLL for instance), but not for the "main instrument" (gold in this case), we will view positions in both gold and GLL as still open and the stop-loss for GLL would have to be moved lower. On the other hand, if gold moves to a stop-loss level but GLL doesn't, then we will view both positions (in gold and GLL) as closed. In other words, since it's not possible to be 100% certain that each related instrument moves to a given level when the underlying instrument does, we can't provide levels that would be binding. The levels that we do provide are our best estimate of the levels that will correspond to the levels in the underlying assets, but it will be the underlying assets that one will need to focus on regarding the signs pointing to closing a given position or keeping it open. We might adjust the levels in the "additional instruments" without adjusting the levels in the "main instruments", which will simply mean that we have improved our estimation of these levels, not that we changed our outlook on the markets. We are already working on a tool that would update these levels daily for the most popular ETFs, ETNs and individual mining stocks.
Our preferred ways to invest in and to trade gold along with the reasoning can be found in the how to buy gold section. Furthermore, our preferred ETFs and ETNs can be found in our Gold & Silver ETF Ranking.
As a reminder, Gold & Silver Trading Alerts are posted before or on each trading day (we usually post them before the opening bell, but we don't promise doing that each day). If there's anything urgent, we will send you an additional small alert before posting the main one.
Thank you.
Przemyslaw Radomski, CFA
Founder, Editor-in-chief

