

Briefly: in our opinion, full (300% of the regular position size) speculative short positions in junior mining stocks are justified from the risk/reward point of view at the moment of publishing this Alert.
PLEASE NOTE:
Dear Subscribers,
Yesterday, there was a mailing error that prevented you from opening the link to the article. We apologize for the technical problem and the confusion that it caused.
Best regards,The Editorial Team
In yesterday’s analysis, I explained how extremely likely it was for gold to decline after U.S. Labor Day, and that’s exactly what happened – gold declined. Not only that – it actually reversed its early gains before moving lower, and we saw the same thing in silver and mining stocks, and the reversal is more bearish than a small decline, as it indicates that the very brief rally is likely already over.
Let’s take a look at what happened recently, starting with gold.
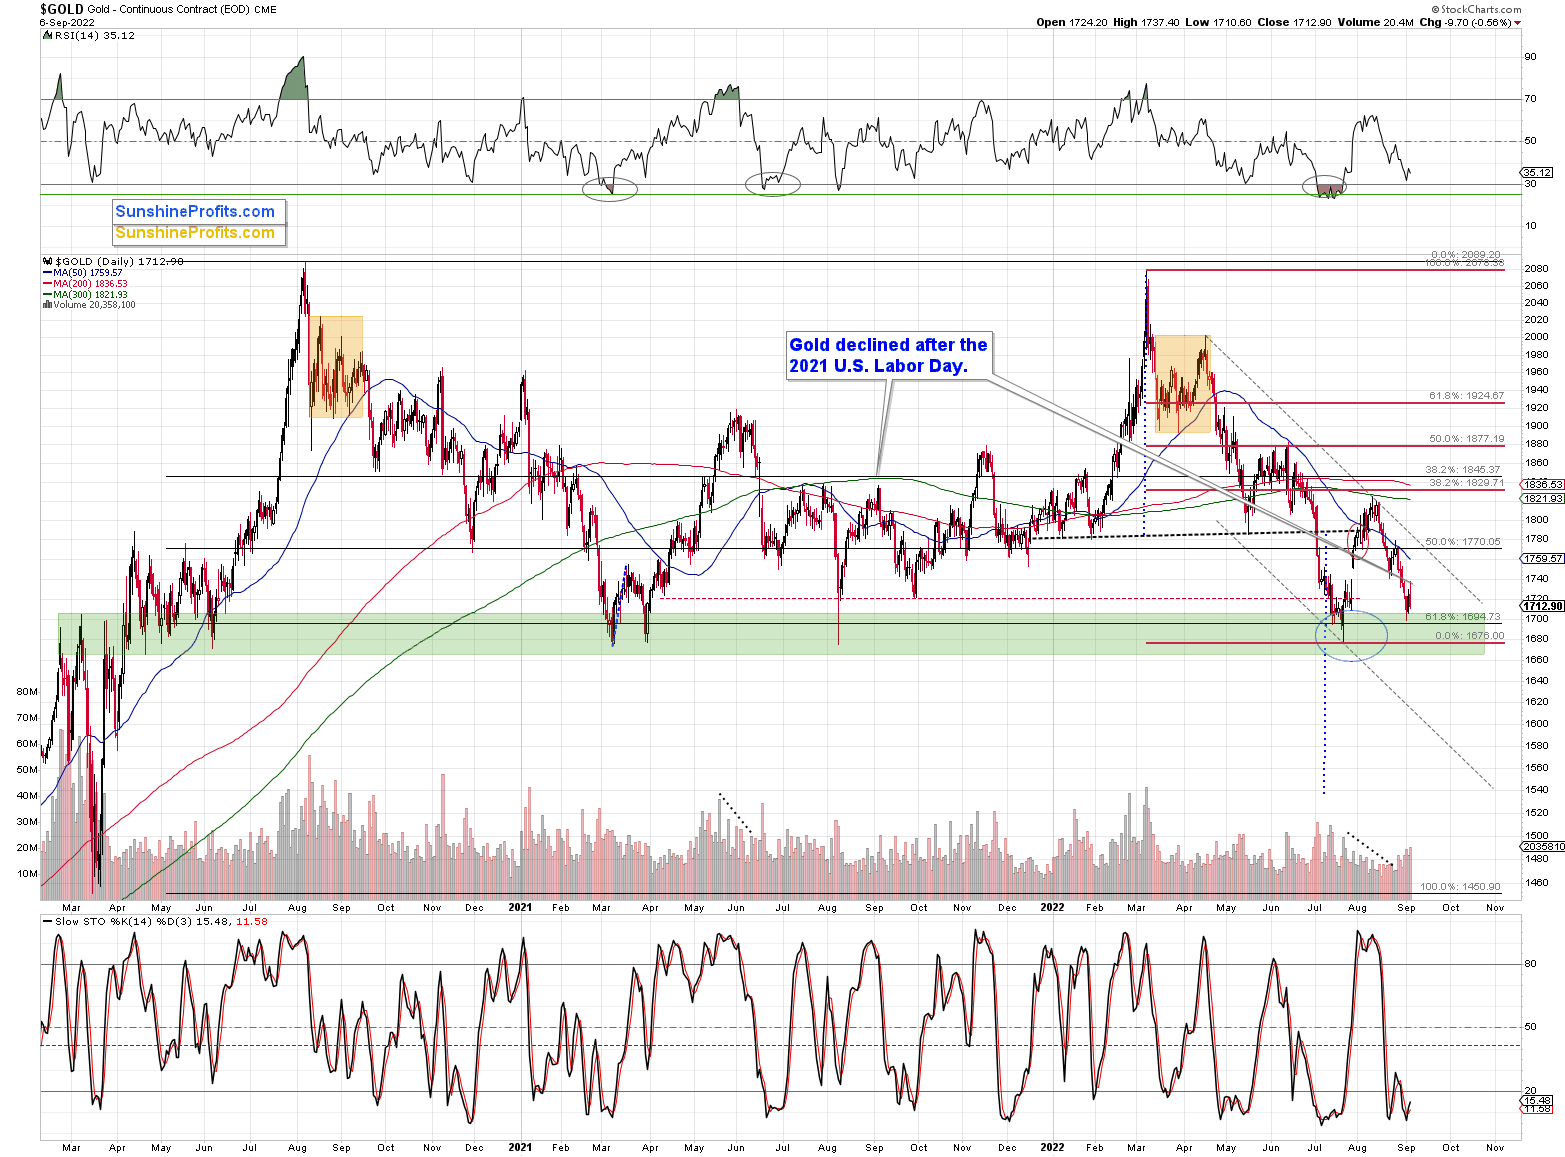
As I wrote above, gold reversed and declined yesterday. However, it also did something else – it declined on volume that was relatively big after a daily upswing that took place on relatively low volume.
The volume readings confirm the bearish nature of the recent back-and-forth trading.
The medium-term downtrend simply remains intact.
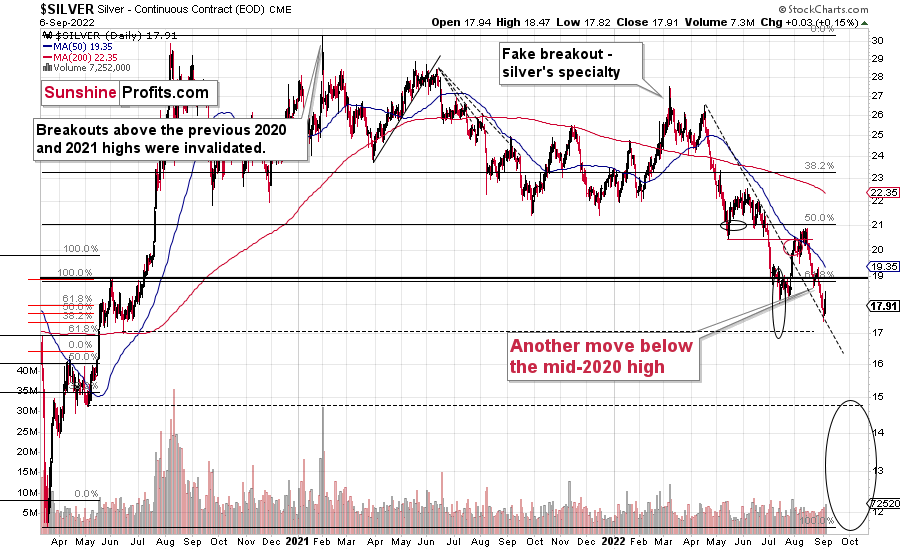
Silver did something similar.
The white metal moved up to $18.47 on an intraday basis, but then declined and ended the day only $0.03 higher. This means that it declined by $0.44 before the closing bell, Aad it closed below the July lows. The breakdown below them was therefore just verified. This is bearish.
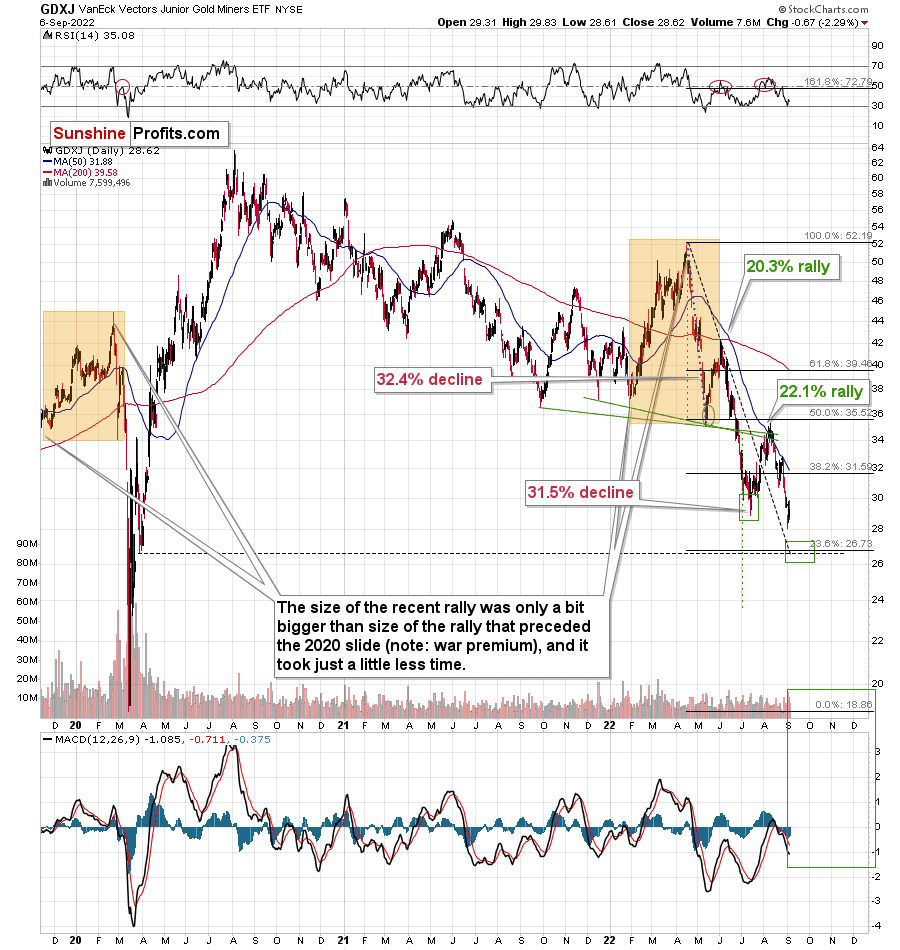
What about junior miners? They declined more visibly, ending the session 2.29% lower, thus further increasing our profits from short positions in them. The GDX was down by 1.47%, and the HUI Index by 1.08%.
Let’s zoom in – the chart below is based on hourly candlesticks.
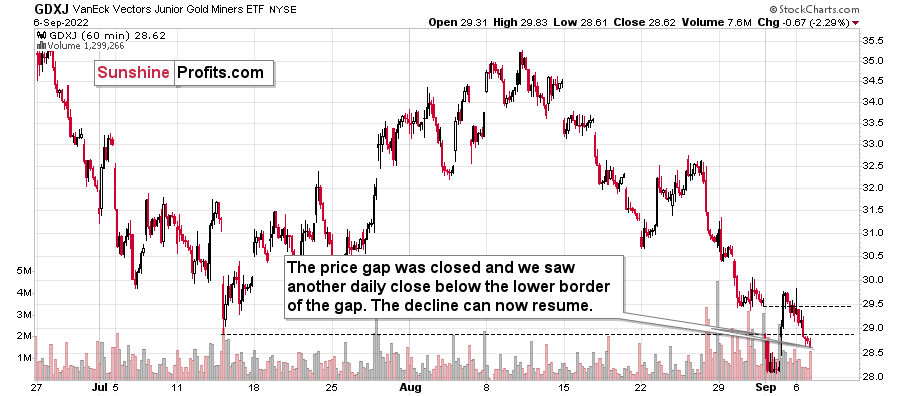
In yesterday’s analysis, I commented on the good technical reason why the GDXJ ETF has moved higher recently:
The GDXJ moved higher and briefly moved above the previous trading day’s closing price and its intraday low. Then, the GDXJ moved back down and closed below those levels.
The important extra detail here is that Thursday’s session started with a price gap. It’s important because prices tend to “want” to close the price gap before continuing with their current trend. “Closing the gap” means temporarily moving to the levels and actually trading where there was no trading before (thus, the gap). That’s exactly what we saw on Friday.
What we haven’t seen on Friday is an invalidation of the breakdown below the July lows in closing price terms. Consequently, the breakdown was not invalidated but verified.
This is not a bullish price action, but something bearish and quite normal. Consequently, the outlook remains bearish.
Indeed, the value of the GDXJ ETF declined yesterday as well. What’s particularly interesting is that while closing below the lower border of the price gap, the GDXJ also closed below the intraday low of July. This means that the breakdown below those lows just became even more believable.
This, together with reversals seen in gold and silver, paints a very bearish picture for the following weeks – and quite likely also for the following days.
Having said that, let’s take a look at the markets from a more fundamental point of view.
PM Problems
With the GDXJ ETF suffering another sharp drawdown on Sep. 6, the junior miners continue to underperform their precious metals peers. Moreover, with the USD Index closing above 110 and the U.S. 10-Year Treasury yield gunning for its 2022 high, gold, silver, and mining stocks’ fundamental outlooks are profoundly bearish.
Please see below:
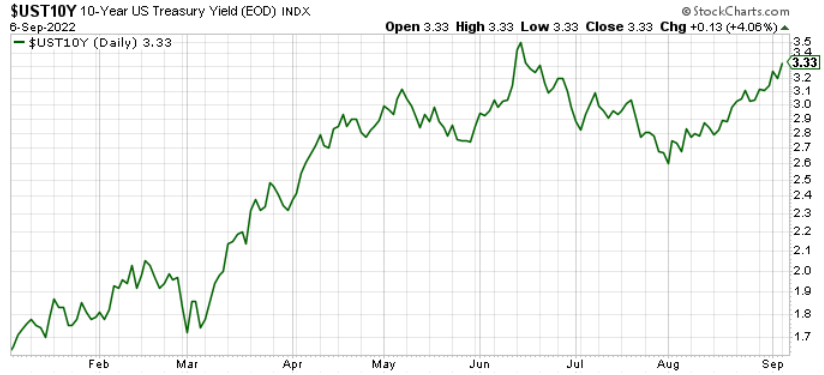
To that point, with the Treasury benchmark ending the Sep. 6 session at 3.33% and the U.S. 10-Year breakeven inflation rate closing at 2.48%, the U.S. 10-Year real yield jumped to 0.85%. Furthermore, the metric is only four basis points away from its 2022 high. As such, the price action in the FX, bond, and commodity markets continues to unfold as expected.
In addition, with the S&P 500 also influencing the PMs’ performances, its recent drawdown has helped shape the GDXJ ETF’s immense weakness. Likewise, with more downside poised to commence in the weeks ahead, the PMs should suffer as the harsh fundamental realities come to bear.
Please see below:
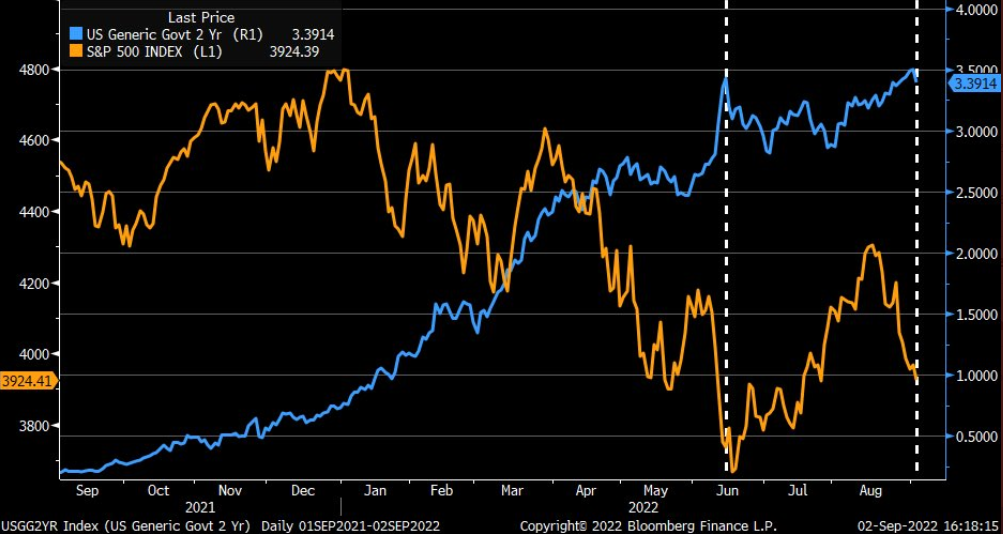
To explain, the orange line above tracks the S&P 500, while the blue line above tracks the U.S. 2-Year Treasury yield. If you analyze the vertical white dashed lines, you can see that a U.S. 2-Year Treasury yield of 3.50% helped push the S&P 500 to its June lows. Thus, while the U.S. 2-Year Treasury yield ended the Sep. 6 session at 3.50%, the S&P 500 is still well above its prior trough. Therefore, the U.S. equity benchmark should be re-priced lower to reflect the recent ascent in U.S. interest rates.
On top of that, while I warned repeatedly that the bear market was far from over, the post-GFC crowd irrationally assumed that the Fed could pivot with 8%+ inflation. To explain, I wrote on Aug. 12:
If normalizing inflation and reducing its balance sheet were so easy, the Fed would have done it already.
Think about it: the Fed was so cautious about tapering its asset purchases that officials waited until inflation was so unanchored that it couldn’t be ignored. But now, the Fed will hike interest rates to 3.4%, sell $95 billion in bonds per month, and increase the U.S. unemployment rate to 3.7% (the Fed’s 2022 SEP projections) while the S&P 500 hits new highs? All the while, reducing the YoY headline CPI to 2%, even though it’s never been done since 1954 without the FFR coming within ~50 basis points of the cycle peak. Good luck.
Well, with the S&P 500 down by 8.7% since the Aug. 12 close, reality has re-emerged. However, with history showing that historical market bottoms occur when the Fed cuts interest rates, unanchored inflation is why we’re nowhere near that milestone.
Please see below:
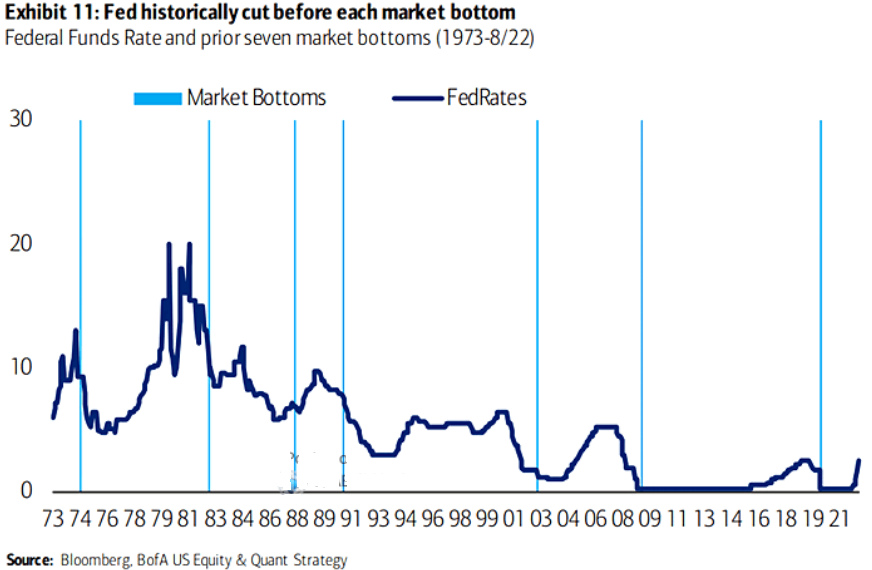
To explain, the dark blue line above tracks the U.S. federal funds rate (FFR), while the vertical light blue lines above highlight market bottoms. If you analyze the relationship, you can see that short-and-long-term bottoms occur when the Fed is cutting interest rates, not raising them. As a result, the S&P 500 is fighting a war that it hasn’t won since the 1970s, and more downside should weigh heavily on the PMs, especially the GDXJ ETF.
Also noteworthy, I highlighted on Sep. 6 how mid-term election cycles often spell trouble for the S&P 500 in September. I wrote:
September is the S&P 500’s worst month when leading up to mid-term elections.
Please see below:
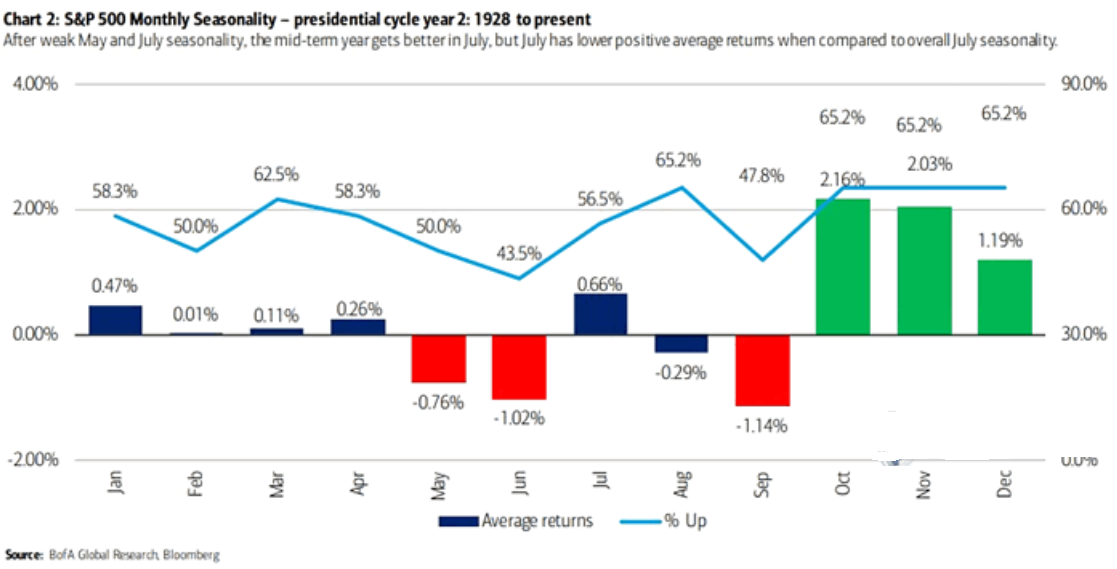
To explain, the blue, red and green bars above track the average monthly percentage gains and losses realized by the S&P 500 during mid-term election cycles. Moreover, the light blue line above tracks the percentage of months that the S&P 500 has delivered a positive return.
If you analyze the red bar under “Sep,” you can see that September is often a painful month for the bulls. Likewise, only 47.8% of September months have ended green, and only June has a worse track record. Therefore, while the GDXJ ETF rallied on Sep. 2, the trend is unlikely to continue.
Overall, financial assets continue to re-price in hawkish directions. With the USD Index and the U.S. 10-Year real yield rallying sharply in recent weeks, their moves have rattled risk assets like the S&P 500 and the PMs. However, while the damage has been profound, the Fed hasn't made much progress in its inflation fight. As a result, the USD Index and the U.S. 10-Year real yield should continue their ascents over the medium term, and such a realization is unlikely to be celebrated by gold, silver, and mining stocks.
More Hawkish Data
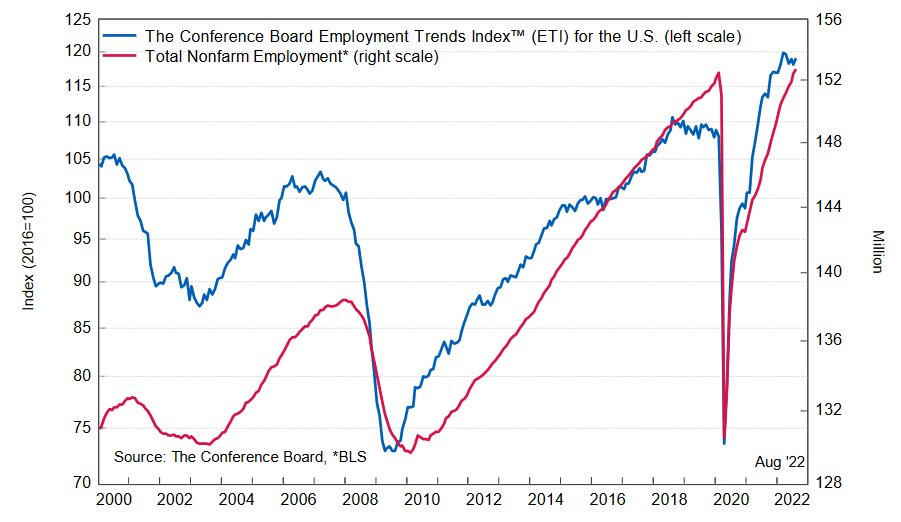
Since maximum employment is one-half of the Fed’s dual mandate, the U.S. labor market is an important variable in our hawkish thesis. Moreover, the Conference Board released its Employment Trends Index (ETI) on Sep. 6, and the metric increased from 118.20 in July (an upward revision) to 119.06 in August. Frank Steemers, Senior Economist at The Conference Board, said:
“August’s increase in the Employment Trends Index indicates the labor market is currently still adding jobs at a robust pace. But with headwinds in the rest of the economy already evident, expect job growth to decelerate for the remainder of the year.”
Thus, while recession fears have economists extremely anxious, the reality is that the U.S. labor market remains resilient. Furthermore, after revising the data higher in July and the metric outperforming that figure in August, wage inflation is unlikely to normalize until the ETI moves materially lower.
Please see below:
Likewise, the ISM released its U.S. Services PMI on Sep. 6. The headline index increased from 56.7 in July to 56.9 in August. More importantly, an excerpt read:
“Employment activity in the services sector grew in August after two months of contraction. ISM’s Employment Index registered 50.2, up 1.1 percentage points from the July reading of 49.1. Comments from respondents include: ‘Unable to hire enough people to fill jobs’ and ‘(Head count) would be higher but there's some churn, as some employees transfer to other departments or leave for perceived better opportunities.’”
As a result, while the financial market’s recent swoon has reduced commodity prices and, therefore, helped reduce input inflation, the U.S. labor market has barely budged. Thus, the Fed’s nine 25 basis point rate hikes in 2022 have not reduced employment demand to the extent that officials had hoped.
As further evidence, S&P Global also released its U.S. Services PMI on Sep. 6. However, the results materially contrasted the ISM’s data, as the headline index declined from 47.3 in July to 43.7 in August. For context, a reading above 50 signals an expansion, while a reading below 50 signals a contraction.
Yet, while the output results were far from optimistic, the report revealed that “Employment rose at the softest rate since January” and that August saw “the degree of confidence rising to a three-month high.”
As such, the critical point is that employment is still trending in a positive direction, and unless the U.S. labor market falls off a cliff, the Fed is unlikely to pause its rate hike cycle. Therefore, the bullish fundamental developments that have uplifted the USD Index and the U.S. 10-Year real yield in 2022 should remain in place for the foreseeable future.
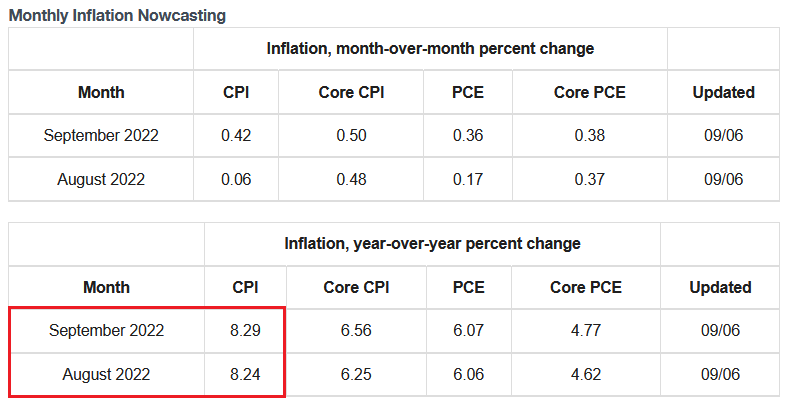
In addition, while inflation has slowed due to the negativity plaguing the commodity market, the Cleveland Fed’s inflation Nowcast projects the headline Consumer Price Index (CPI) to eclipse 8% year-over-year (YoY) in August and September. Thus, with August’s results hitting the wire on Sep. 13, the combination of resilient employment and unanchored inflation is profoundly bullish for Fed policy.
 Source: Cleveland Fed
The Bottom Line
While the consensus assumed that the bear market was over, I warned that shifting sentiment did little to alleviate the fundamental difficulties. Moreover, with the bond market sell-off impacting several asset classes, the rise in interest rates should continue until material inflation progress is made. As such, more downside should confront gold, silver, mining stocks, and the S&P 500 in the months ahead.
In conclusion, the PMs were mixed on Sep. 6, as silver ended the day in the green. However, the GDXJ ETF materially underperformed its precious metals peers, and the junior miners’ year-to-date (YTD) decline is nearly 32%. Thus, our short position continues to perform, and we expect further gains over the medium term.
Overview of the Upcoming Part of the Decline
- It seems to me that the corrective upswing is over, and that the next big move lower is already underway. We might see one final small corrective upswing soon, though.
- If we see a situation where miners slide in a meaningful and volatile way while silver doesn’t (it just declines moderately), I plan to – once again – switch from short positions in miners to short positions in silver. At this time, it’s too early to say at what price levels this could take place and if we get this kind of opportunity at all – perhaps with gold prices close to $1,600.
- I plan to exit all remaining short positions once gold shows substantial strength relative to the USD Index while the latter is still rallying. This may be the case with gold prices close to $1,400. I expect silver to fall the hardest in the final part of the move. This moment (when gold performs very strongly against the rallying USD and miners are strong relative to gold after its substantial decline) is likely to be the best entry point for long-term investments, in my view. This can also happen with gold close to $1,400, but at the moment it’s too early to say with certainty.
- The above is based on the information available today, and it might change in the following days/weeks.
You will find my general overview of the outlook for gold on the chart below:
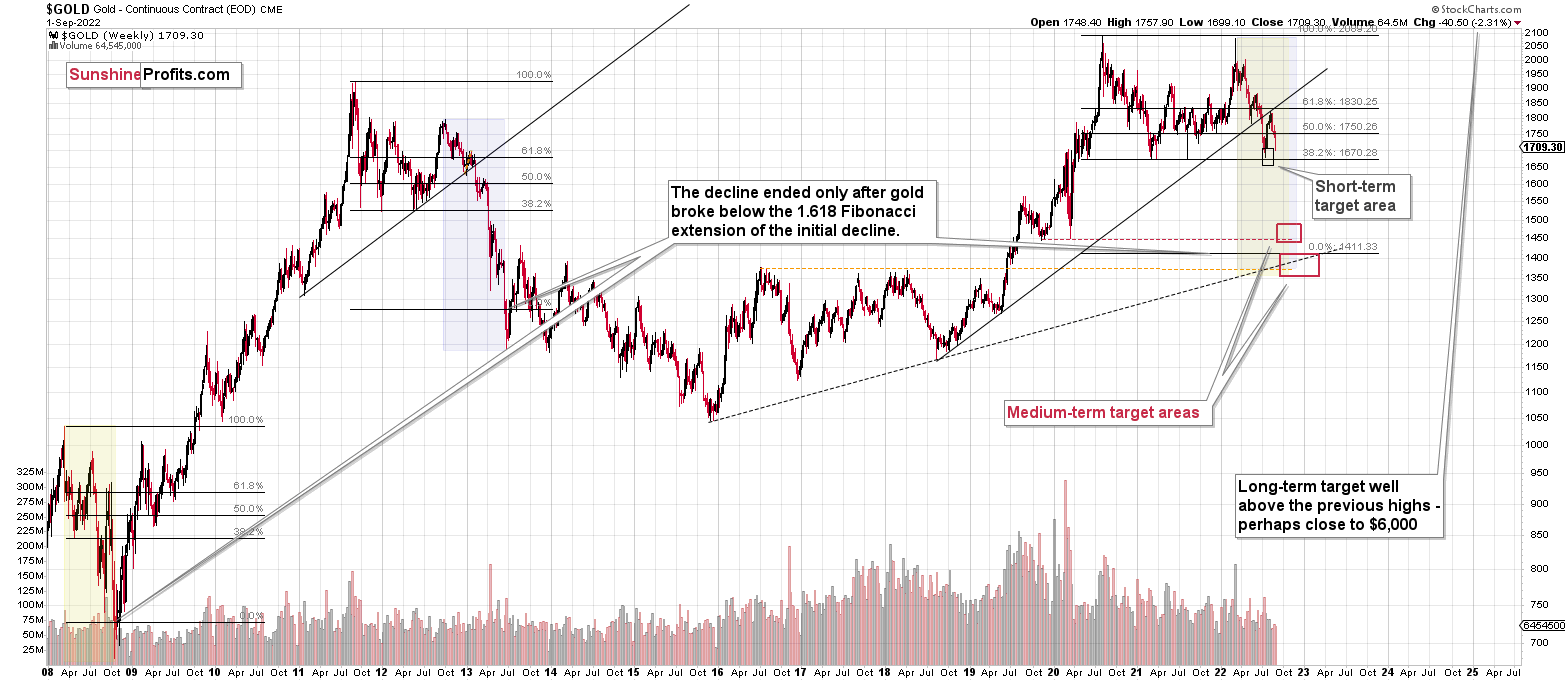
Please note that the above timing details are relatively broad and “for general overview only” – so that you know more or less what I think and how volatile I think the moves are likely to be – on an approximate basis. These time targets are not binding nor clear enough for me to think that they should be used for purchasing options, warrants, or similar instruments.
Letters to the Editor
Q: Thanks so much for your update. I always breathe a sigh of relief after I read your updates.
Just a quick question. I'm short zsl now, and even though silver is down .10, my zsl short position is down. It should be up. Do you have an explanation of why that could be?
Thx.
A: I’m very happy that you enjoy the results of our work!
I wouldn’t make much of a tiny discrepancy between the movement of two related assets. It was just 0.10 in the above-mentioned example. It could have been the case that some big party was buying one of the assets, but on the other hand and before the market’s balancing mechanisms kicked in, the market closed. Or it could have been the fact that someone, somewhere mentioned ZSL specifically, but not silver, and people rushed to make transactions in it, but not in silver futures… In the case of those tiny movements, there are myriads of possible reasons, but they don’t really change anything, and thus, they don’t matter that much.
Q: I would like you to comment on what happened over the Labor Day holiday in the USD DXY market and, subsequently, the gold futures market. It was widely reported that Korean and Asian traders massively shorted the USD in an attempt to stop the slide of the Korean won. Briefly, there was a strong decline in the USD within an hour's period along with a large spike in gold prices from 1718 to 1737. The attempt failed and the USD regained its value and then some this morning. My interest is in understanding the risk to the USD’s advance and gold’s decline through attempted intervention with nation states.
Thanks.
A: Hmm… Well, you already replied to your own question. There was an attempt to move the market in a certain way, but ultimately, the markets returned to their original state/trend. That’s what generally tends to happen – the market wins eventually. Usually very soon. When some of the markets are not open (especially, when the U.S. markets are not open), the markets are more prone to this erratic/temporary (manipulative?) movement, because some investors/traders are not able to counteract and rebalance the trades.
That’s why it might be misleading to read the price action on those days – it’s not the same “market” that moves the price, as it’s usually the case, and thus the price moves are not necessarily comparable. It’s usually best to wait out those times and check where markets are after the first full market session, where all interested parties (globally) have had a chance to react. In the current case, the downtrend in the precious metals sector remains intact.
Summary
Summing up, it seems that the powerful medium-term downtrend in the precious metals sector is already underway. Still, I wouldn’t rule out a situation in which we get another, final, small corrective upswing in the near future. Based on how gold, silver, and mining stocks decline in the near future (including today), I might send out an intraday Alert with details regarding the current trading positions’ adjustment. If GDXJ gets below $27 today, I might (or not) even switch into a small, long position for a few days.
You have been profiting from how this situation develops practically throughout the entire year, and the above indicates (I’m not making any guarantees, of course) that the biggest gains are likely just ahead.
After the final sell-off (that takes gold to about $1,350-$1,500), I expect the precious metals to rally significantly. The final part of the decline might take as little as 1-5 weeks, so it's important to stay alert to any changes.
As always, we'll keep you – our subscribers – informed.
To summarize:
Trading capital (supplementary part of the portfolio; our opinion): Full speculative short positions (300% of the full position) in junior mining stocks are justified from the risk to reward point of view with the following binding exit profit-take price levels:
Mining stocks (price levels for the GDXJ ETF): binding profit-take exit price: $20.32; stop-loss: none (the volatility is too big to justify a stop-loss order in case of this particular trade)
Alternatively, if one seeks leverage, we’re providing the binding profit-take levels for the JDST (2x leveraged). The binding profit-take level for the JDST: $29.87; stop-loss for the JDST: none (the volatility is too big to justify a SL order in case of this particular trade).
For-your-information targets (our opinion; we continue to think that mining stocks are the preferred way of taking advantage of the upcoming price move, but if for whatever reason one wants / has to use silver or gold for this trade, we are providing the details anyway.):
Silver futures downside profit-take exit price: $12.32
SLV profit-take exit price: $11.32
ZSL profit-take exit price: $79.87
Gold futures downside profit-take exit price: $1,504
HGD.TO – alternative (Canadian) 2x inverse leveraged gold stocks ETF – the upside profit-take exit price: $19.87
HZD.TO – alternative (Canadian) 2x inverse leveraged silver ETF – the upside profit-take exit price: $49.87
Long-term capital (core part of the portfolio; our opinion): No positions (in other words: cash)
Insurance capital (core part of the portfolio; our opinion): Full position
Whether you’ve already subscribed or not, we encourage you to find out how to make the most of our alerts and read our replies to the most common alert-and-gold-trading-related-questions.
Please note that we describe the situation for the day that the alert is posted in the trading section. In other words, if we are writing about a speculative position, it means that it is up-to-date on the day it was posted. We are also featuring the initial target prices to decide whether keeping a position on a given day is in tune with your approach (some moves are too small for medium-term traders, and some might appear too big for day-traders).
Additionally, you might want to read why our stop-loss orders are usually relatively far from the current price.
Please note that a full position doesn't mean using all of the capital for a given trade. You will find details on our thoughts on gold portfolio structuring in the Key Insights section on our website.
As a reminder - "initial target price" means exactly that - an "initial" one. It's not a price level at which we suggest closing positions. If this becomes the case (as it did in the previous trade), we will refer to these levels as levels of exit orders (exactly as we've done previously). Stop-loss levels, however, are naturally not "initial", but something that, in our opinion, might be entered as an order.
Since it is impossible to synchronize target prices and stop-loss levels for all the ETFs and ETNs with the main markets that we provide these levels for (gold, silver and mining stocks - the GDX ETF), the stop-loss levels and target prices for other ETNs and ETF (among other: UGL, GLL, AGQ, ZSL, NUGT, DUST, JNUG, JDST) are provided as supplementary, and not as "final". This means that if a stop-loss or a target level is reached for any of the "additional instruments" (GLL for instance), but not for the "main instrument" (gold in this case), we will view positions in both gold and GLL as still open and the stop-loss for GLL would have to be moved lower. On the other hand, if gold moves to a stop-loss level but GLL doesn't, then we will view both positions (in gold and GLL) as closed. In other words, since it's not possible to be 100% certain that each related instrument moves to a given level when the underlying instrument does, we can't provide levels that would be binding. The levels that we do provide are our best estimate of the levels that will correspond to the levels in the underlying assets, but it will be the underlying assets that one will need to focus on regarding the signs pointing to closing a given position or keeping it open. We might adjust the levels in the "additional instruments" without adjusting the levels in the "main instruments", which will simply mean that we have improved our estimation of these levels, not that we changed our outlook on the markets. We are already working on a tool that would update these levels daily for the most popular ETFs, ETNs and individual mining stocks.
Our preferred ways to invest in and to trade gold along with the reasoning can be found in the how to buy gold section. Furthermore, our preferred ETFs and ETNs can be found in our Gold & Silver ETF Ranking.
As a reminder, Gold & Silver Trading Alerts are posted before or on each trading day (we usually post them before the opening bell, but we don't promise doing that each day). If there's anything urgent, we will send you an additional small alert before posting the main one.
Thank you.
Przemyslaw Radomski, CFA
Founder, Editor-in-chief

