
- USD Index
- True Seasonals for US Dollar
- General Stock Market
- Correlation Matrix
- Gold
- Silver
- Mining Stocks
- Summary
We would like to take this opportunity to discuss the current market environment from the long-term investor's perspective. We do it on a regular basis in updates, such as this one, but we think it’s a good idea to get back to basics from time to time. Today we will focus on a few basic ideas on which we based our extensive precious metals portfolio report. The thing that inspired us to discuss this issue was the question that we received this week (and it was the only one that we received). Here it is:
(…) I'm interested in investing in physical gold and silver with a company called Bullion Vault. I have the money in my account ready to buy the gold or silver - mainly I am looking for long term safety. I think the financial markets may be in a mess starting in 2015 onwards as the amount of debt that has accumulated starts to have an impact. However I do not know for certain. One thing is for sure I am worried about keeping my savings in currency in the bank. since 2008 my savings have depreciated by 30% and I'm worried about loosing more. This is why I would like to get my life's savings into the precious metals market with a long term view - 2 to 5 years. I'm just waiting for the right time to buy. Also I need to decide if I go down the Gold root or the silver root or both. I have my savings in USD at the moment and I do not feel comfortable having them in paper - especially USD.(…)
In short, our preferred take is to mix long-term investments and short-term trading, because diversification of strategies provides higher gains, when done properly. Still, individual preferences are the most important issue, so if you want to go with long-term investments only - we are perfectly fine with that. In fact, it's usually best for people to start with long-term investments and then - if they wish to do so - to add the trading part later.
The long-term investment part - why do we bother even commenting on it if the buy-and-hold perspective seems so easy? Because we can increase the profitability of long-term investments, compared with the simple buy-and-hold approach, if we focus on staying out during the most unfavorable conditions (the risk here is to be out of the market so we get out only at very certain times). The point of long-term investing - and why it's better for beginners - is that it's more certain than short-term speculation as you have far more factors available on which you can base your decision. In case of long-term investments, you have multiple fundamental factors to consider, which means that you will be more certain about a given price move (a move up in case of the precious metals in the long run).
At times, however, it is very likely that we will see a move lower in the medium term - for example this was the case in April and we suggested getting out of long-term investments. There are not many times when it's best to stay out - at least partly - of the precious metals sector with one's long-term investments, but when it is, the following price moves are significant enough to more than justify paying attention to what the market was doing for months even if there were no changes in the positions. Simply put, it pays off.
Getting back to the question - one of the right times to buy is already behind us in our view, and we think that it’s a good idea to have one's long-term investments already in the market (gold, silver and platinum). We think that gold will move below its previous low, so we might have one more opportunity to get back on the long side of the market. Just in case we don’t, see another decline (again, the risk here is to be out of the market), we are keeping half already in the market (which means that if one doesn’t have any precious metals we still suggest using half of the capital to get in the market). In the near future there might be opportunities to increase the long-term rate of return by being (partially) out of the market, so it can be a good idea to stay informed anyway, and this is where we will be helpful.
Naturally, signals for traders will be presented much more often, but long-term investors should also benefit.
Having said that, let's move on the part of the update in which we analyze what happened in the precious metals market and in related markets in the past week and we put it into different perspectives. Let's start with the USD Index. This time we will start with the short-term chart (charts courtesy of http://stockcharts.com)
USD and Euro Indices
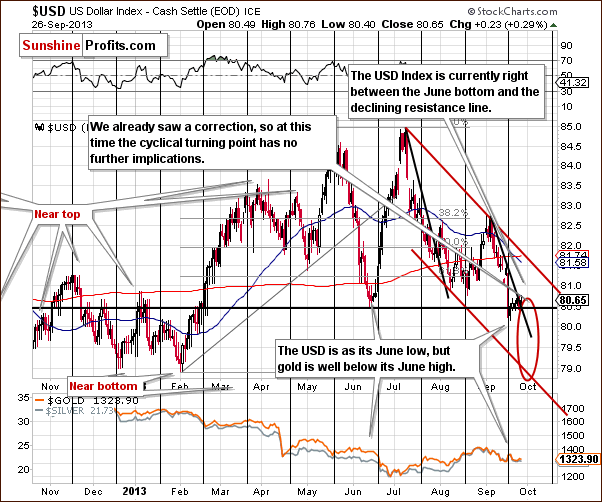
On the short-term chart, we see that the USD Index remains between the support line based on the June low and the resistance line based on the September highs. Therefore, we will probably see a breakout or a breakdown in the near term. If there is such a price action, a bigger move to the upper or lower border of the declining trend channel is quite probable. Because of this uncertainty, the downside target area has been increased and marked with a red ellipse.
Generally, the situation on the USD Index evolved along with the True Seasonal tendencies.
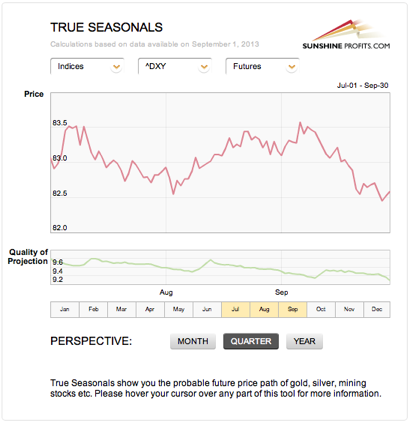
We saw a small correction, as seen on the short-term chart. The above patterns are suggesting another small move lower in the final part of this month, which could mean a breakdown below the June low and another bigger move lower.
Please note that the quality of the prediction (green line in the lower part of the above chart) declines in the final part of the month, which means that a deviation (in the form of a bigger decline) is not unlikely.
The bearish implications and in the first days of October, so the move lower could be seen quite soon. That’s one of the factors that makes the short-term outlook for precious metals not as bearish as one might view it based on the medium-term trend.
Now, let’s examine the weekly chart.
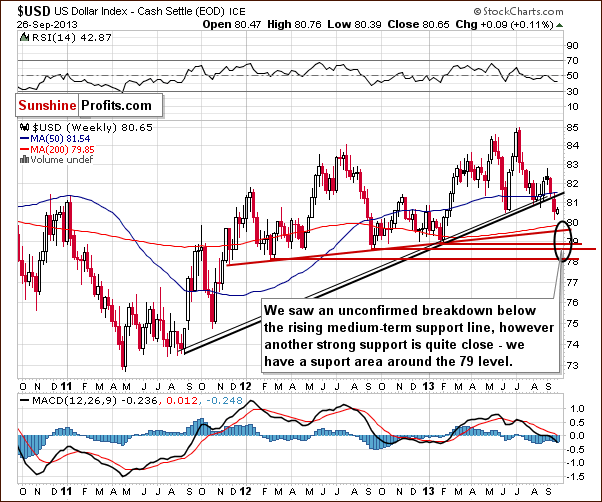
On the above chart, we see that the breakdown below the rising, medium-term support line is still not confirmed (weekly closing prices this week and next will confirm the breakdown if they are seen below the rising support line). Taking into account what happens on the short-term USD Index chart, the dollar could move lower – to the area marked with the black ellipse on the above chart - but it doesn’t have to.
As we wrote in our previous Premium Update:
(…) the target area is quite unclear because of the multiple support lines, including the long-term support line seen on the previous chart. It seems that we could see the US Dollar Index in the 78-79 range before the bottom is in. Again the exact price target is unclear.
Therefore, the area marked with the black ellipse is the maximum downside target level.
Let’s check the long-term outlook.
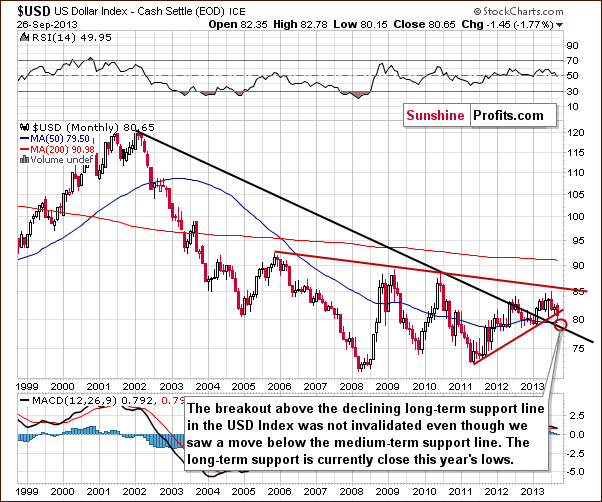
The situation in the long-term chart hasn’t changed much recently. The long-term breakout above the declining long-term support line was not invalidated, even though the USD dropped heavily last week.
However, since the medium-term breakdown (below the support line marked with red) is visible also from this perspective, we could see some short-term weakness anyway. It seems that the long-term support line will stop the decline – that is, if the USD Index gets that low. Therefore, from the long-term perspective, it seems that the downside is still quite limited.
Summing up, it looks as though we could see further weakness in the USD Index in the very short-term (within a week or so), but it is not a certainty – we could see a short-term breakout and a subsequent rally shortly. In all cases, we expect the decline to be stopped by the declining long-term support line.
General Stock Market
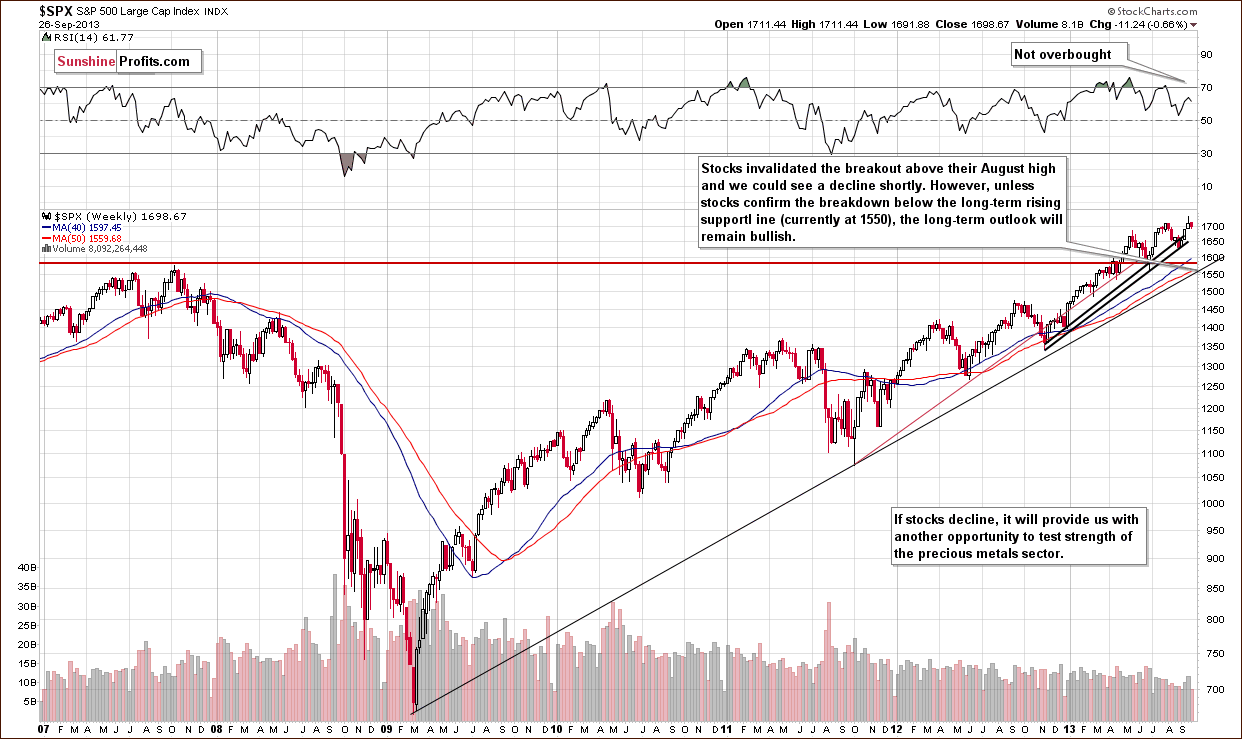
On the above chart, we see that there was an invalidation of the breakout above the August high in recent days. Therefore, we could see further deterioration in the near future. If stocks decline, it will provide us with another opportunity to test the strength of the precious metals sector.
Please note that even if stocks confirm the breakdown below their 2013 high, the long-term rising support line (currently at 1550), is still likely to stop the decline, and the long-term outlook will remain bullish as long as we stay above it.
Now, let’s turn to the financial sector, which in the past used to lead the rest of the general stock market.
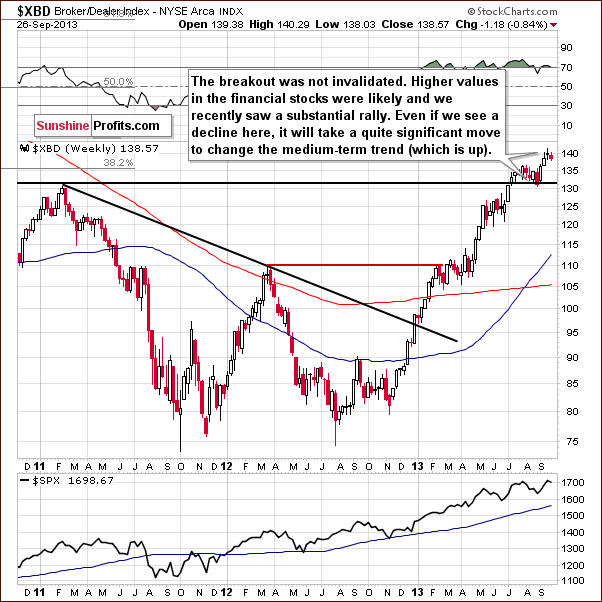
On the above chart, we see that there was a downward move in recent days, which took the financials below the 140 level. In spite of this, the breakout above the 130 level has not been invalidated.
Please note that even if we see some weakness on a short-term basis, which will take quite a significant decline, it would not change the medium-term tendency as long as financials remain above the 130 level.
For more analysis of the stock market, please see our Stock Trading Alert section, which will be available free of charge only until the end of the week. It will become a premium product at the beginning of next week.
Summing up, although stocks invalidated the breakout above the August top, the outlook for the general stock market is still bullish for the long term. There is a chance, however, that we could see some weakness in the short run.
Gold & Silver Correlations
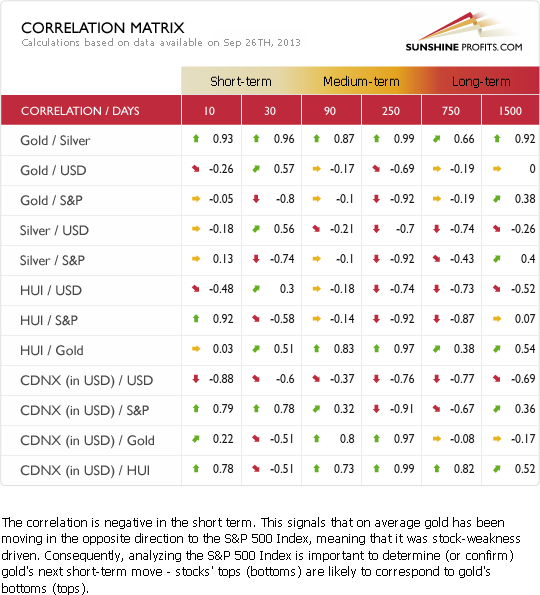
In the short-term, the correlation between the precious metals sector and the general stock market is negative. Taking this into account, the invalidation of the breakout actually has bullish implications for the precious metals sector as emphasized on the S&P 500 chart previously. As mentioned above, this will provide us with an interesting opportunity to test the strength of the precious metal sector. If precious metals and mining stocks move higher on low volume, or don’t move higher at all even though S&P 500 declines, we will view this as a bearish confirmation.
Gold
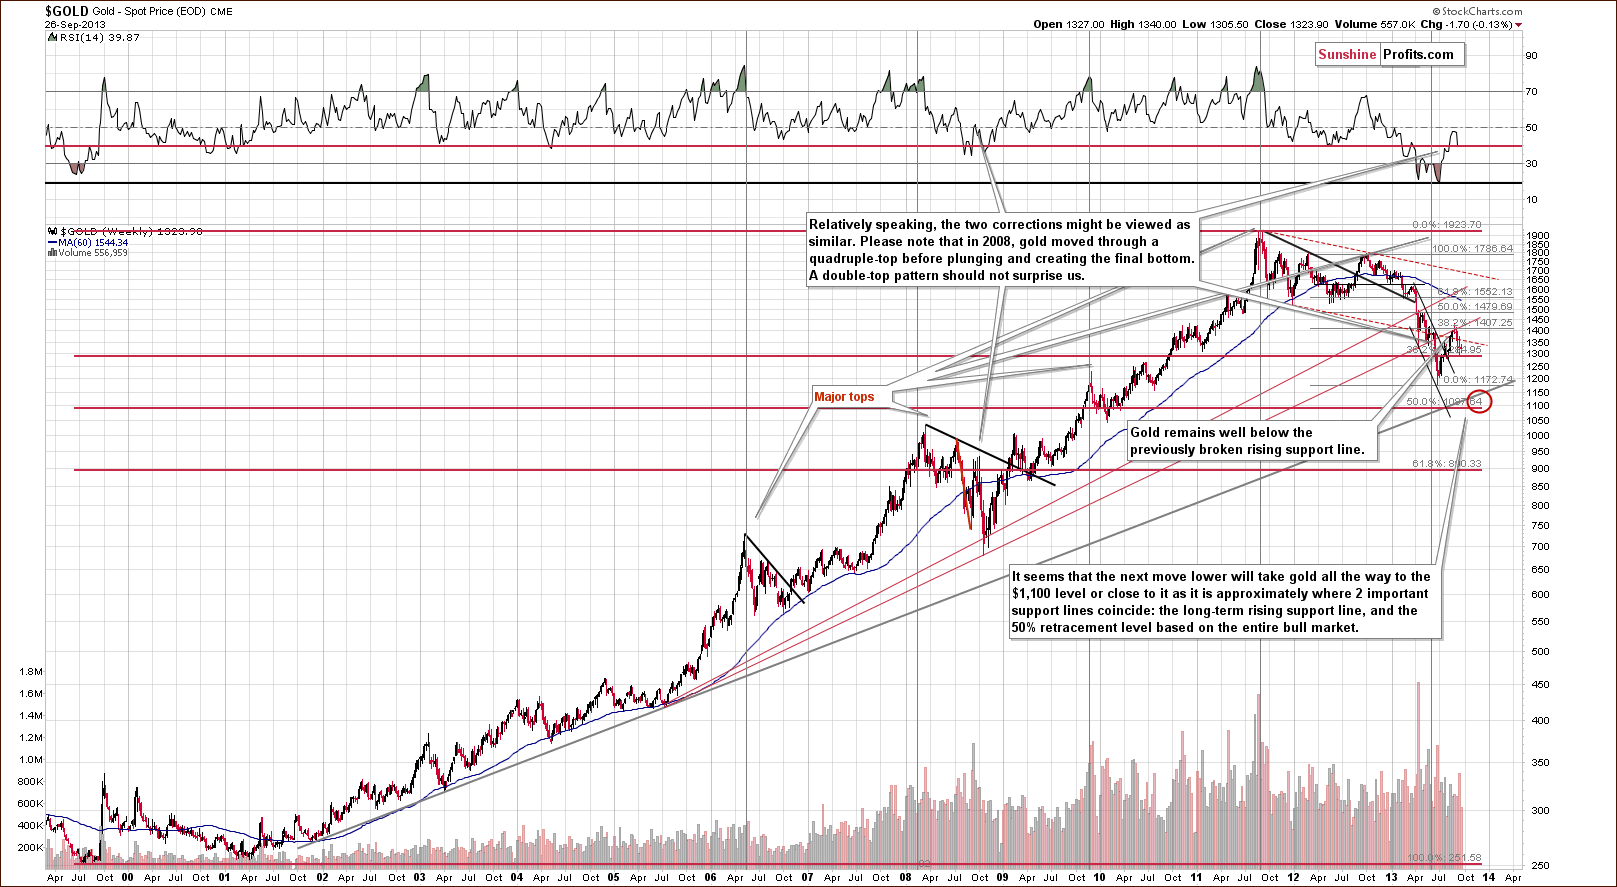
On the long-term gold chart, we see that the situation hasn’t changed much in the past week and most of what we wrote in our previous Premium Update is still up-to-date today.
(...) gold verified the breakdown below the long-term resistance line created by the July 2005 and the October 2008 bottoms (taking intraday bottoms into account). (...) there was an invalidation of the breakout above the 38.2% Fibonacci retracement level based on the September 2012 - June 2013 decline earlier this month. This was a bearish sign.
From this point of view, it seems that even if gold increases once again in the coming days and reaches the above-mentioned levels once again, the medium-term outlook will continue to be bearish.
Please note that in 2008, when gold moved higher before plunging for the final time, there were several intra-week attempts to move higher after which gold finally declined. Therefore, a double top pattern should not surprise us here. The same goes for a triple top.
Let’s now take a look at the medium-term picture to see more details.
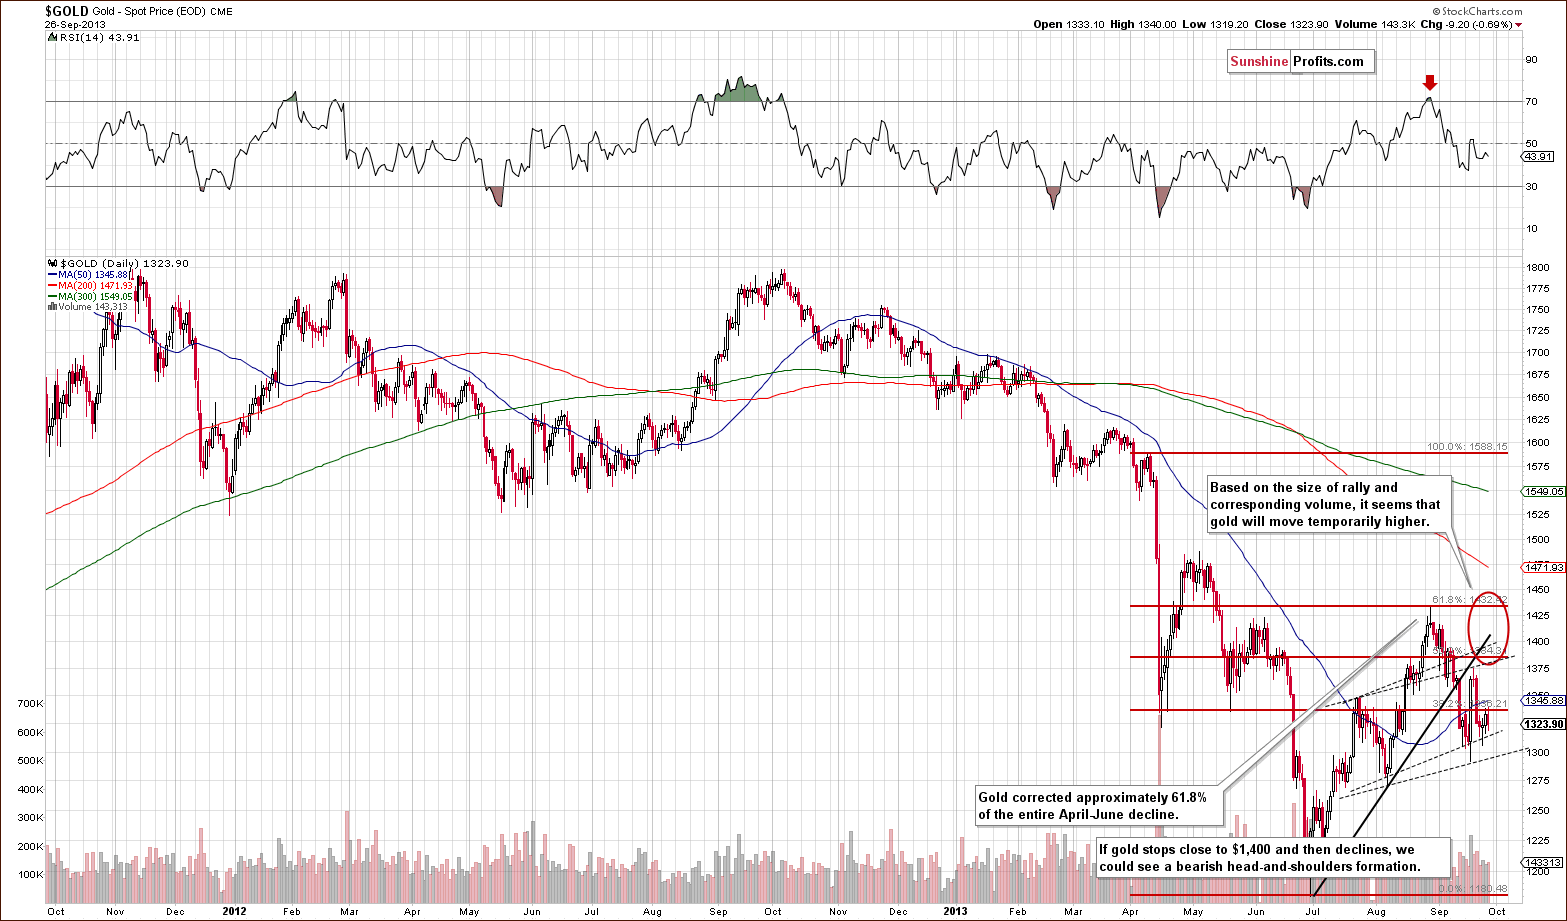
On the above chart, we see that gold declined sharply in the past few days and erased most of (last week’s) Wednesday rally. Additionally, the yellow metal still remains below the rising resistance line based on the July and August lows.
As we can see on the daily chart, there is an unconfirmed bearish head-and-shoulders pattern underway. At this point, it’s worth noting that even if gold continues its rally and moves close to the August top (the area marked with a red ellipse), the medium-term outlook will remain bearish. This means that as long as there is no confirmed breakout above the August 28 high, the implications will remain bearish.
Please note that if the right shoulder of the above-mentioned formation (precisely: the rally) forms on low volume, we will get a confirmation that this bearish formation will complete in the following days. In this case, we will be likely to open short positions. This is not the case just yet, however.
Let’s take a look at the chart featuring gold’s price from the non-USD perspective.
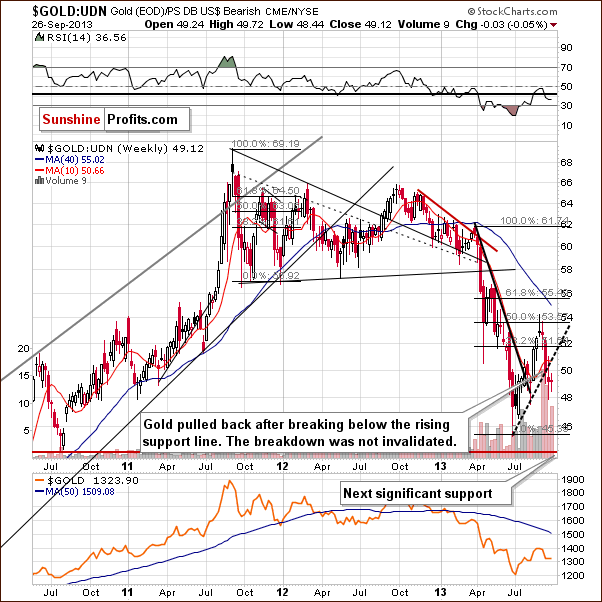
On the above chart, we see that the breakdown was not invalidated. The situation deteriorated slightly, as we have seen another weekly close below the rising support/resistance line based on the June and August bottoms.
Therefore, from this perspective, the implications are bearish.
Let’s examine gold from another perspective – gold priced in the British pound.
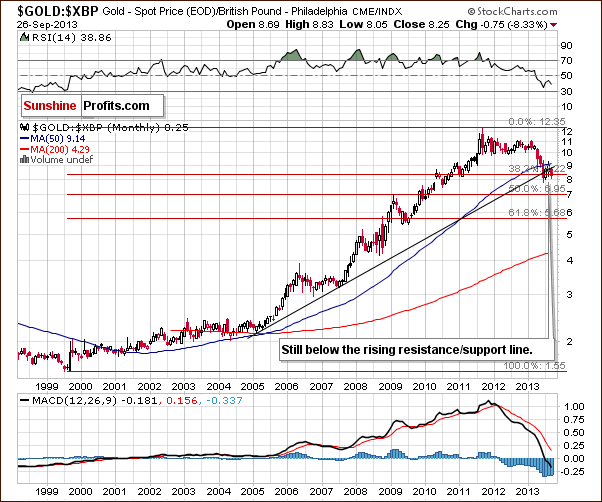
Earlier this month, gold gave up the August gains and dropped below the rising resistance line once again. Additionally, the breakout above the 50-month moving average was invalidated. These invalidations are bearish signals.
Let’s now take a look at gold priced in the euro.
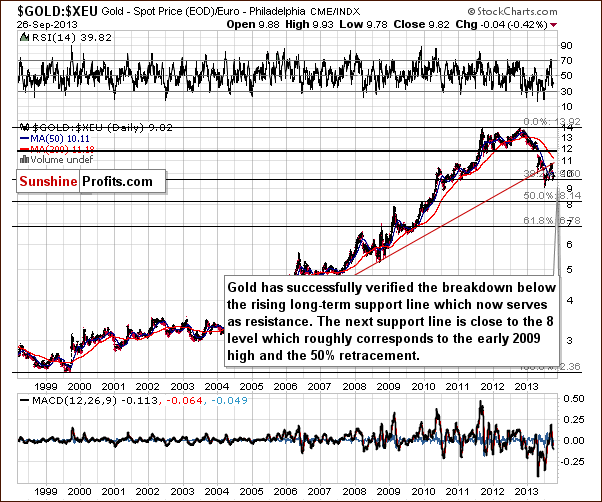
On the above chart, we see that the situation hasn’t changed much. Although gold priced in euros pulled back in the past week, it still remains below the previously-broken, rising support/resistance line (marked with red). Therefore, the implications are bearish.
Now, let’s move on to the chart of gold priced in Australian dollars.
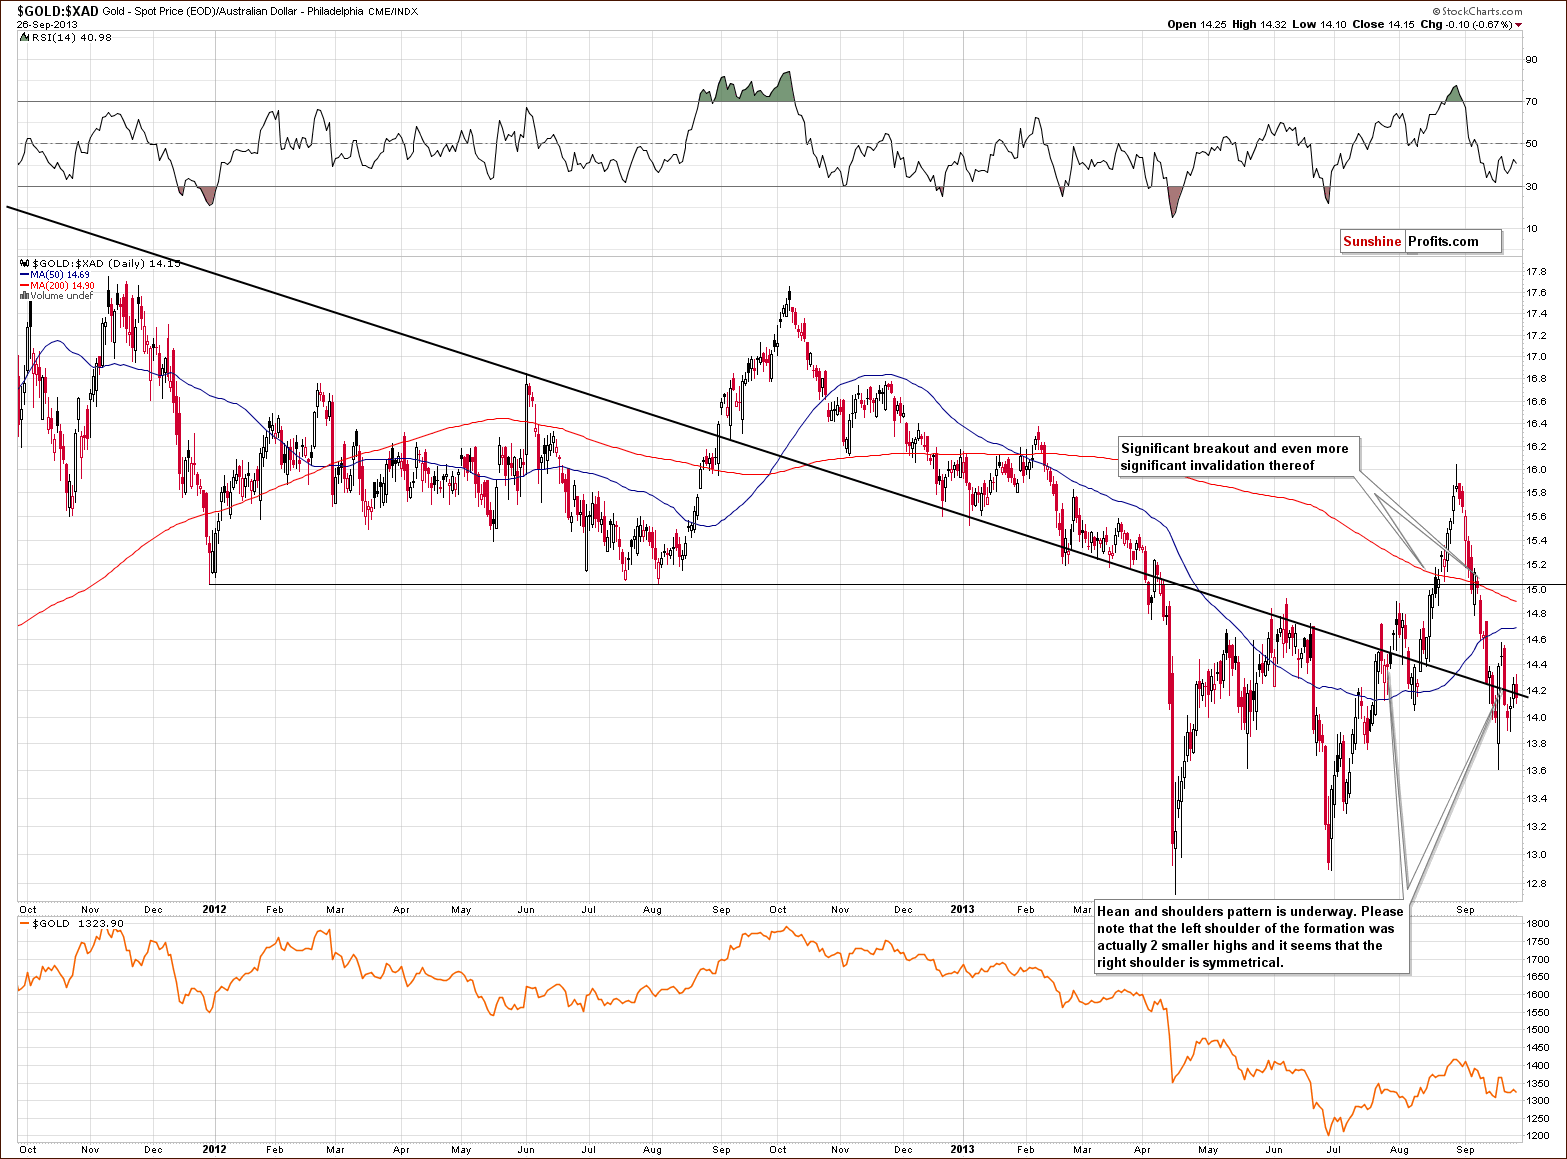
On the above chart, we see that there was a significant breakout above the long-term declining resistance/support line in mid-August, which resulted in a rally to slightly below the February high. In spite this upside move, the improvement didn’t last long, and we saw a sharp decline at the end of August and into September. With this move, gold priced in Australian dollars dropped below the broken resistance/support line once again, invalidating the breakout above this line.
As you see on the above chart, there is a bearish head and shoulders formation underway, which may result in further declines in the near future. In this case, we could see a strong corrective move, one which would likely push gold’s price all the way back down to the April bottom area. Actually, we could even see a move below the April lows, because gold seen from this perspective is actually no longer strong versus gold priced in the US dollar.
Therefore, from this point of view, the implications are bearish.
Summing up, the medium-term outlook for gold remains bearish. Despite last week’s show of strength, the downward trend is not threatened at the moment.
Silver
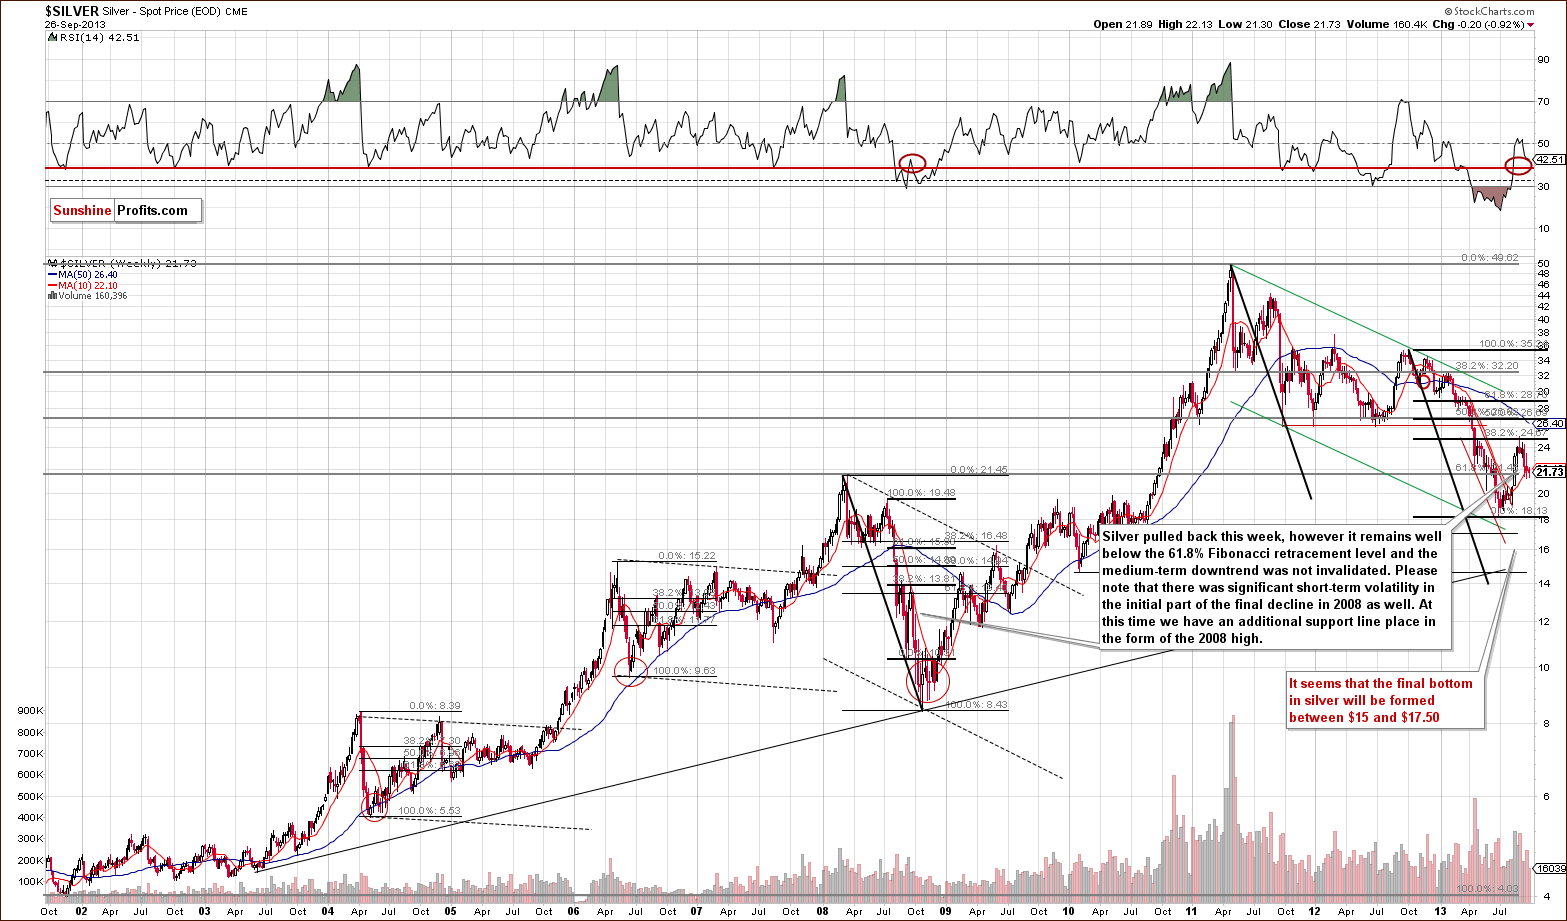
When we take a look at the above chart, we see that silver declined to the 2008 high, which now serves as support. Therefore, we could see a short-term upswing if we have a bullish signal from gold or a bearish one from the USD Index. Even if we see a rally (that doesn’t take silver much above the recent high), this will not invalidate the bearish medium-term outlook, because back in 2008, we saw significant volatility before the final downswing completed.
Taking this into account, the medium-term trend is still down, and silver remains visibly below the 32.8% Fibonacci retracement level based on the entire September 2012 - June 2013 decline.
Now, let’s move to the short-term chart to see the recent price moves more clearly.
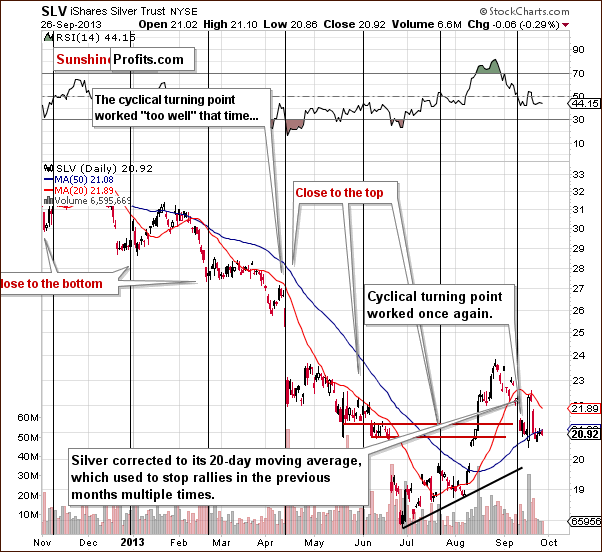
On the above chart, we see that the situation has deteriorated in recent days.
Quoting our last Premium Update:
(…) silver pulled back after the cyclical turning point and reached the 20-day moving average on Wednesday. Please note that this moving average was seen to stop rallies multiple times in previous months. If history repeats itself, we will likely see a downward move.
As you see on the above chart, we had such a type of price action this week. There was a downward move, which erased almost all last week’s gains, and SLV dropped below $21, which is not a positive sign for the bulls.
From the current market situation, we see that silver moved up right after the cyclical turning point (after comments from the Fed, which were an important influence, but perhaps the proximity of the turning point was what made this upswing so significant), and it seems that what was likely to happen based on it - has already happened. Consequently, it seems that the medium-term trend in silver is still down, and the same goes for the short term.
Please note that there was low volume in recent days, but the rally itself was very small as well. Therefore, it’s difficult to say whether this is bearish sign or not.
Summing up, the outlook for the white metal remains bearish for the medium term, though the short-term is rather unclear.
Gold and Silver Mining Stocks
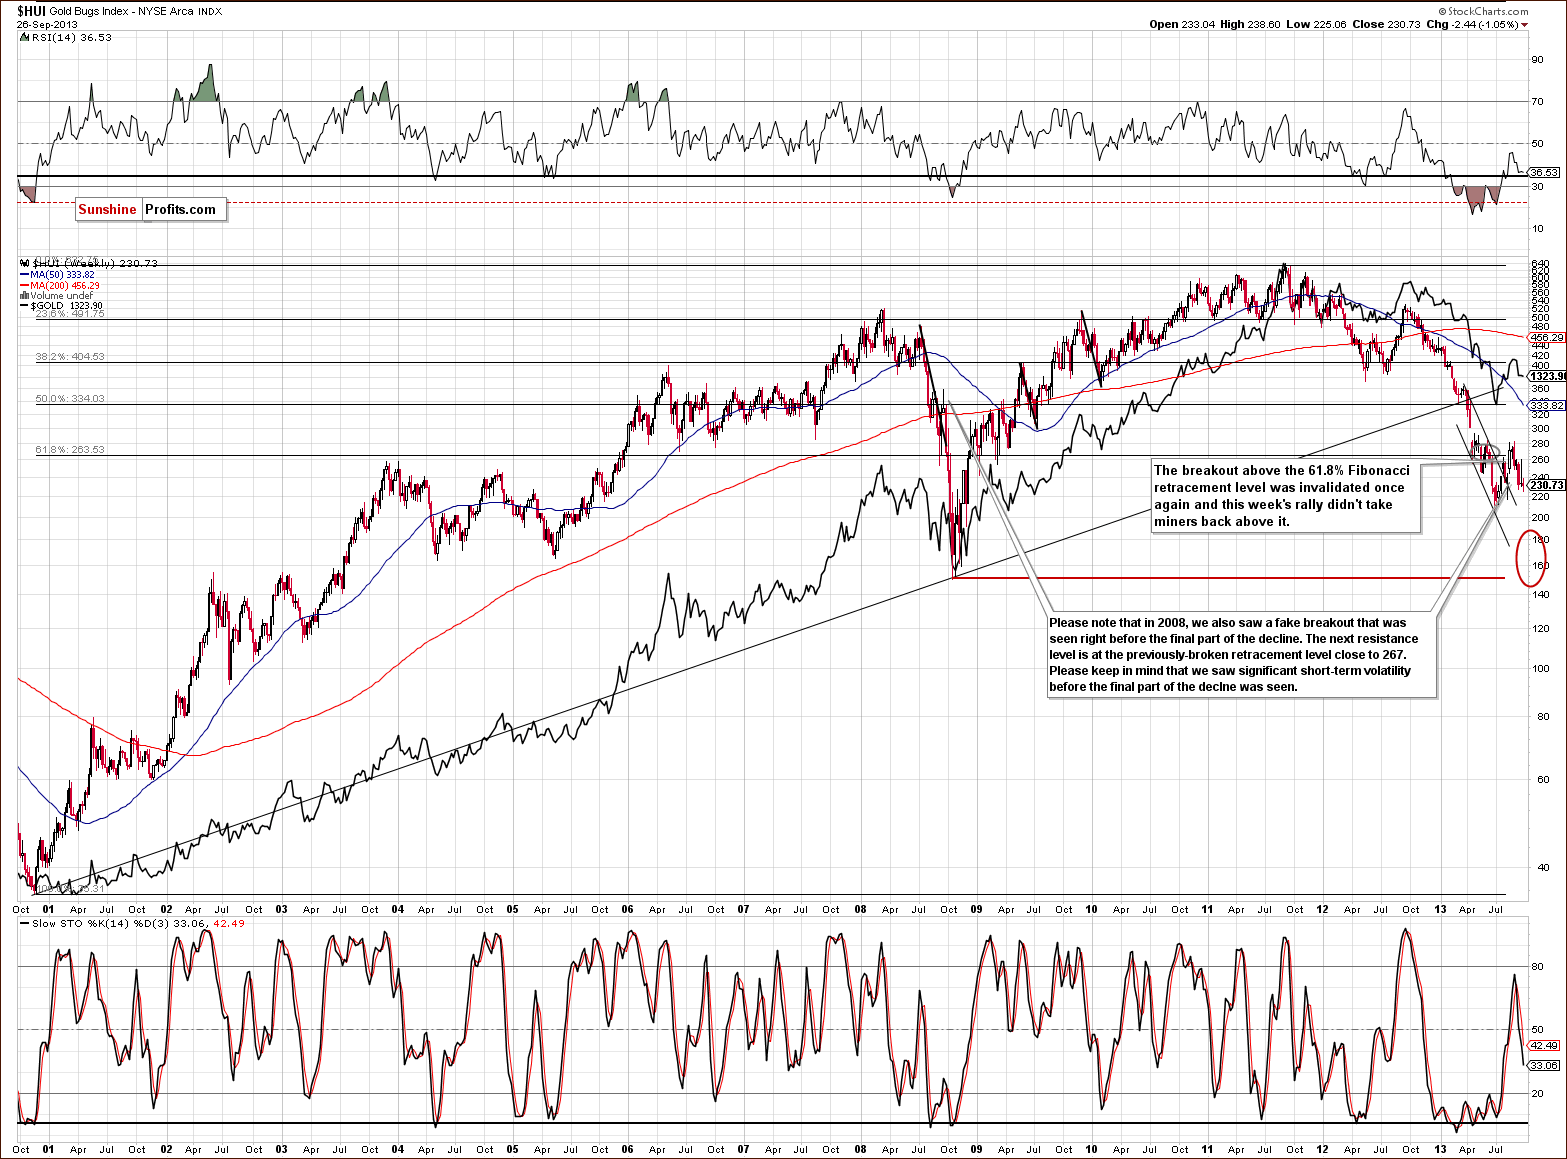
In this week’s very long-term HUI index chart (a proxy for the gold stocks) the situation hasn’t changed much – the index declined by 2.44.
As we wrote in our previous Premium Update:
Although, there was another attempt to move above the 61.8% retracement level, it also failed, just like the previous ones. In this way, the mining stocks returned to below the above-mentioned retracement level (at approximately 267), and still remain below it.
From today’s point of view, we clearly see that the situation hasn’t changed. From the long-term perspective, the implications are therefore bearish once again, and the trend remains down.
Now, let’s move on to the juniors sector.
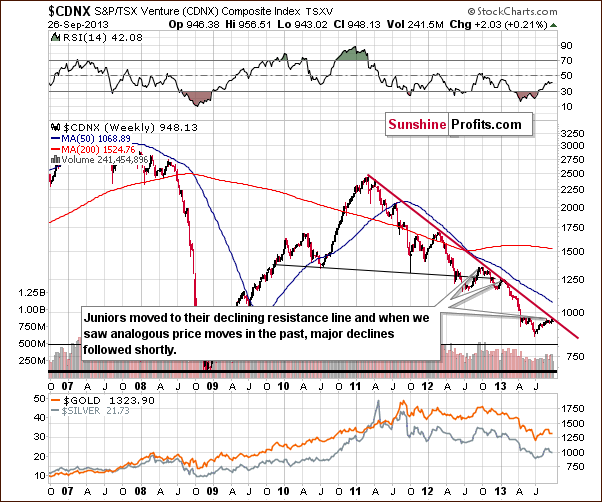
In the Toronto Stock Exchange Venture Index (which is a proxy for the junior miners as so many of them are included in it), we see that after several weeks of sideways trading, juniors moved to the declining resistance line based on the March 2011, March 2012 and January 2013 highs. It’s worth mentioning that in the past when we saw analogous price moves, they all resulted in major declines.
If we see similar price action here, it will probably lead to a continuation of the downward move – and this seems very likely.
Before we summarize, let’s examine the GDX ETF chart.
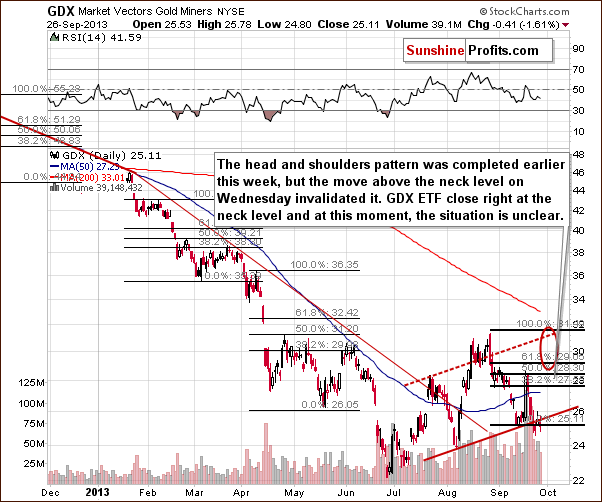
On the above short-term chart, we see that there was a strong decline in the past few days, which pushed mining stocks below their September 13 low. Because of this, the head and shoulders pattern was completed earlier this week. However, on Wednesday, we saw a move above the neck level, which invalidated this pattern.
Please note that we may see another upward move towards the September 18 high or even close to the August top (the area marked with a red ellipse). If it happens, we will likely see a bigger right shoulder. If this forms on low volume, we will have an indication that this bearish formation will probably complete in the following days. In this case, we could decide to open short positions. The situation here is quite analogous to the one seen on the gold market.
As long as there is no confirmed breakout above the August 28 high, the implications are bearish.
Summing up, the outlook for the mining stocks remains bearish, and the trend is still down. The long-term tendencies seem to be most important at this time, even for short-term price moves. Miners still remain below the 61.8% Fibonacci retracement level, and the head and shoulders pattern is still likely to form.
Summary
The USD Index is at a critical juncture, as it could rally or decline visibly in the coming days. The outlook for the general stock market is bearish for the medium term. This suggests that – given the recent correlation between the precious metals sector and the general stock market – we will see higher values of gold, silver and mining stocks in the very short term, even though the medium-term trend is still down. This move – if it is small and/or materializes on low volume – will serve as a bearish confirmation and perhaps a reason for us to suggest opening short positions, and maybe limiting the long-term investment exposure to the precious metals sector. None of the above is the case so far. We need to be careful, as the fundamental situation is still positive.
In short, it seems that precious metals will decline shortly and we are close to opening short positions, but not at that point just yet.
Trading – PR: No positions.
Trading – SP Indicators: No positions: SP Indicators suggest long positions, but the new self-similarity-based tool suggests short ones for the precious metals sector. We think that overall they cancel each other out.
Long-term investments: A half position in gold, silver, platinum and mining stocks. As far as long-term mining stock selection is concerned, we suggest using our tools before making purchases: the Golden StockPicker and the Silver StockPicker
| Portfolio's Part | Position | Stop-loss / Expiry Date |
|---|---|---|
| Trading: Mining stocks | No positions | - |
| Trading: Gold | No positions | - |
| Trading: Silver | No positions | - |
| Long-term investments: Gold | Long - half | - |
| Long-term investments: Silver | Long - half | - |
| Long-term investments: Platinum | Long - half | - |
| Long-term investments: Mining Stocks | Long - half | - |
This completes this week’s Premium Update. Our next Premium Update is scheduled for Thursday, Oct 3, 2013 (one day ahead of our regular schedule). We will continue to send out Market Alerts on a daily basis (except for when Premium Updates are posted) at least until the end of October, 2013 and we will send additional Market Alerts whenever appropriate.
Thank you for using the Premium Service.
Sincerely,
Przemyslaw Radomski, CFA

