

Briefly: In our opinion, full (150% of the regular full position) speculative short positions in gold, silver and mining stocks are justified from the risk/reward perspective at the moment of publishing this alert.
In yesterday’s alert we discussed the possibility of seeing an upswing in the precious metals sector, in particular, in the case of the mining stocks (as this was the part of the sector that showed strength) and since a kind of an upswing is indeed taking place (at least in the latter), in today’s alert we continue with yesterday’s analysis. We also discuss when betting on higher prices appears justified and when it doesn’t.
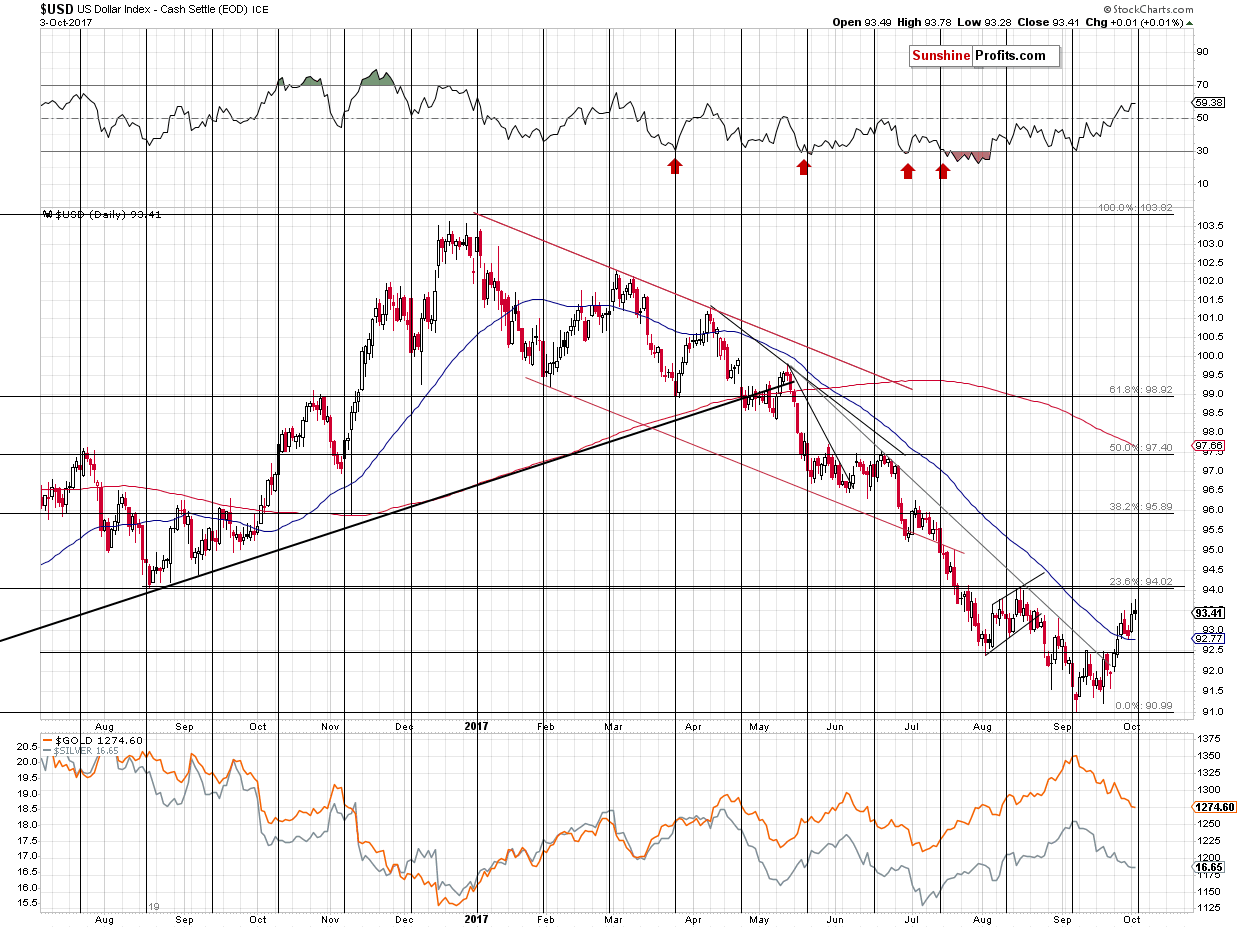
Let’s start with the USD Index chart (chart courtesy of http://stockcharts.com).
In the September 29 Gold & Silver Trading Alert, we wrote the following:
The thing that we would like to discuss today in greater detail is the possible temporary target for the USD Index – the 94 level. The first Fibonacci retracement that we see on the above chart (23.6% - it’s less popular than the classic 38.2%, 50% and 61.8% trio, but still quite useful) is at about 94 and it is strengthened by the August extremes – the August 2016 low and the August 2017 high.
The cyclical turning point is also just around the corner, so it could be the case that the USD takes a breather once it moves to the 94 level in the first days of October. It’s not guaranteed or even very likely (USD could soar through this resistance as it just was oversold from the long-term point of view), but this price-time combination appears more likely than other nearby price/time combinations, so we thought it might be useful for you to be aware of the possibility of a pause here. It’s unlikely to change the uptrend in the USD and the downtrend in the precious metals sector.
In yesterday’s issue, we added the following:
The above remains up-to-date and since today’s pre-market high was 93.92 (Bloomberg data), it seems that the correction could start any day now. Is it likely to be significant enough for one to justify adjusting the trading position? In our view, it’s not really justified, unless one is a day-trader. The USD Index could decline to about 92.5, in a move that would mirror the early August rally.
At the moment of writing these words, the USD is already about 0.2 below the high and gold reacted by moving about $1 higher from its pre-market low. If this link persists, another 1.3 slide in the USD Index would correspond to an $8 upswing in the price of gold. That’s a relatively small move, which doesn’t seem to be worth trading (the risk of a quick downturn is too significant).
At the moment of writing these words, the USD Index is at 93.34, so it seems that about 1/3 of the possible (but not necessarily probable) correction is behind us. How did gold respond?
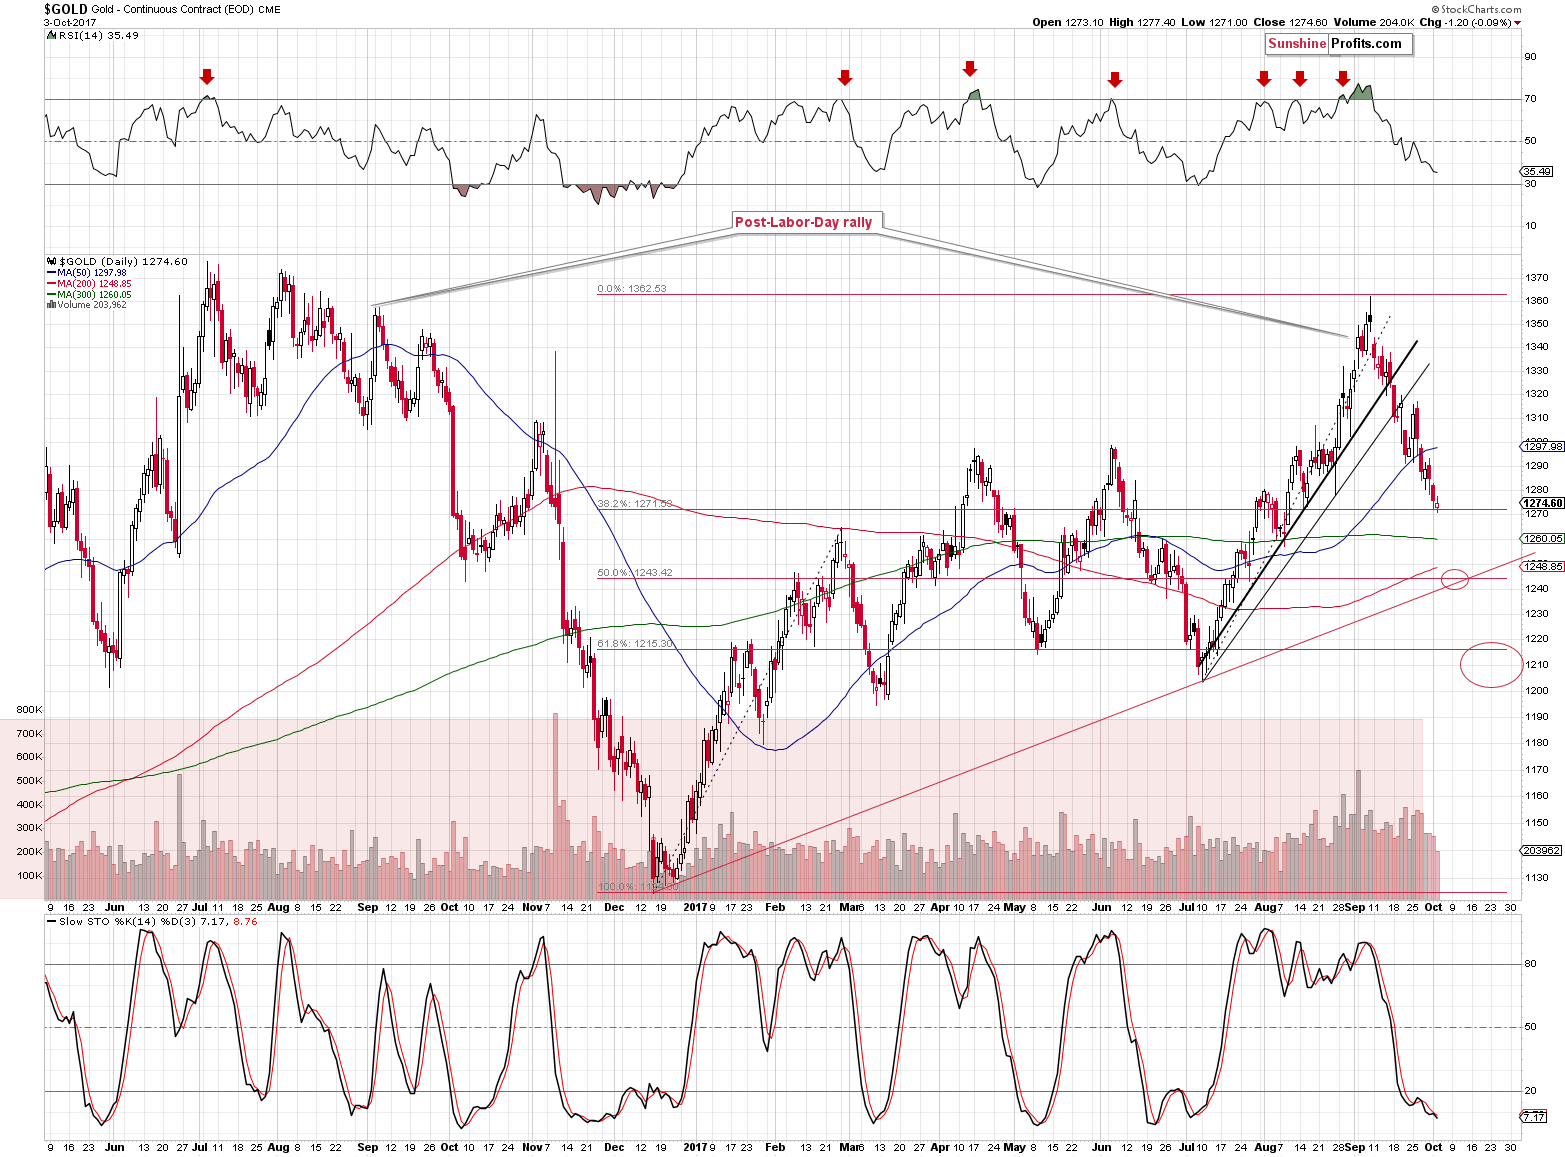
Yesterday, it responded very little and today it’s trading at about $1,280. That’s a $11-$12 rally from yesterday’s pre-market low. If 1/2 of the move is behind us, we could see another $12-$13 move higher or so, which would get gold a bit above $1,290. That’s more or less in tune with what we wrote yesterday:
Such a move would mean gold at about $1,277 (today’s pre-market low was at about $1,268). However, given gold’s previous daily extremes just below $1,300, it could be the case that it rallies to $1,290 - $1,300, as that’s where we have the closest resistance area.
The above chart features another reason for a temporary corrective upswing – the 38.2% Fibonacci retracement. This retracement is not strengthened by any other support level, so it’s not that strong and reliable.
So, gold could move a bit higher here, but today’s gold-USD link doesn’t suggest anything important on the horizon with regard to the size of such a move.
We added one more important thing to the above chart that could generate a more visible upswing – the rising support line, which is currently at about $1,240. It’s crossing the 50% Fibonacci retracement at about $1,244, so this level or its proximity could trigger a bigger rebound. Depending on the confirmations that we get at that time and the way gold approaches this level, we might adjust the current trading position based on it.
In a perfect bullish scenario, gold would drop sharply, but miners would show strength and decline just a little. At the same time, the RSI could get below 30. In other words, a great short-term (and most likely only short-term) bullish case would be similar to what we saw in early October last year.
In a bearish scenario gold would rally sharply right now and then gradually, steadily decline toward $1,244 with miners moving in tune with it or even underperforming it. In this case, the RSI alone might not be enough to trigger a bigger reversal, just like it wasn’t able to do so last November.
Moving back to the current situation, even the continuation of the rally to $1,290 or so is not so certain. The move higher in gold is probably (nobody can say for sure what caused a given up- or downswing with very few exceptions) entirely or almost entirely caused by the correction in the USD and the 92.5 level is not the very likely target, but the lowest of what we think is likely at this time. The USD just broke back above the long-term lows and it could be verifying this move by trading back and forth above these lows.
The key nearby lows in both: intraday and closing price terms are:
- May 2015: 93.17 and 93.18
- June 2015: 93.30 (intraday)
- August 2015: 92.52 and 93.36
- May 2016: 91.88 and 92.62
4 out of the 7 mentioned support levels are above 93 and the highest of them is at 93.30. Today’s pre-market low was 93.327, so the corrective downswing could already be over. Is it worth betting on a continuation of the USD’s decline and, in consequence, on gold’s short-term corrective upswing? It doesn’t seem worth it from our point of view, but it might still be something to consider for day-traders.
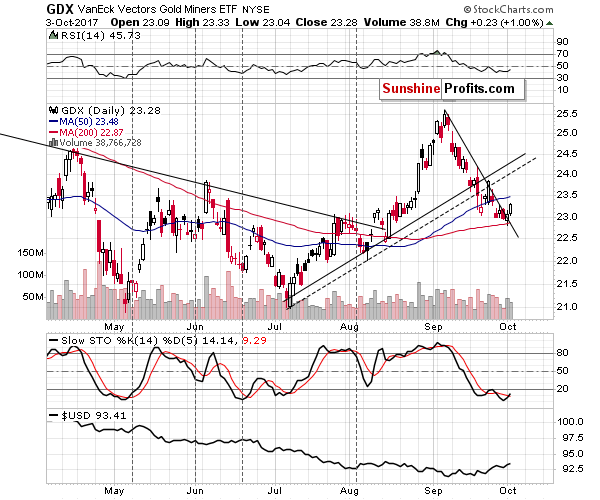
Mining stocks moved higher and the action in the GDX ETF looks positive as the volume was not low.
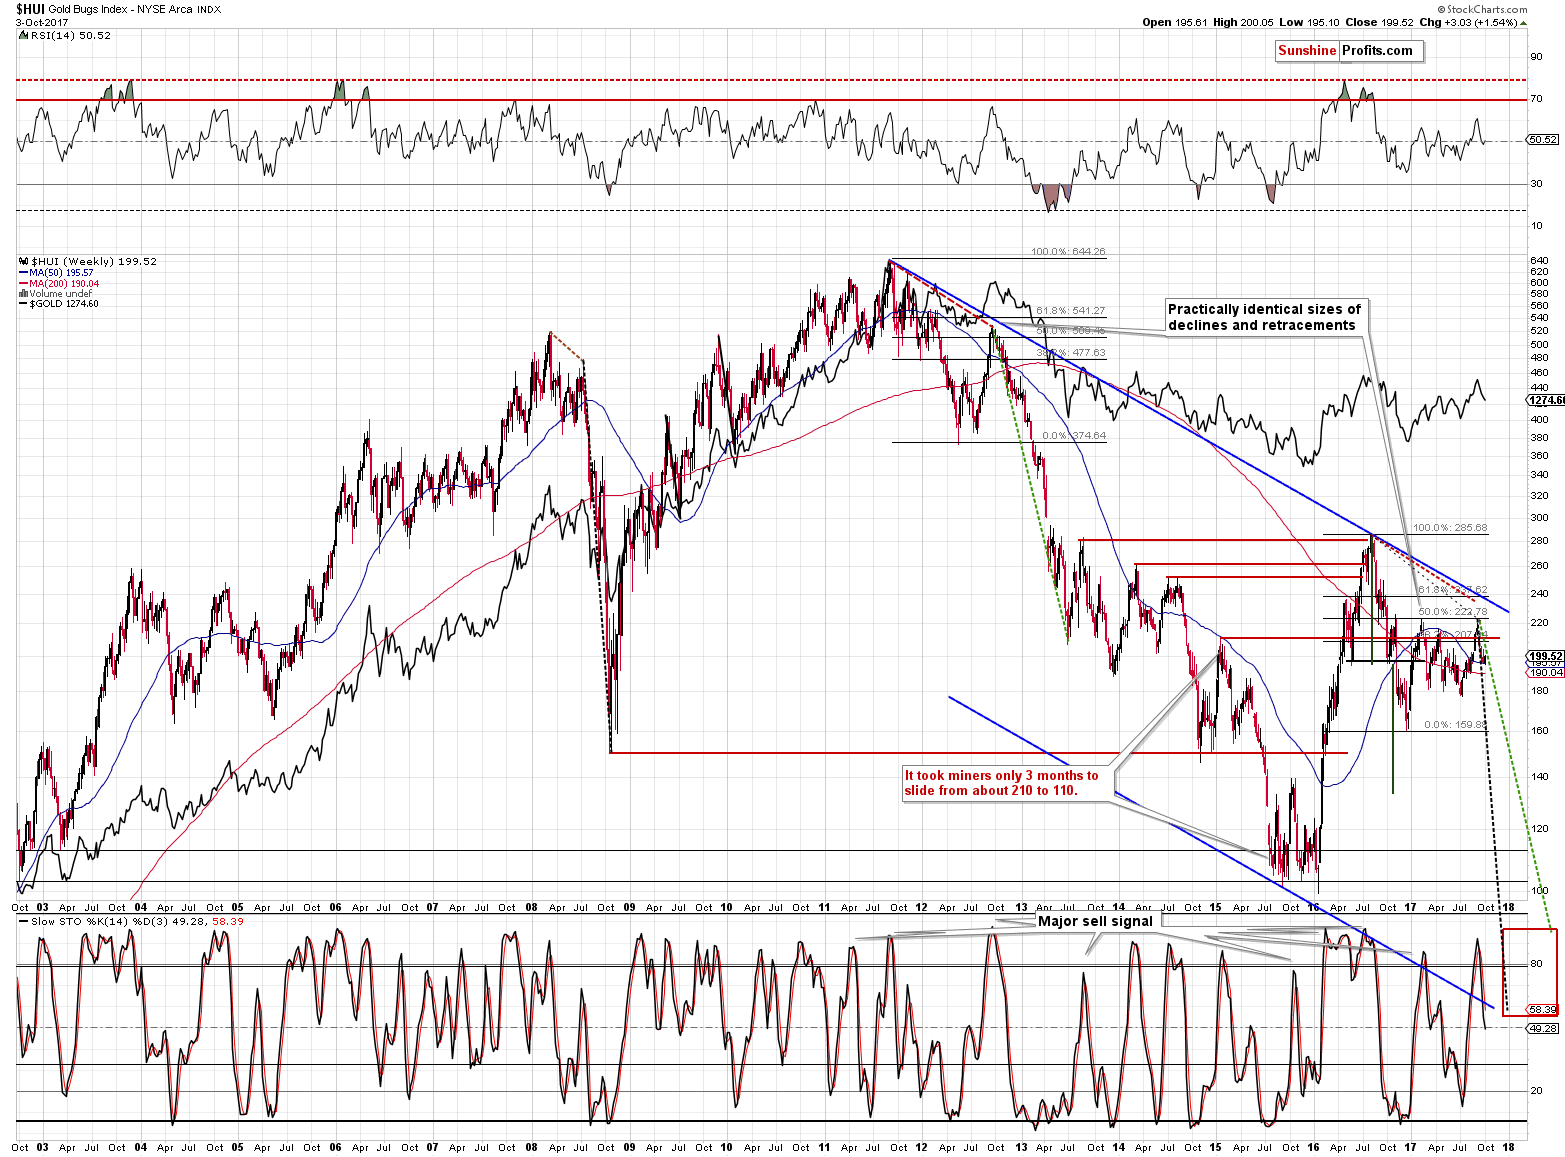
From the long-term point of view, however, we see that this upswing could be tricky and very short-lived. There was also a short-term rally in the early part of the 2012-2013 decline and the price reversed very quickly. Just before the end of 2012 the HUI traded at about 420, and it rallied to 455 in about a week, but it took just one session to take the HUI back to about 430, so it was very risky to enter a long position at that time. Moreover, this price action started a multi-month plunge and higher prices have not been seen ever since that time.
So far, the HUI Index’s decline continues between the 2 dashed lines, which means that the current downswing is more or less in tune with the previous huge declines: the 2008 and the 2012-2013 ones. Please note that even a move a bit above the green dashed line would not invalidate the analogy as the price of the HUI Index was above it for the decline in 2013 as well (it accelerated in the final part of the slide).
Summing up, there are multiple strong, long-term signals pointing to much lower prices of precious metals in the following weeks and months, and there are a few relatively weak bullish signs pointing to a small corrective upswing in the next few days. Overall, it doesn’t seem that adjusting the trading position is justified at this time (unless one is day-trading – in this case, mining stocks could provide a trading opportunity) – it seems that it would add risk (of missing a volatile slide), while not providing much of a potential profit. It might become justified (even to a point of entering a small long position) if we get additional bullish signs, though, for instance if gold moves below $1,250.
As always, we will keep you – our subscribers – informed.
To summarize:
Trading capital (supplementary part of the portfolio; our opinion): Short positions (150% of the full position) in gold, silver and mining stocks are justified from the risk/reward perspective with the following stop-loss orders and initial target price levels / profit-take orders:
- Gold: initial target price level: $1,063; stop-loss: $1,366; initial target price for the DGLD ETN: $81.88; stop-loss for the DGLD ETN $38.74
- Silver: initial target price: $13.12; stop-loss: $19.22; initial target price for the DSLV ETN: $46.18; stop-loss for the DSLV ETN $17.93
- Mining stocks (price levels for the GDX ETF): initial target price: $9.34; stop-loss: $26.34; initial target price for the DUST ETF: $143.56; stop-loss for the DUST ETF $21.37
In case one wants to bet on junior mining stocks' prices (we do not suggest doing so – we think senior mining stocks are more predictable in the case of short-term trades – if one wants to do it anyway, we provide the details), here are the stop-loss details and initial target prices:
- GDXJ ETF: initial target price: $14.13; stop-loss: $45.31
- JDST ETF: initial target price: $417.04; stop-loss: $43.12
Long-term capital (core part of the portfolio; our opinion): No positions (in other words: cash)
Insurance capital (core part of the portfolio; our opinion): Full position
Important Details for New Subscribers
Whether you already subscribed or not, we encourage you to find out how to make the most of our alerts and read our replies to the most common alert-and-gold-trading-related-questions.
Please note that the in the trading section we describe the situation for the day that the alert is posted. In other words, it we are writing about a speculative position, it means that it is up-to-date on the day it was posted. We are also featuring the initial target prices, so that you can decide whether keeping a position on a given day is something that is in tune with your approach (some moves are too small for medium-term traders and some might appear too big for day-traders).
Plus, you might want to read why our stop-loss orders are usually relatively far from the current price.
Please note that a full position doesn’t mean using all of the capital for a given trade. You will find details on our thoughts on gold portfolio structuring in the Key Insights section on our website.
As a reminder – “initial target price” means exactly that – an “initial” one, it’s not a price level at which we suggest closing positions. If this becomes the case (like it did in the previous trade) we will refer to these levels as levels of exit orders (exactly as we’ve done previously). Stop-loss levels, however, are naturally not “initial”, but something that, in our opinion, might be entered as an order.
Since it is impossible to synchronize target prices and stop-loss levels for all the ETFs and ETNs with the main markets that we provide these levels for (gold, silver and mining stocks – the GDX ETF), the stop-loss levels and target prices for other ETNs and ETF (among other: UGLD, DGLD, USLV, DSLV, NUGT, DUST, JNUG, JDST) are provided as supplementary, and not as “final”. This means that if a stop-loss or a target level is reached for any of the “additional instruments” (DGLD for instance), but not for the “main instrument” (gold in this case), we will view positions in both gold and DGLD as still open and the stop-loss for DGLD would have to be moved lower. On the other hand, if gold moves to a stop-loss level but DGLD doesn’t, then we will view both positions (in gold and DGLD) as closed. In other words, since it’s not possible to be 100% certain that each related instrument moves to a given level when the underlying instrument does, we can’t provide levels that would be binding. The levels that we do provide are our best estimate of the levels that will correspond to the levels in the underlying assets, but it will be the underlying assets that one will need to focus on regarding the signs pointing to closing a given position or keeping it open. We might adjust the levels in the “additional instruments” without adjusting the levels in the “main instruments”, which will simply mean that we have improved our estimation of these levels, not that we changed our outlook on the markets. We are already working on a tool that would update these levels on a daily basis for the most popular ETFs, ETNs and individual mining stocks.
Our preferred ways to invest in and to trade gold along with the reasoning can be found in the how to buy gold section. Additionally, our preferred ETFs and ETNs can be found in our Gold & Silver ETF Ranking.
As a reminder, Gold & Silver Trading Alerts are posted before or on each trading day (we usually post them before the opening bell, but we don't promise doing that each day). If there's anything urgent, we will send you an additional small alert before posting the main one.
=====
Latest Free Trading Alerts:
Yesterday, markets started to speculate that Fed Governor Jerome Powell could replace Chair Janet Yellen. What does it mean for the gold market?
=====
Hand-picked precious-metals-related links:
PRECIOUS-Gold gains as talk of dovish Fed chair knocks dollar
ETF Buyers Exit SPDR Gold as Fed Fears Eclipse Missile Mayhem
=====
In other news:
Wall Street slightly lower ahead of private jobs data
Fed chief needs "flexibility of mind" in tough times: Fischer
From Trumpflation to Deutsche-boom? Schaeuble exit raises market hopes
Catalonia to move to declare independence from Spain on Monday
Catalans Vow to Pursue Independence, Dismissing King’s ‘Mistake’
Spanish tensions bar Europe from global stocks party
Amazon Hit With $294 Million Bill in EU Tax Crackdown
Every single Yahoo account was hacked - 3 billion in all
Putin Says Oil Pact With OPEC May Be Extended to End of 2018
=====
Thank you.
Sincerely,
Przemyslaw Radomski, CFA
Founder, Editor-in-chief, Gold & Silver Fund Manager
Gold & Silver Trading Alerts
Forex Trading Alerts
Oil Investment Updates
Oil Trading Alerts

