

Briefly: In our opinion, full (150% of the regular full position) speculative short positions in gold, silver and mining stocks are justified from the risk/reward perspective at the moment of publishing this alert.
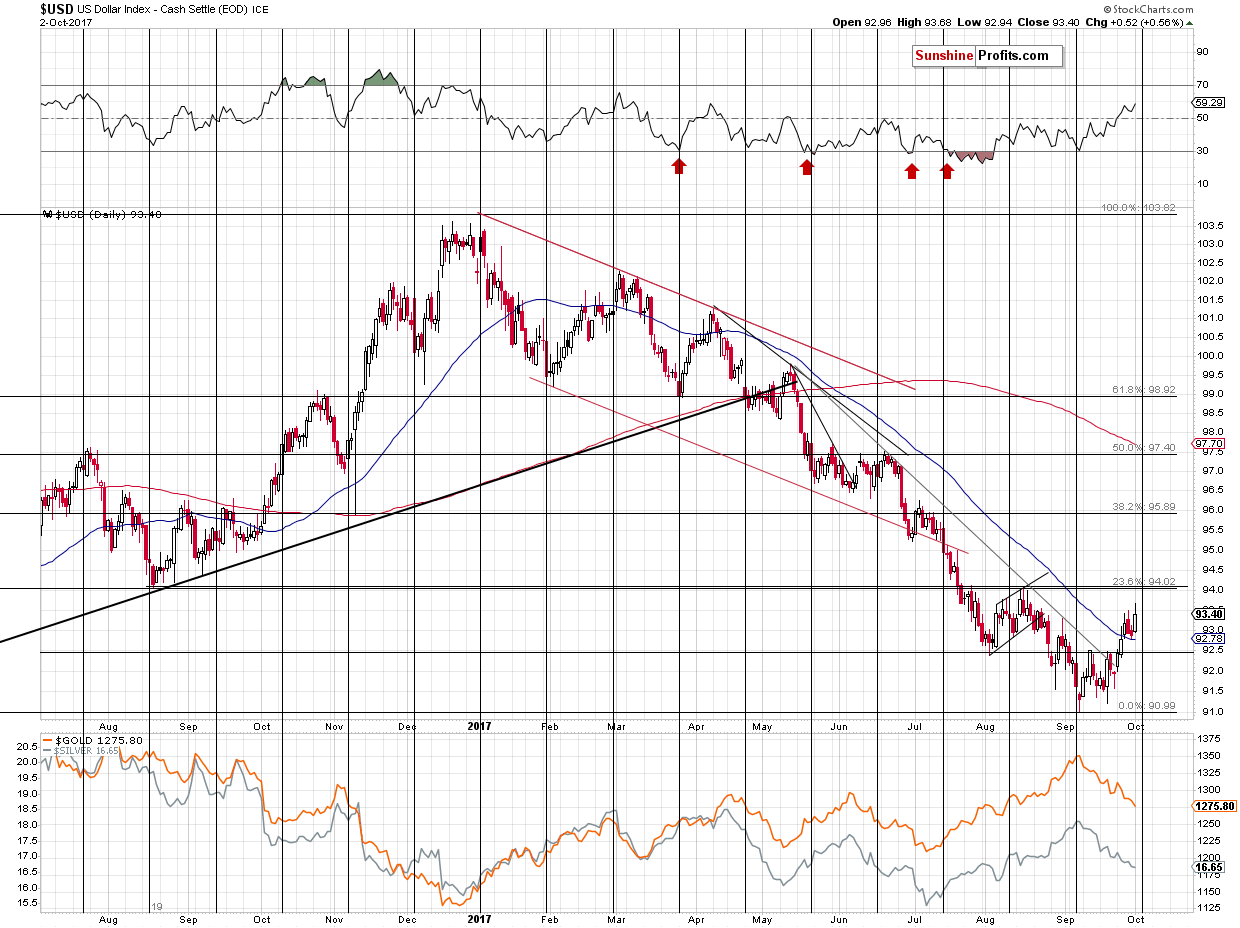
Today’s alert will not be as big as yesterday’s issue, as not much has changed since yesterday and we have already discussed the weekly closing prices. In today’s alert, we cover the possibility of a near-term correction in both precious metals and the USD Index as the latter is approaching the 94 level which we previously described as something that could keep the rally in check for a while. Let’s take a look at the USD chart for details (chart courtesy of http://stockcharts.com).
In the September 29 Gold & Silver Trading Alert, we wrote the following:
The thing that we would like to discuss today in greater detail is the possible temporary target for the USD Index – the 94 level. The first Fibonacci retracement that we see on the above chart (23.6% - it’s less popular than the classic 38.2%, 50% and 61.8% trio, but still quite useful) is at about 94 and it is strengthened by the August extremes – the August 2016 low and the August 2017 high.
The cyclical turning point is also just around the corner, so it could be the case that the USD takes a breather once it moves to the 94 level in the first days of October. It’s not guaranteed or even very likely (USD could soar through this resistance as it just was oversold from the long-term point of view), but this price-time combination appears more likely than other nearby price/time combinations, so we thought it might be useful for you to be aware of the possibility of a pause here. It’s unlikely to change the uptrend in the USD and the downtrend in the precious metals sector.
The above remains up-to-date and since today’s pre-market high was 93.92 (Bloomberg data), it seems that the correction could start any day now. Is it likely to be significant enough for one to justify adjusting the trading position? In our view, it’s not really justified, unless one is a day-trader. The USD Index could decline to about 92.5, in a move that would mirror the early August rally.
At the moment of writing these words, the USD is already about 0.2 below the high and gold reacted by moving about $1 higher from its pre-market low. If this link persists, another 1.3 slide in the USD Index would correspond to an $8 upswing in the price of gold. That’s a relatively small move, which doesn’t seem to be worth trading (the risk of a quick downturn is too significant).
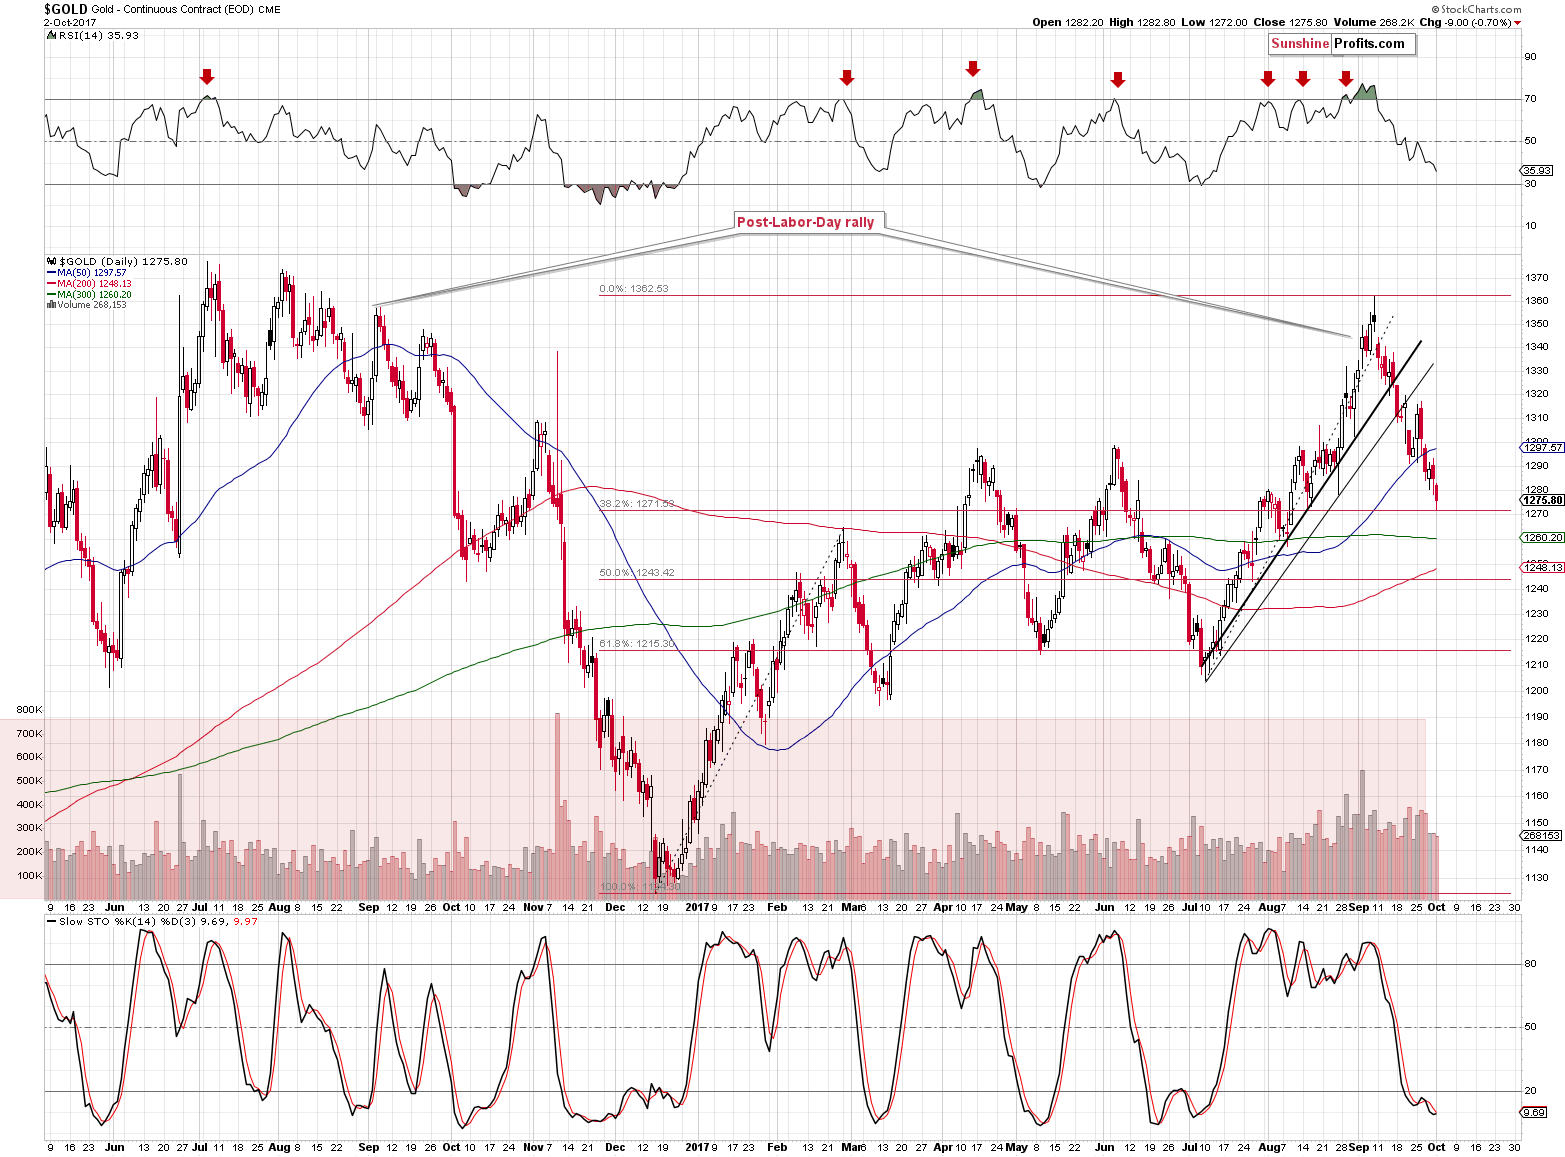
Such a move would mean gold at about $1,277 (today’s pre-market low was at about $1,268). However, given gold’s previous daily extremes just below $1,300, it could be the case that it rallies to $1,290 - $1,300, as that’s where we have the closest resistance area.
The above chart features another reason for a temporary corrective upswing – the 38.2% Fibonacci retracement. This retracement is not strengthened by any other support level, so it’s not that strong and reliable.
So, gold could move a bit higher here, but today’s gold-USD link doesn’t suggest anything important on the horizon with regard to the size of such a move.
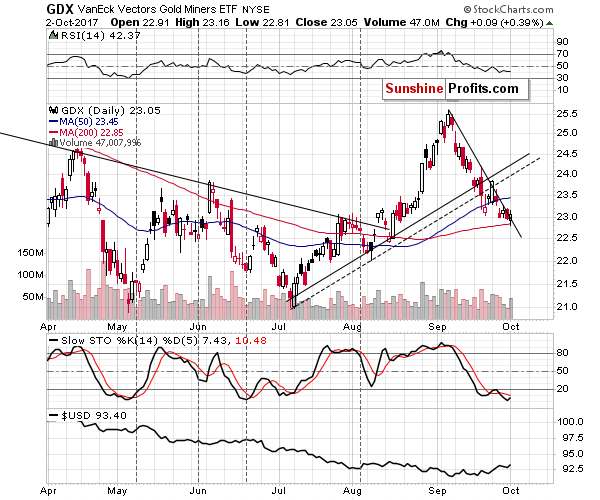
Mining stocks held up quite well yesterday despite a decline in gold and while it could be attributed to a rally in the general stock market, the relatively big volume accompanying the reversal, seems to suggest that we will see a corrective upswing shortly.
Still, that’s just one day of strength and if gold is about to move higher by only $8, then miners might just move back to their 50-day moving average and then continue to decline – that would not be a substantial move.
Summing up, there are multiple strong, long-term signals pointing to much lower prices of precious metals in the following weeks and months, and there are a few relatively weak bullish signs pointing to a small corrective upswing either right away or shortly. Overall, it doesn’t seem that adjusting the trading position is justified at this time, but it might become justified if we get an additional bullish sign.
As always, we will keep you – our subscribers – informed.
To summarize:
Trading capital (supplementary part of the portfolio; our opinion): Short positions (150% of the full position) in gold, silver and mining stocks are justified from the risk/reward perspective with the following stop-loss orders and initial target price levels / profit-take orders:
- Gold: initial target price level: $1,063; stop-loss: $1,366; initial target price for the DGLD ETN: $81.88; stop-loss for the DGLD ETN $38.74
- Silver: initial target price: $13.12; stop-loss: $19.22; initial target price for the DSLV ETN: $46.18; stop-loss for the DSLV ETN $17.93
- Mining stocks (price levels for the GDX ETF): initial target price: $9.34; stop-loss: $26.34; initial target price for the DUST ETF: $143.56; stop-loss for the DUST ETF $21.37
In case one wants to bet on junior mining stocks' prices (we do not suggest doing so – we think senior mining stocks are more predictable in the case of short-term trades – if one wants to do it anyway, we provide the details), here are the stop-loss details and initial target prices:
- GDXJ ETF: initial target price: $14.13; stop-loss: $45.31
- JDST ETF: initial target price: $417.04; stop-loss: $43.12
Long-term capital (core part of the portfolio; our opinion): No positions (in other words: cash)
Insurance capital (core part of the portfolio; our opinion): Full position
Important Details for New Subscribers
Whether you already subscribed or not, we encourage you to find out how to make the most of our alerts and read our replies to the most common alert-and-gold-trading-related-questions.
Please note that the in the trading section we describe the situation for the day that the alert is posted. In other words, it we are writing about a speculative position, it means that it is up-to-date on the day it was posted. We are also featuring the initial target prices, so that you can decide whether keeping a position on a given day is something that is in tune with your approach (some moves are too small for medium-term traders and some might appear too big for day-traders).
Plus, you might want to read why our stop-loss orders are usually relatively far from the current price.
Please note that a full position doesn’t mean using all of the capital for a given trade. You will find details on our thoughts on gold portfolio structuring in the Key Insights section on our website.
As a reminder – “initial target price” means exactly that – an “initial” one, it’s not a price level at which we suggest closing positions. If this becomes the case (like it did in the previous trade) we will refer to these levels as levels of exit orders (exactly as we’ve done previously). Stop-loss levels, however, are naturally not “initial”, but something that, in our opinion, might be entered as an order.
Since it is impossible to synchronize target prices and stop-loss levels for all the ETFs and ETNs with the main markets that we provide these levels for (gold, silver and mining stocks – the GDX ETF), the stop-loss levels and target prices for other ETNs and ETF (among other: UGLD, DGLD, USLV, DSLV, NUGT, DUST, JNUG, JDST) are provided as supplementary, and not as “final”. This means that if a stop-loss or a target level is reached for any of the “additional instruments” (DGLD for instance), but not for the “main instrument” (gold in this case), we will view positions in both gold and DGLD as still open and the stop-loss for DGLD would have to be moved lower. On the other hand, if gold moves to a stop-loss level but DGLD doesn’t, then we will view both positions (in gold and DGLD) as closed. In other words, since it’s not possible to be 100% certain that each related instrument moves to a given level when the underlying instrument does, we can’t provide levels that would be binding. The levels that we do provide are our best estimate of the levels that will correspond to the levels in the underlying assets, but it will be the underlying assets that one will need to focus on regarding the signs pointing to closing a given position or keeping it open. We might adjust the levels in the “additional instruments” without adjusting the levels in the “main instruments”, which will simply mean that we have improved our estimation of these levels, not that we changed our outlook on the markets. We are already working on a tool that would update these levels on a daily basis for the most popular ETFs, ETNs and individual mining stocks.
Our preferred ways to invest in and to trade gold along with the reasoning can be found in the how to buy gold section. Additionally, our preferred ETFs and ETNs can be found in our Gold & Silver ETF Ranking.
As a reminder, Gold & Silver Trading Alerts are posted before or on each trading day (we usually post them before the opening bell, but we don't promise doing that each day). If there's anything urgent, we will send you an additional small alert before posting the main one.
=====
Latest Free Trading Alerts:
On Sunday, there was an independence vote in Spain’s Catalonia. What does it mean for the gold market?
The current relations between North Korea and the U.S. have not been so tense for a long time. We invite you to read our today’s article about the recent tensions between these two countries and find out how the latest threats from North Korea could affect the gold market.
Will North Korea Boost Gold Prices? Part II
Although the price of black gold increased a bit on Friday, the commodity closed the whole week below important resistance lines and invalidated earlier breakouts. What does it mean for crude oil?
Will Crude Oil Drop under $50 in Coming Week?
S&P 500 index gained 0.4% on Friday, as it reached new record high close to the level of 2,520. Will uptrend continue? Or is this a topping pattern? Is holding medium-term short position justified?
Stocks At New Record High, Will They Continue Upwards?
=====
Hand-picked precious-metals-related links:
PRECIOUS-Stronger dollar pushes gold to 7-week low
Russia’s 10-Year Gold Itch Sends Its Hoard to Putin-Era Peak
China proven gold reserves at 12,100 tonnes at end-2016 - Xinhua
U.S. Mint Bullion Coin Sales Dip As Buyers Take Advantage Of Secondary Market
Perth Mint's Sept gold sales double on month, silver up 78 pct
Protesters block Goldcorp's top Peñasquito mine in Mexico
=====
In other news:
Dollar, stocks surge on U.S. economic outlook
Catalonia’s separatist calls add to a negative picture for the euro, traders say
Favorite to be next Fed chair believes central bank is a 'slave' to the stock market
Australia's central bank keeps rate at record low for 14th month straight
Cryptocurrency Flash Crash Draws Scrutiny From Watchdog
=====
Thank you.
Sincerely,
Przemyslaw Radomski, CFA
Founder, Editor-in-chief, Gold & Silver Fund Manager
Gold & Silver Trading Alerts
Forex Trading Alerts
Oil Investment Updates
Oil Trading Alerts

