

Briefly: In our opinion, full (150% of the regular full position) speculative short positions in gold, silver and mining stocks are justified from the risk/reward perspective at the moment of publishing this alert.
Today’s alert will be shorter than the previous ones and mostly USD-oriented as yesterday’s session on the precious metals market can be summarized very briefly: “low-volume pause”. Please take a look below for details (chart courtesy of http://stockcharts.com).
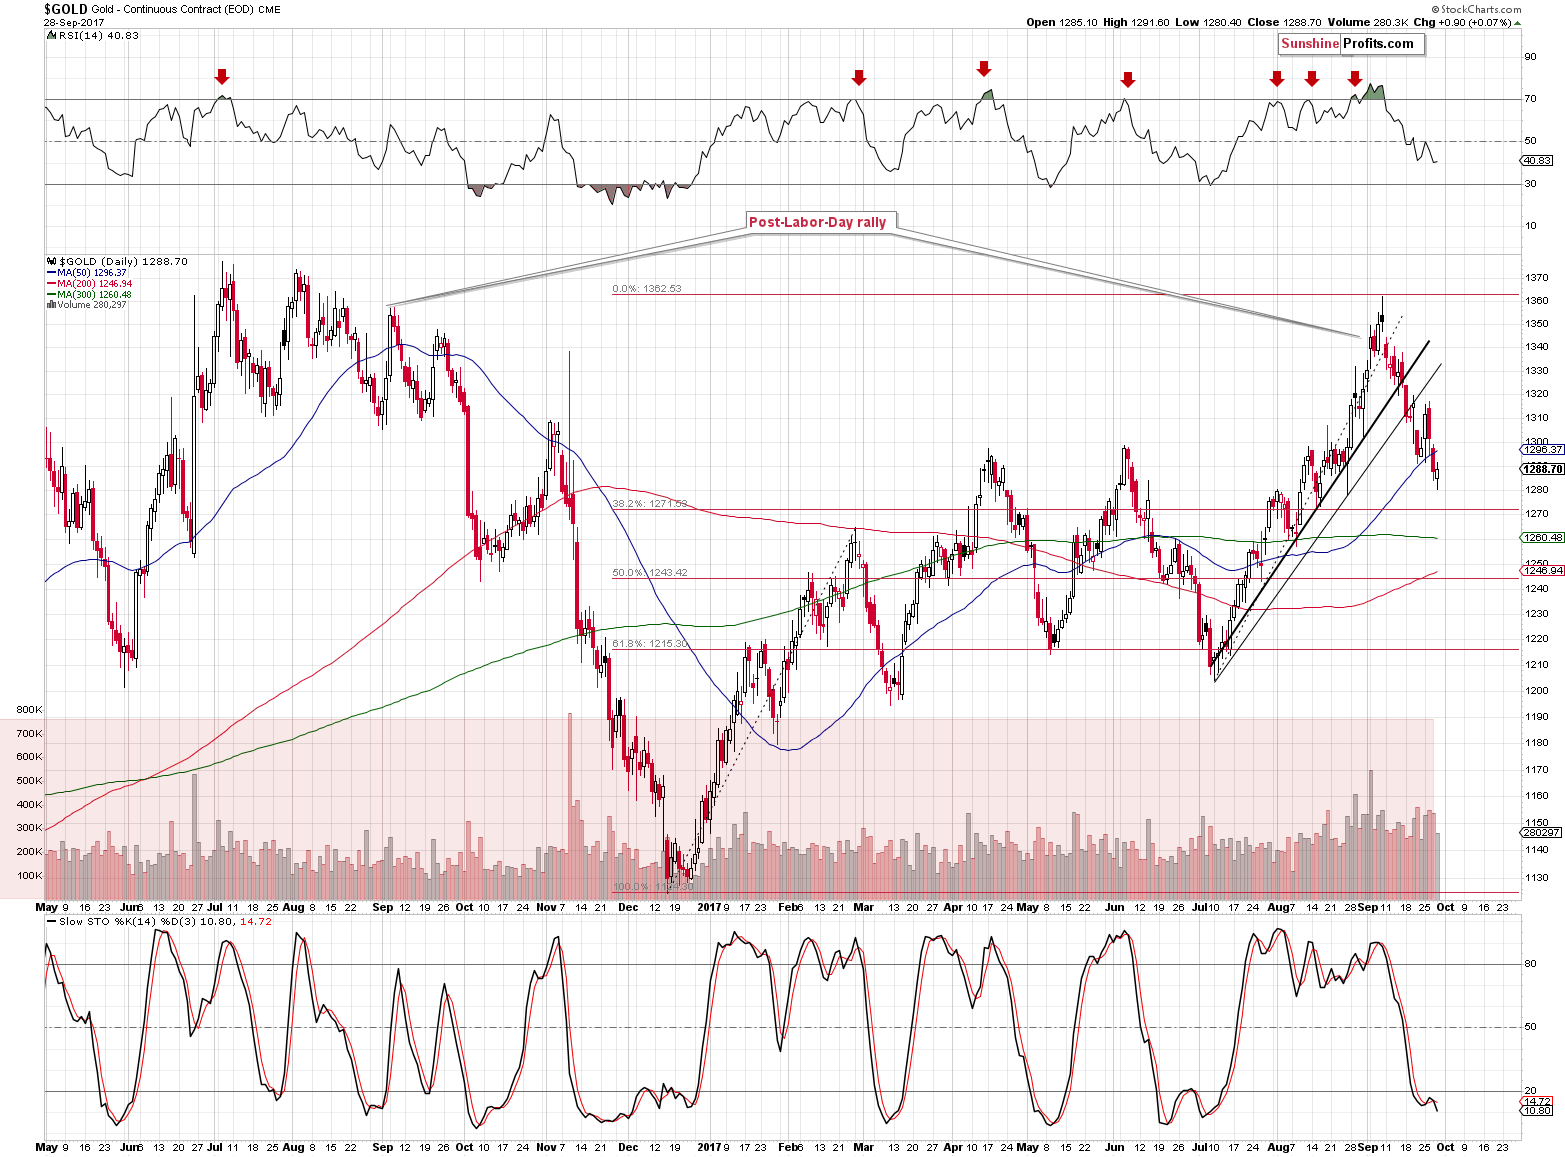
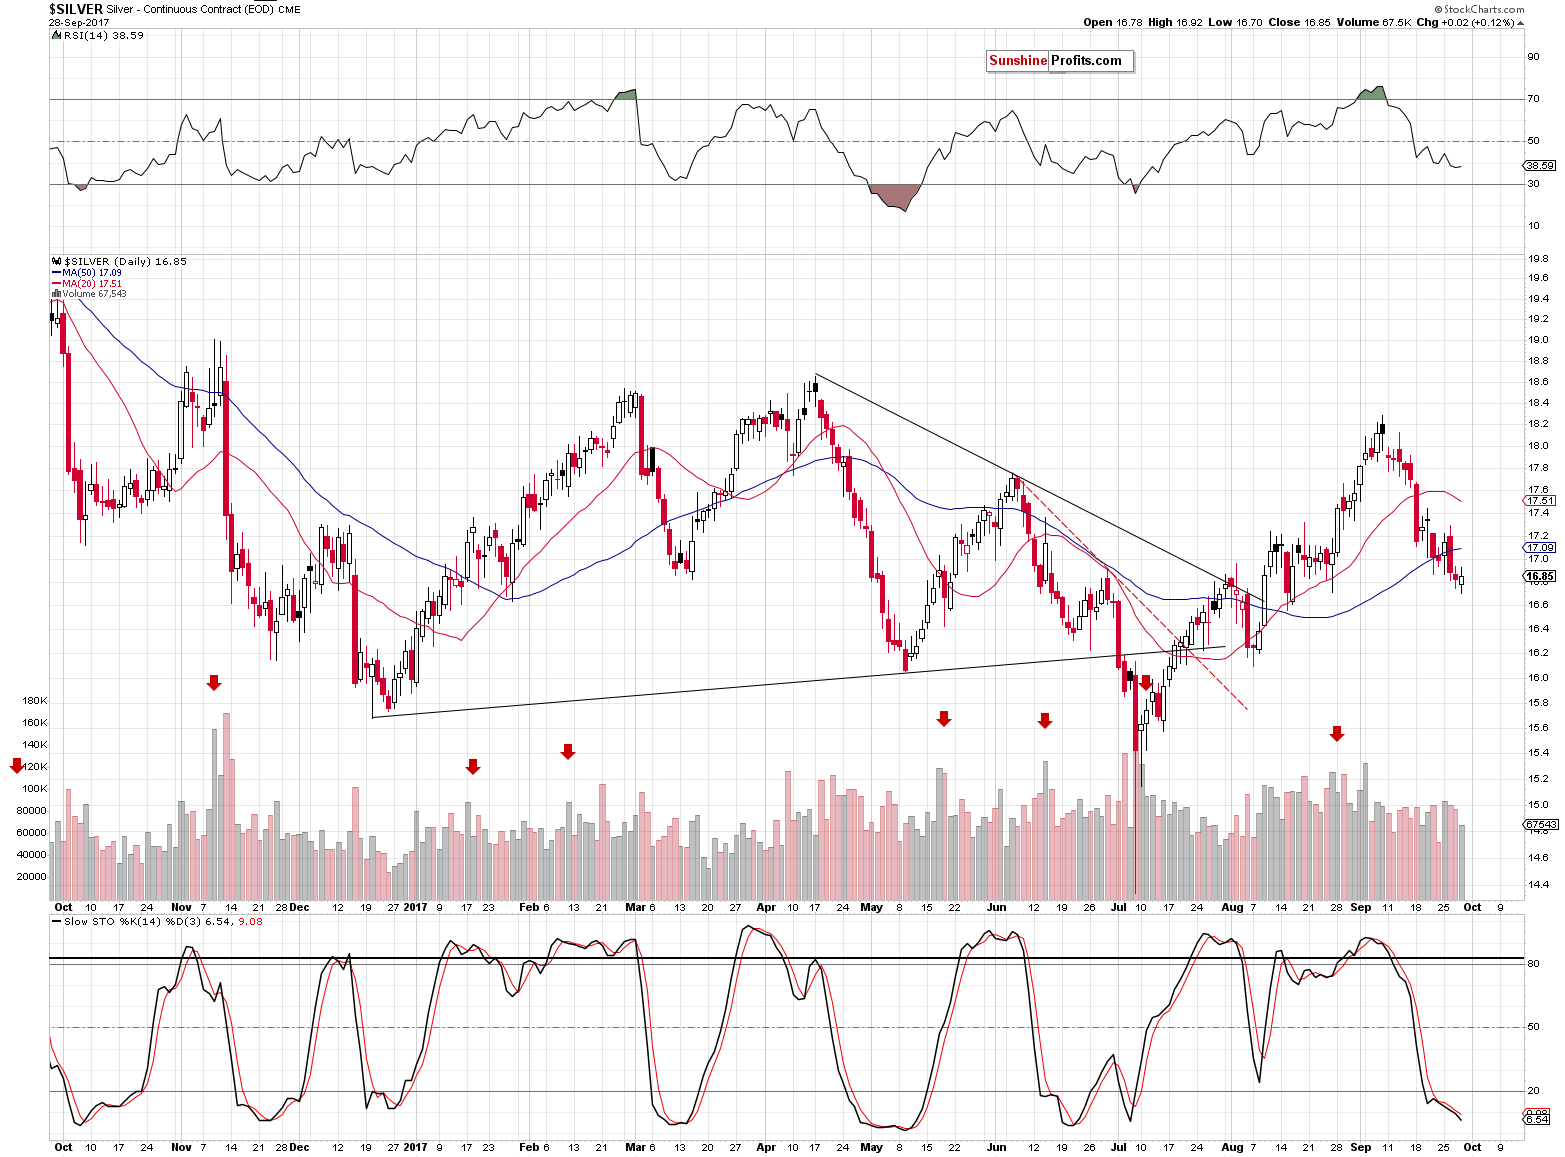
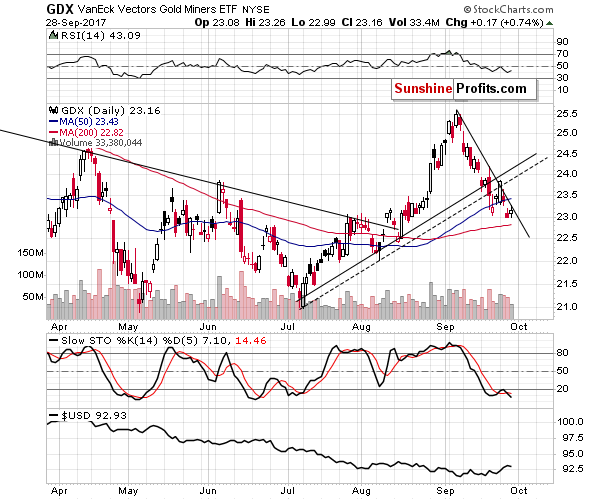
Gold, silver and mining stocks have all moved very little higher and the move – in all cases - was accompanied by relatively low volume. This means that yesterday’s session was just a pause within a bigger trend and the trend is currently down. The outlook, therefore, remains bearish.
The additional confirmation comes from the Stochastic indicator in gold and mining stocks, where it flashed another sell signal. The only reason that there was no sell signal on silver is that there previous sell signal is still in place (the indicator has been below its red moving average in case of silver, while it moved temporarily above it in case of gold and GDX).
In yesterday’s alert, we wrote the following:
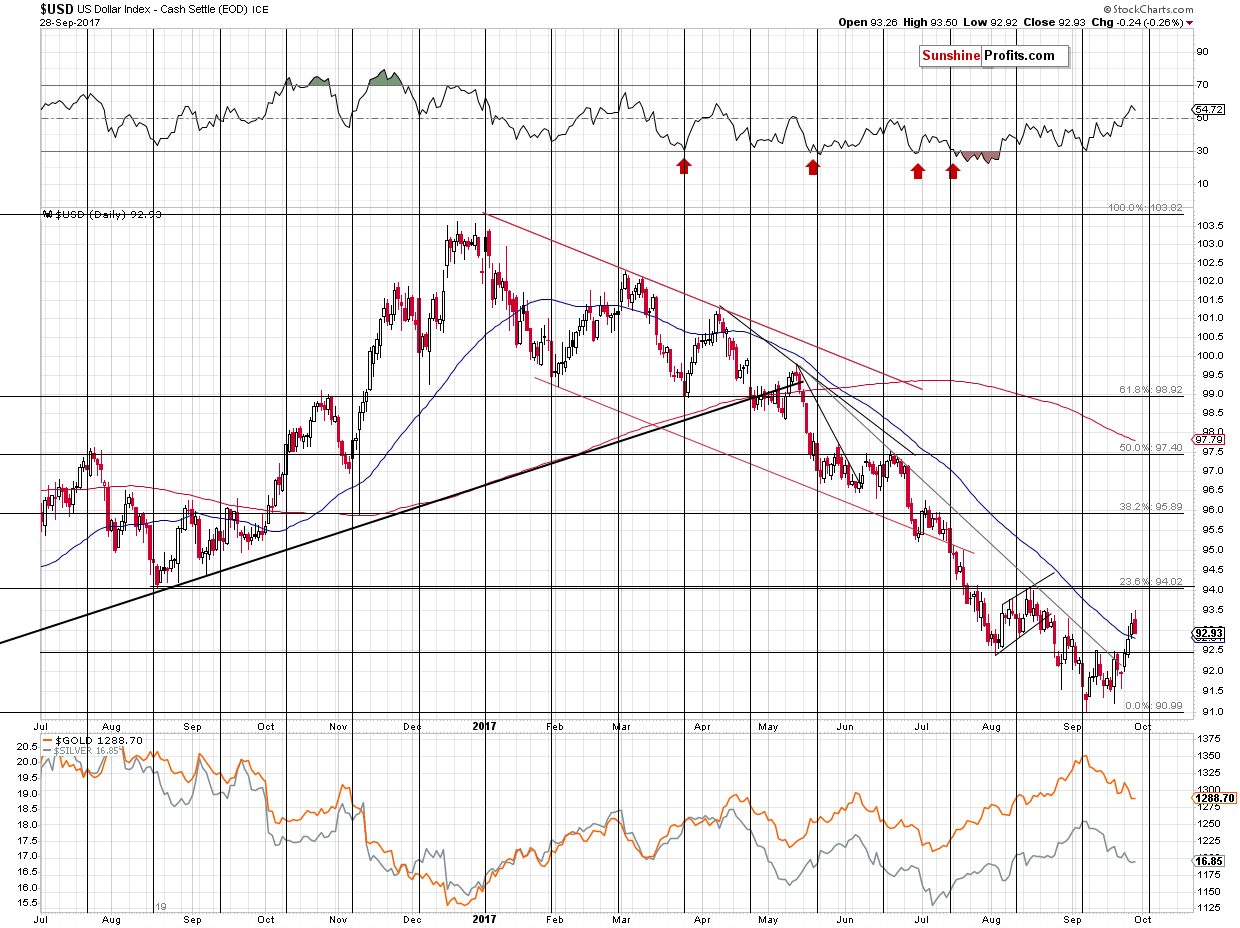
The breakout was confirmed and at the moment of writing these words, the USD Index is still trading visibly above 93 (93.27). The implications for the following weeks are very bullish, especially that the USD Index was extremely oversold from the medium-term point of view before starting this rally.
Still, let’s keep in mind that a short pause or even a move back to the declining resistance line is not out of the question before the rally continues. In other words, a move back to 92 would appear very bearish, but it wouldn’t be such if the declining resistance line remained unbroken. Such a corrective downswing is not imminent, though, especially given the long-term chart for the USD Index.
The USD Index moved back a bit, but it still trades above 93 (93.08 at the moment of writing these words) and visibly above the declining resistance line, so the bullish implications remain in place.
The thing that we would like to discuss today in greater detail is the possible temporary target for the USD Index – the 94 level. The first Fibonacci retracement that we see on the above chart (23.6% - it’s less popular than the classic 38.2%, 50% and 61.8% trio, but still quite useful) is at about 94 and it is strengthened by the August extremes – the August 2016 low and the August 2017 high.
The cyclical turning point is also just around the corner, so it could be the case that the USD takes a breather once it moves to the 94 level in the first days of October. It’s not guaranteed or even very likely (USD could soar through this resistance as it just was oversold from the long-term point of view), but this price-time combination appears more likely than other nearby price/time combinations, so we thought it might be useful for you to be aware of the possibility of a pause here. It’s unlikely to change the uptrend in the USD and the downtrend in the precious metals sector.
Summing up, yesterday’s pause took place on low volume, so it seems it was nothing more than just that – pause, and not a reversal. It seems that we may see another pause when the USD Index moves to the 94 level, but it still doesn’t seem that it would change the current trend, which remains up in case of the USD and down in case of the PMs.
The outlook for the precious metals sector remains bearish.
On a side note, we received a few questions about our final downside targets, so we think an additional clarification might be useful for all subscribers – the targets are visible on the long-term charts and they are being updated when we update other things on the charts and since the targets take the form of areas, they cover both: price and time. For instance, based on the chart that we published recently:
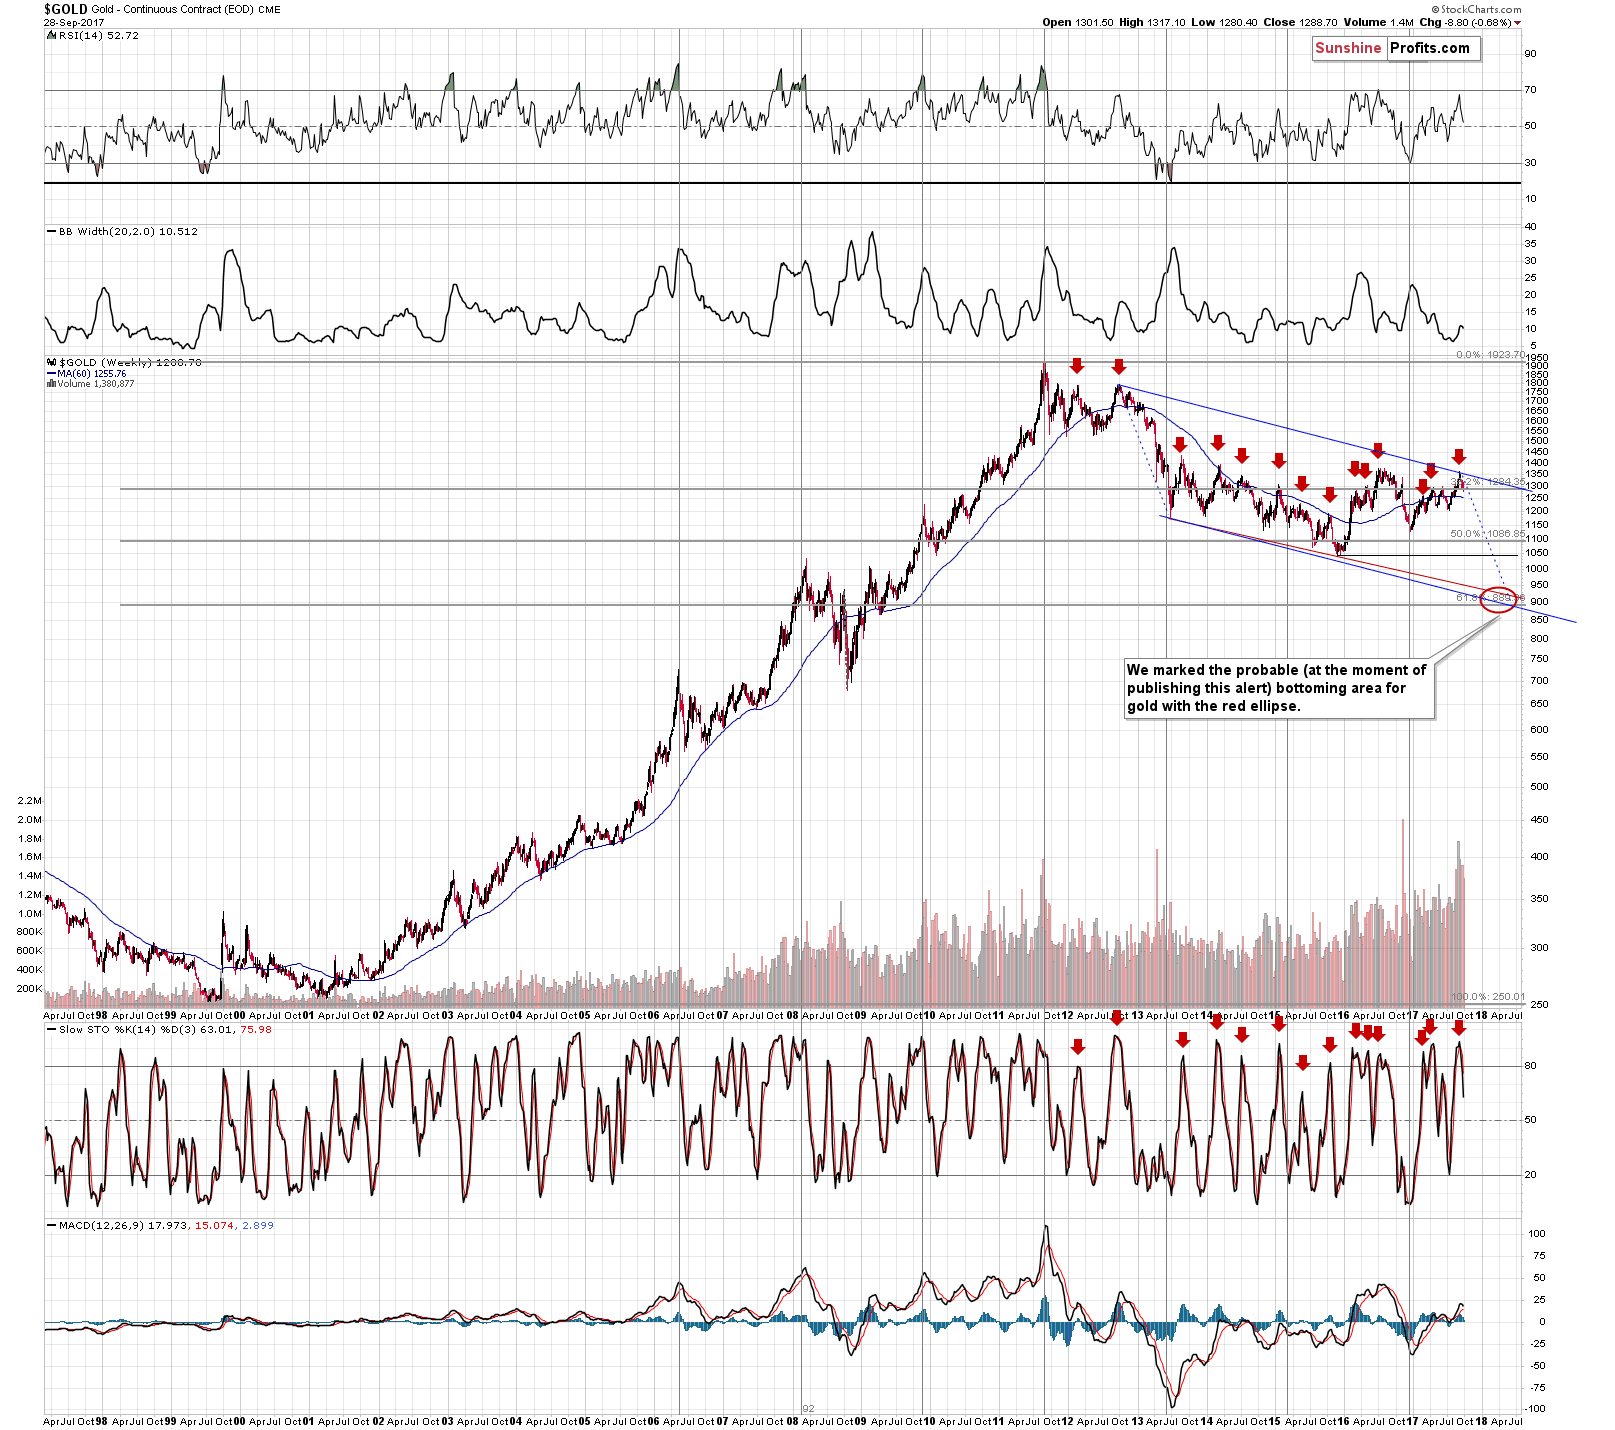
you can see that the target area is a red ellipse that covers the time from the December of this year to even May of the next year) and the price from about $860 to about $950. Gold may not bottom exactly at $890 as some orders could be placed right above that (more investors may expect to see gold bottoming at this level as the 61.8% Fibonacci retracement is a popular technique and they could place their buy orders slightly above it) or it could be the case that the panic among gold bulls will be so great that gold drops temporarily below $890 only to come back up in the following week or so. It will be important to focus on the corresponding action in other markets to determine which moves are likely fake and which ones are real.
As always, we will keep you – our subscribers – informed.
To summarize:
Trading capital (supplementary part of the portfolio; our opinion): Short positions (150% of the full position) in gold, silver and mining stocks are justified from the risk/reward perspective with the following stop-loss orders and initial target price levels / profit-take orders:
- Gold: initial target price level: $1,063; stop-loss: $1,366; initial target price for the DGLD ETN: $81.88; stop-loss for the DGLD ETN $38.74
- Silver: initial target price: $13.12; stop-loss: $19.22; initial target price for the DSLV ETN: $46.18; stop-loss for the DSLV ETN $17.93
- Mining stocks (price levels for the GDX ETF): initial target price: $9.34; stop-loss: $26.34; initial target price for the DUST ETF: $143.56; stop-loss for the DUST ETF $21.37
In case one wants to bet on junior mining stocks' prices (we do not suggest doing so – we think senior mining stocks are more predictable in the case of short-term trades – if one wants to do it anyway, we provide the details), here are the stop-loss details and initial target prices:
- GDXJ ETF: initial target price: $14.13; stop-loss: $45.31
- JDST ETF: initial target price: $417.04; stop-loss: $43.12
Long-term capital (core part of the portfolio; our opinion): No positions (in other words: cash)
Insurance capital (core part of the portfolio; our opinion): Full position
Important Details for New Subscribers
Whether you already subscribed or not, we encourage you to find out how to make the most of our alerts and read our replies to the most common alert-and-gold-trading-related-questions.
Please note that the in the trading section we describe the situation for the day that the alert is posted. In other words, it we are writing about a speculative position, it means that it is up-to-date on the day it was posted. We are also featuring the initial target prices, so that you can decide whether keeping a position on a given day is something that is in tune with your approach (some moves are too small for medium-term traders and some might appear too big for day-traders).
Plus, you might want to read why our stop-loss orders are usually relatively far from the current price.
Please note that a full position doesn’t mean using all of the capital for a given trade. You will find details on our thoughts on gold portfolio structuring in the Key Insights section on our website.
As a reminder – “initial target price” means exactly that – an “initial” one, it’s not a price level at which we suggest closing positions. If this becomes the case (like it did in the previous trade) we will refer to these levels as levels of exit orders (exactly as we’ve done previously). Stop-loss levels, however, are naturally not “initial”, but something that, in our opinion, might be entered as an order.
Since it is impossible to synchronize target prices and stop-loss levels for all the ETFs and ETNs with the main markets that we provide these levels for (gold, silver and mining stocks – the GDX ETF), the stop-loss levels and target prices for other ETNs and ETF (among other: UGLD, DGLD, USLV, DSLV, NUGT, DUST, JNUG, JDST) are provided as supplementary, and not as “final”. This means that if a stop-loss or a target level is reached for any of the “additional instruments” (DGLD for instance), but not for the “main instrument” (gold in this case), we will view positions in both gold and DGLD as still open and the stop-loss for DGLD would have to be moved lower. On the other hand, if gold moves to a stop-loss level but DGLD doesn’t, then we will view both positions (in gold and DGLD) as closed. In other words, since it’s not possible to be 100% certain that each related instrument moves to a given level when the underlying instrument does, we can’t provide levels that would be binding. The levels that we do provide are our best estimate of the levels that will correspond to the levels in the underlying assets, but it will be the underlying assets that one will need to focus on regarding the signs pointing to closing a given position or keeping it open. We might adjust the levels in the “additional instruments” without adjusting the levels in the “main instruments”, which will simply mean that we have improved our estimation of these levels, not that we changed our outlook on the markets. We are already working on a tool that would update these levels on a daily basis for the most popular ETFs, ETNs and individual mining stocks.
Our preferred ways to invest in and to trade gold along with the reasoning can be found in the how to buy gold section. Additionally, our preferred ETFs and ETNs can be found in our Gold & Silver ETF Ranking.
As a reminder, Gold & Silver Trading Alerts are posted before or on each trading day (we usually post them before the opening bell, but we don't promise doing that each day). If there's anything urgent, we will send you an additional small alert before posting the main one.
=====
Latest Free Trading Alerts:
On Wednesday, President Trump revealed his tax reform plan. What does it mean for the gold market?
=====
Hand-picked precious-metals-related links:
PRECIOUS-Gold little changed, on track for worst month this year
"Pressing" Need to Reform the Gold-Trade in India - WGC
Freeport can seek extension for Grasberg permit talks -minister
=====
In other news:
U.S. economy accelerates in second quarter; hurricanes expected to slow growth
Deutsche Bank Rating Cut by Fitch as Cryan Turnaround Stalls
Why It's Time to Pay Attention to the Crisis in Catalonia
=====
Thank you.
Sincerely,
Przemyslaw Radomski, CFA
Founder, Editor-in-chief, Gold & Silver Fund Manager
Gold & Silver Trading Alerts
Forex Trading Alerts
Oil Investment Updates
Oil Trading Alerts

