

Briefly: In our opinion, full (200% of the regular size of the position) speculative short positions in gold, silver and mining stocks are justified from the risk/reward perspective at the moment of publishing this alert. In other words, we are doubling the size of the already-profitable short position.
On May 1st, we knew that the precious metals sector was starting a 2-week rally based on cyclical turning points, apex-based reversals, and True Seasonality for May. The rally is over, the profits cashed in… And growing once again thanks to the new short position. What’s in store for the rest of the month and the next few ones? Something epic.
Even though it was only yesterday when we closed our previous long positions and entered short ones (on 7:09 AM EST - we had made the decision a few hours earlier, but due to the time required to complete, proofread, and post the alert, it was posted on 7:09 AM), the short positions are already profitable, especially the ones in gold.
We received quite a few questions in which subscribers asked how one could make sure that the trades are executed shortly, minimizing the time delay. The topic was so often mentioned that we decided to start today’s analysis with a reply. The easiest way is to have someone at the trading desk who’s able to react to the signals immediately (and to make sure that this person gets up early). On May 4th, we already provided a solution, but it was somewhat between the lines of a reply to another question (regarding using American ETFs by European investors), so it seems important to make it clearer.
There is a service that one might want to consider that your Editor provides outside of the regular newsletter arrangement. It’s managed futures trading - the trading is done automatically on one’s futures account. As soon as possible, the broker enters orders based on the signals that we provide and according to our position sizing rules. The capital stays in one’s account at all times and we don’t have access to it - we can only provide signals that make the broker enter or exit trades. If one doesn’t have a lot of time to manage their trades and / or one wants to ensure quick execution of trades, then the above might be really useful. If that’s something that you’re interested in, please contact the broker for details. The minimum capital required to use this service is $30k ($60k is better as it allows for diversification between gold and silver) and the contact details of our broker are:
Herb Kral
Director
SRB Capital Management, Inc.
Managed Futures, Clearing & Execution
190 S. LaSalle St. Suite 3000
Chicago, IL 60603
www.srbcapital.com
[email protected]
312-676-1044 office
630-841-3152 mobile
312-676-1009 fax
By the way, unless one makes money in the above arrangement, the service is free on our end (only regular transaction fees apply).
Having replied to the above question, let’s move to what happened in precious metals and mining stocks and why we decided to double the size of our short position.
Let’s start with the two most important short-term reasons.
Breakout and Breakdown
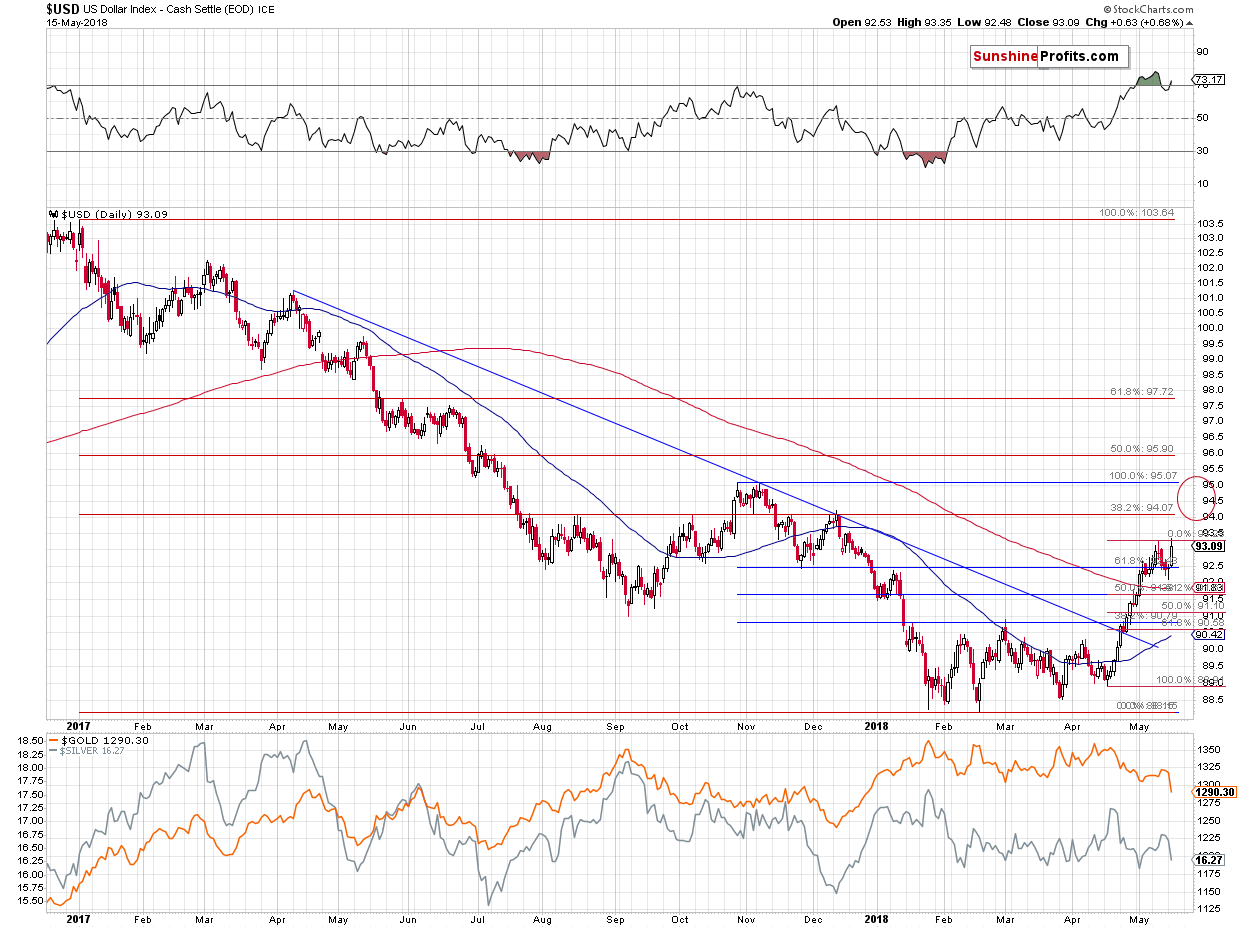
The situation in the USD Index was the only thing that had bullish implications for the PMs and based on what happened yesterday, the implications are now bearish. The USDX moved to new 2018 highs in terms of both intraday and closing prices. This invalidates the previous theory according to which there will be another short-term downswing after a few days of pause. Based on the breakout, this is no longer likely. Instead, the USD is now likely to move to the next resistance or even higher (in fact, our short positions in EUR/USD are already profitable). The next two target prices are at about 94 and 95. The former is provided by the December 2017 top and the latter is based on the October / November top. The 94 level seems more important as its strengthened by the August and early October tops and the 38.2% Fibonacci retracement level.
There is something else that is only visible on the above chart if one knows how to look. It’s the indication that we shouldn’t put too much weight on the USD Index’s signals in the next few months when it comes to predicting gold prices.
We just saw a powerful weekly reversal in the USD Index and it seemed to be a major bullish factor for metals and miners. It turned out that the PM-specific factors like True Seasonals and apex-based reversals were much more important. Plus, if the current rally is indeed going to be similar to the 2014 one, then predicting any pullbacks will be very risky.
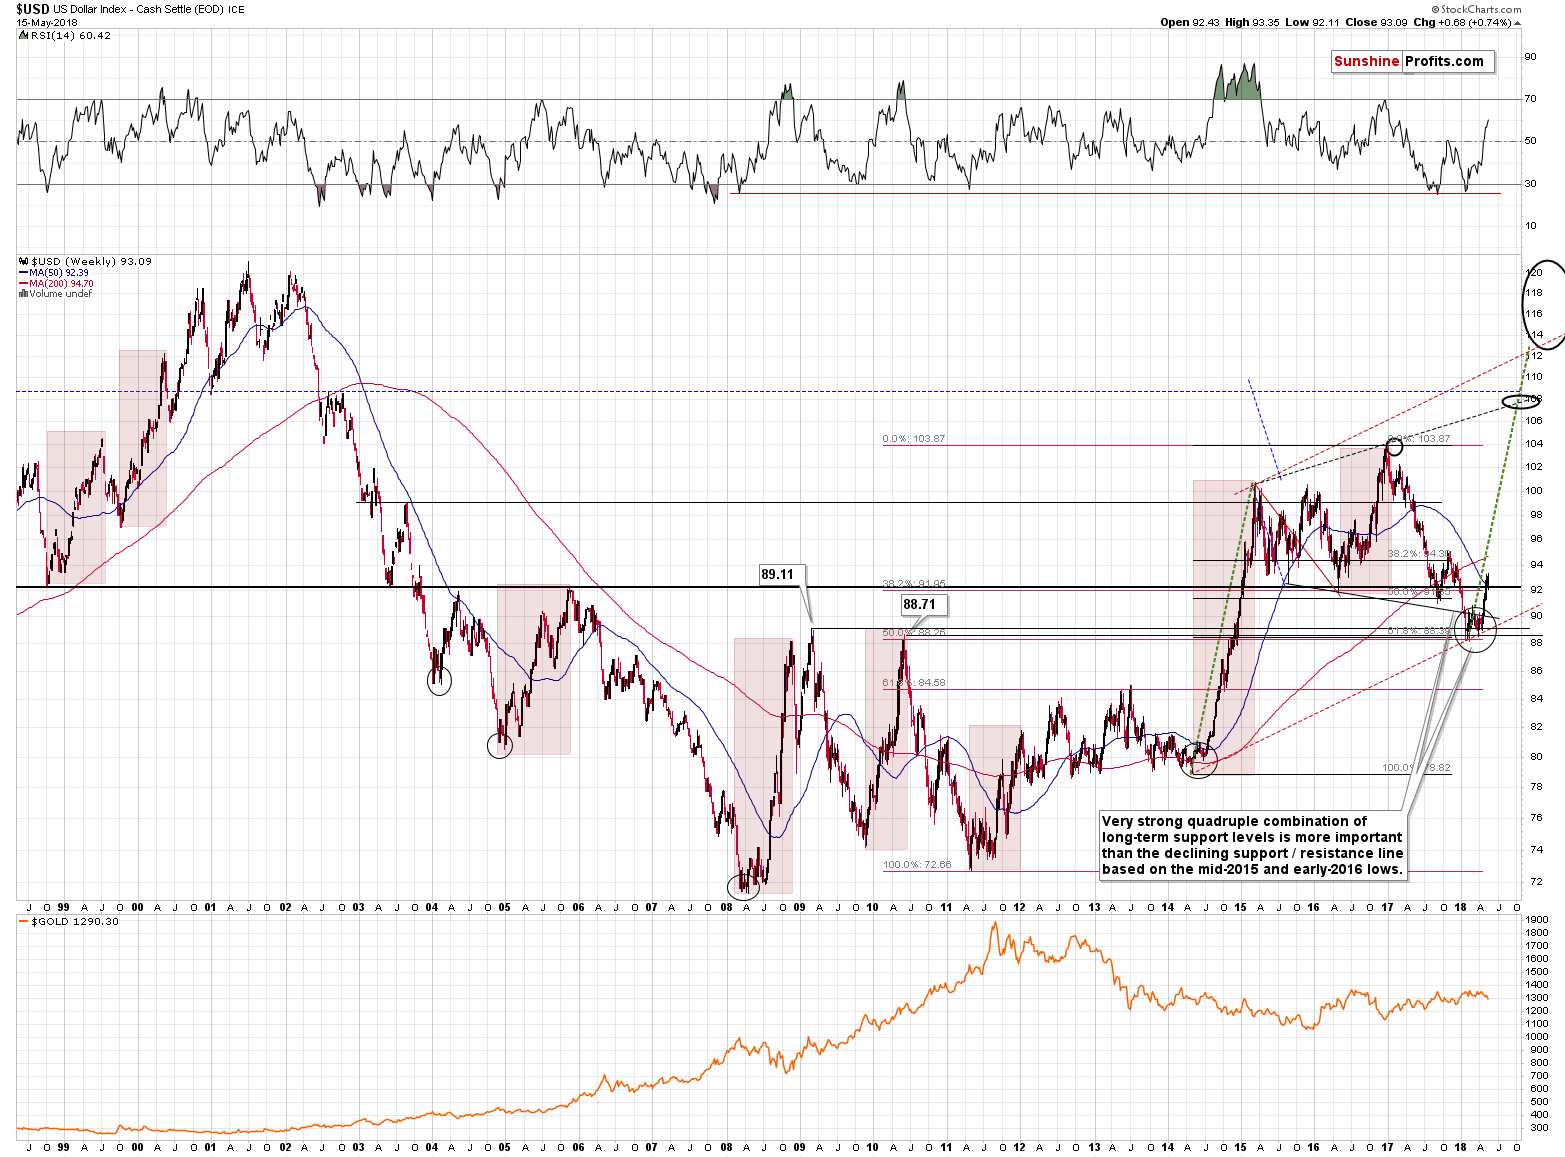
There were very few corrections in the second half of 2014 and in early 2015 and timing them would have been extremely difficult.
Consequently, going forward, it will be important to focus on what’s going on in gold, silver, mining stocks, their ratios and in the proprietary tools and techniques, and only look at the USD for possible confirmations. The USD on its own, however, may not have enough technical predictive power in order to make us keep or exit a certain position.
All in all, the first short-term development that made us double the size of the short position was the breakout in the USD.
The second development was the breakdown in the GDX ETF.
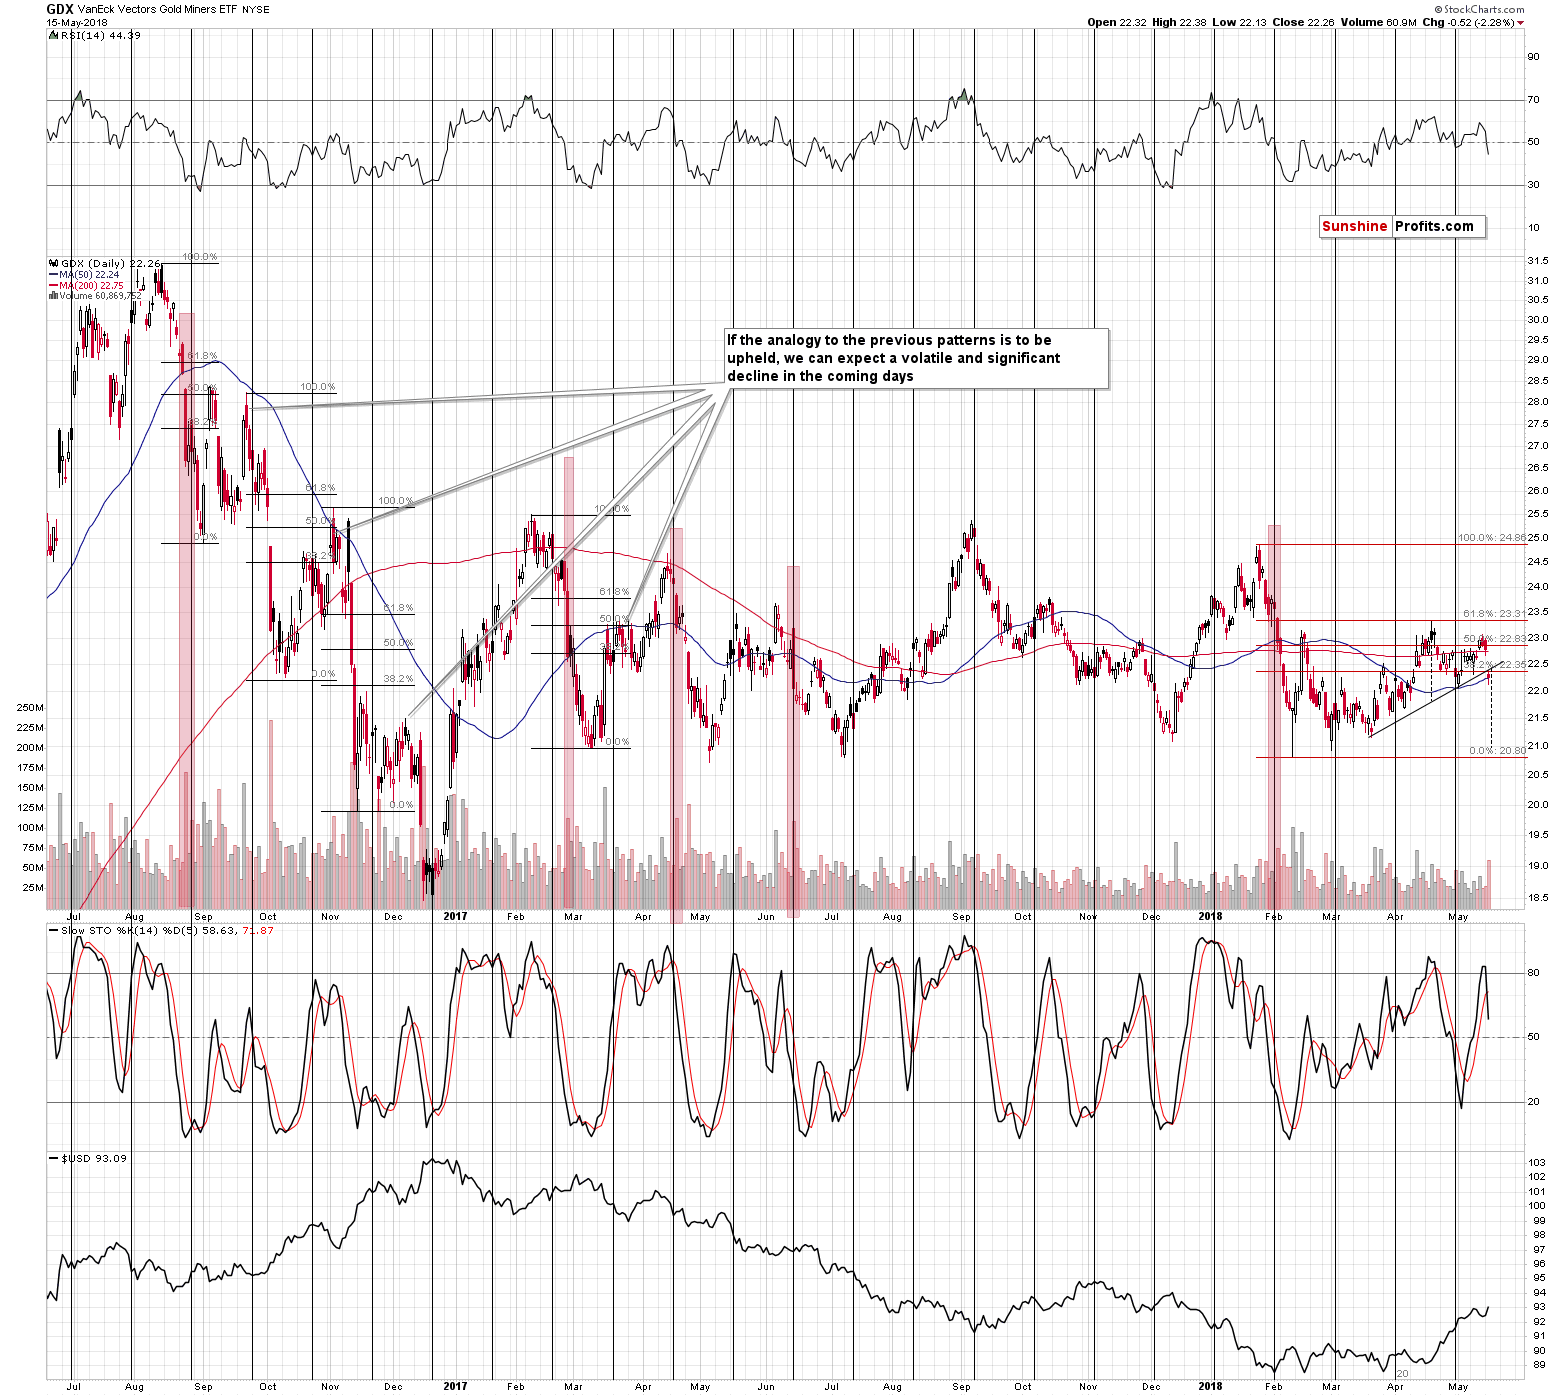
The breakdown is clear and it took place on huge volume. While its usually best to wait for two additional closes below a certain price level, based on the size of the volume, we can say that the breakdown was already verified in a way.
Moreover, yesterday’s decline created and completed a bearish head-and-shoulders pattern. The minimum target based on this formation can be obtained by applying the size of the head to the price of the breakdown. We marked both with dashed lines and based on this technique it seems that the GDX is about to decline to the previous 2018 lows. At about $21.
However, there are two factors that suggest that miners will decline much more. The less important is the analogy to the late-2016 declines. The double / triple (when counting this month’s upswing) move back to the 50% - 61.8% Fibonacci retracement levels makes the entire 2018 performance similar to the short-term downswings that we saw in late 2016. If the similarity is to continue, then the first big sharp move lower is just a start of something much bigger.
The more important factor is the analogy to the 2012-2013 decline.
So Much Room to Decline, So Little Time
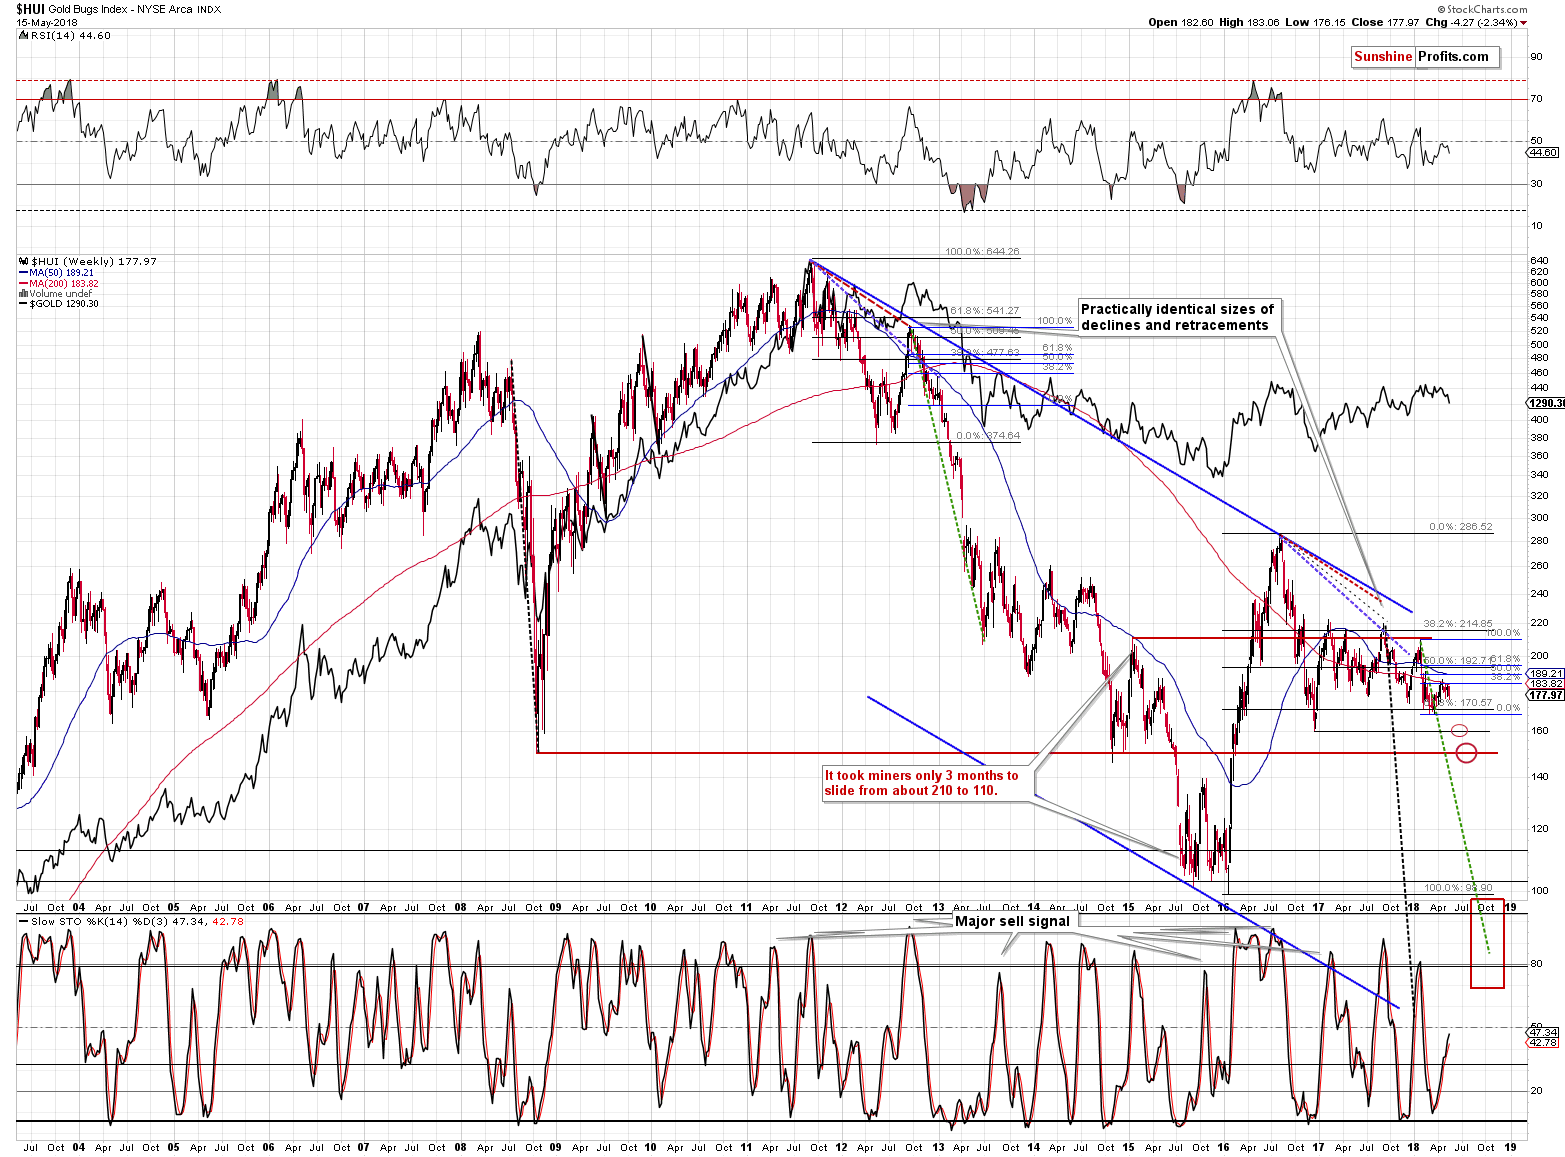
Based on the 2012/2013-now analogy, it seems that the most recent upswing was nothing more than just a final pause before the big drop. The decline is lightly to be sharp, as the final bottom is likely to be seen in late September or early October and this leaves just a few months for the prices of mining stocks to be cut in half or so. This means that the declines are likely to be significant and quick and corrective upswings very tricky.
There are 3 nearby support levels – one at the previous 2018 lows, the second at the late 2016 low (at about 160), and the third one at about 150 – at the 2008 and 2014 low. Once the latter is taken out, there will be little to prevent a slide to 100 -110 level.
According to the long-term apex-based reversals for the HUI Index, there might be even less time.
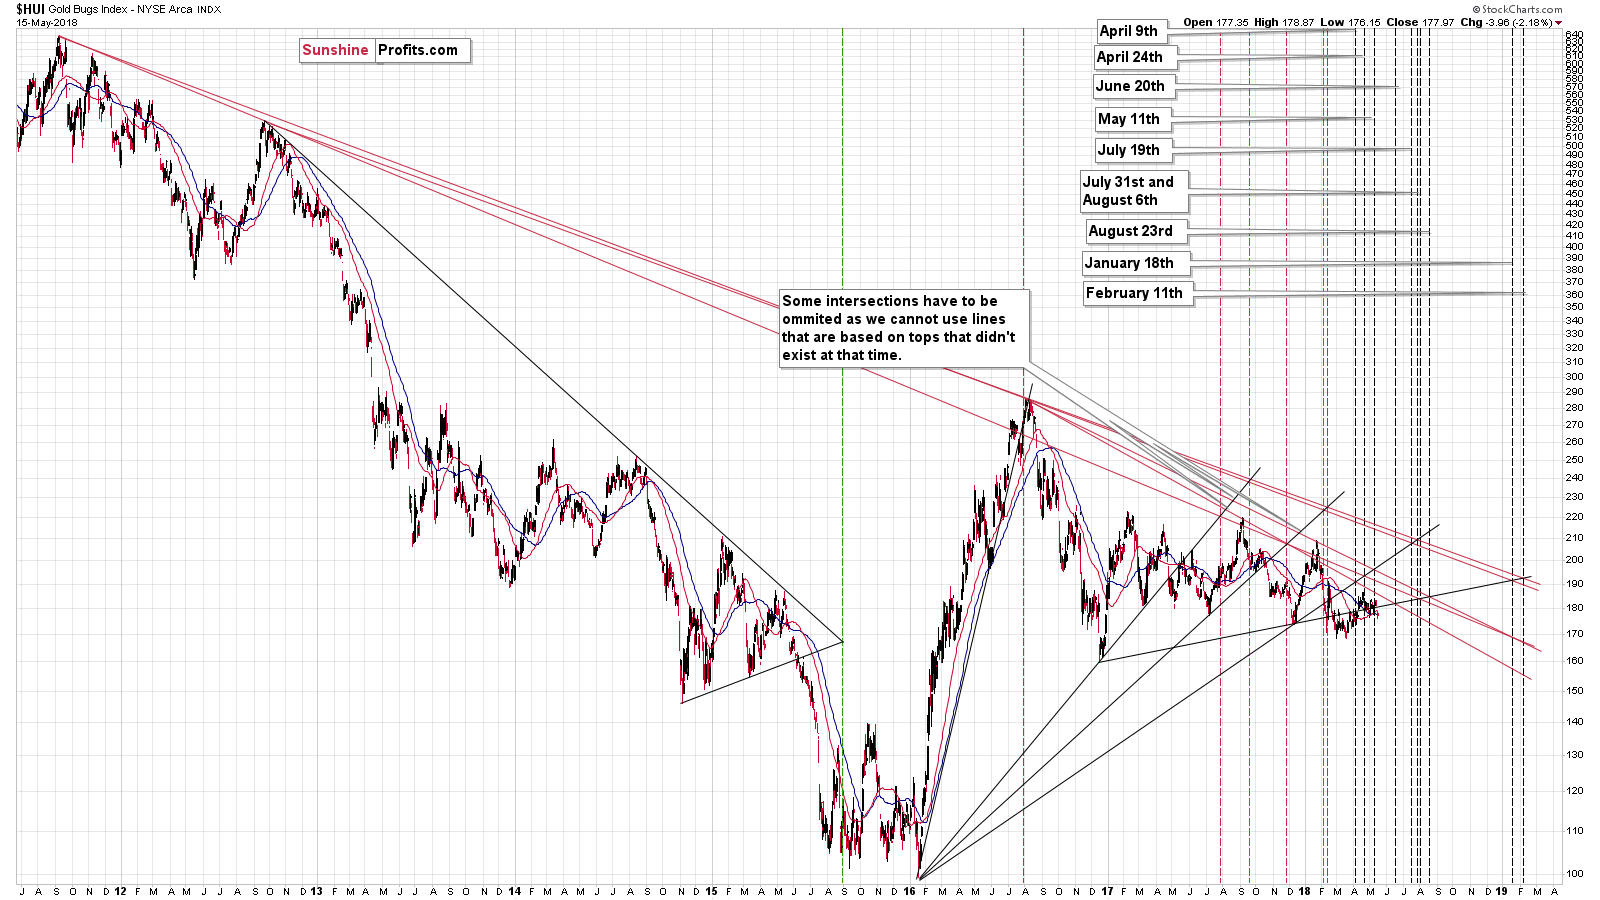
There are several reversals in the middle of the year – in late July and in early August. There’s also one on August 23rd. Does it seem familiar? It should, because that’s what we saw in the second half of 2015, before the final bottom, but relatively close to it.
If the multi-year decline in the precious metals and mining stocks is about to end, then we can expect it to end in a similar fashion to what ended the big medium-term decline in 2015 and that’s exactly what the apex-based reversals are suggesting.
If there are multiple bottoms at similar price levels and the biggest support close to 100, then we shouldn’t be surprised if the HUI moves close to this level in late July. That’s about 9-10 weeks away, which is very little time for about a 70-index-point decline. There might be ups and downs during the decline, but overall that would be a very steep move – about 7 index points a week. Trading in and out of this market may be extremely difficult and it might be better to simply buckle up and ride the slide until the HUI is much lower.
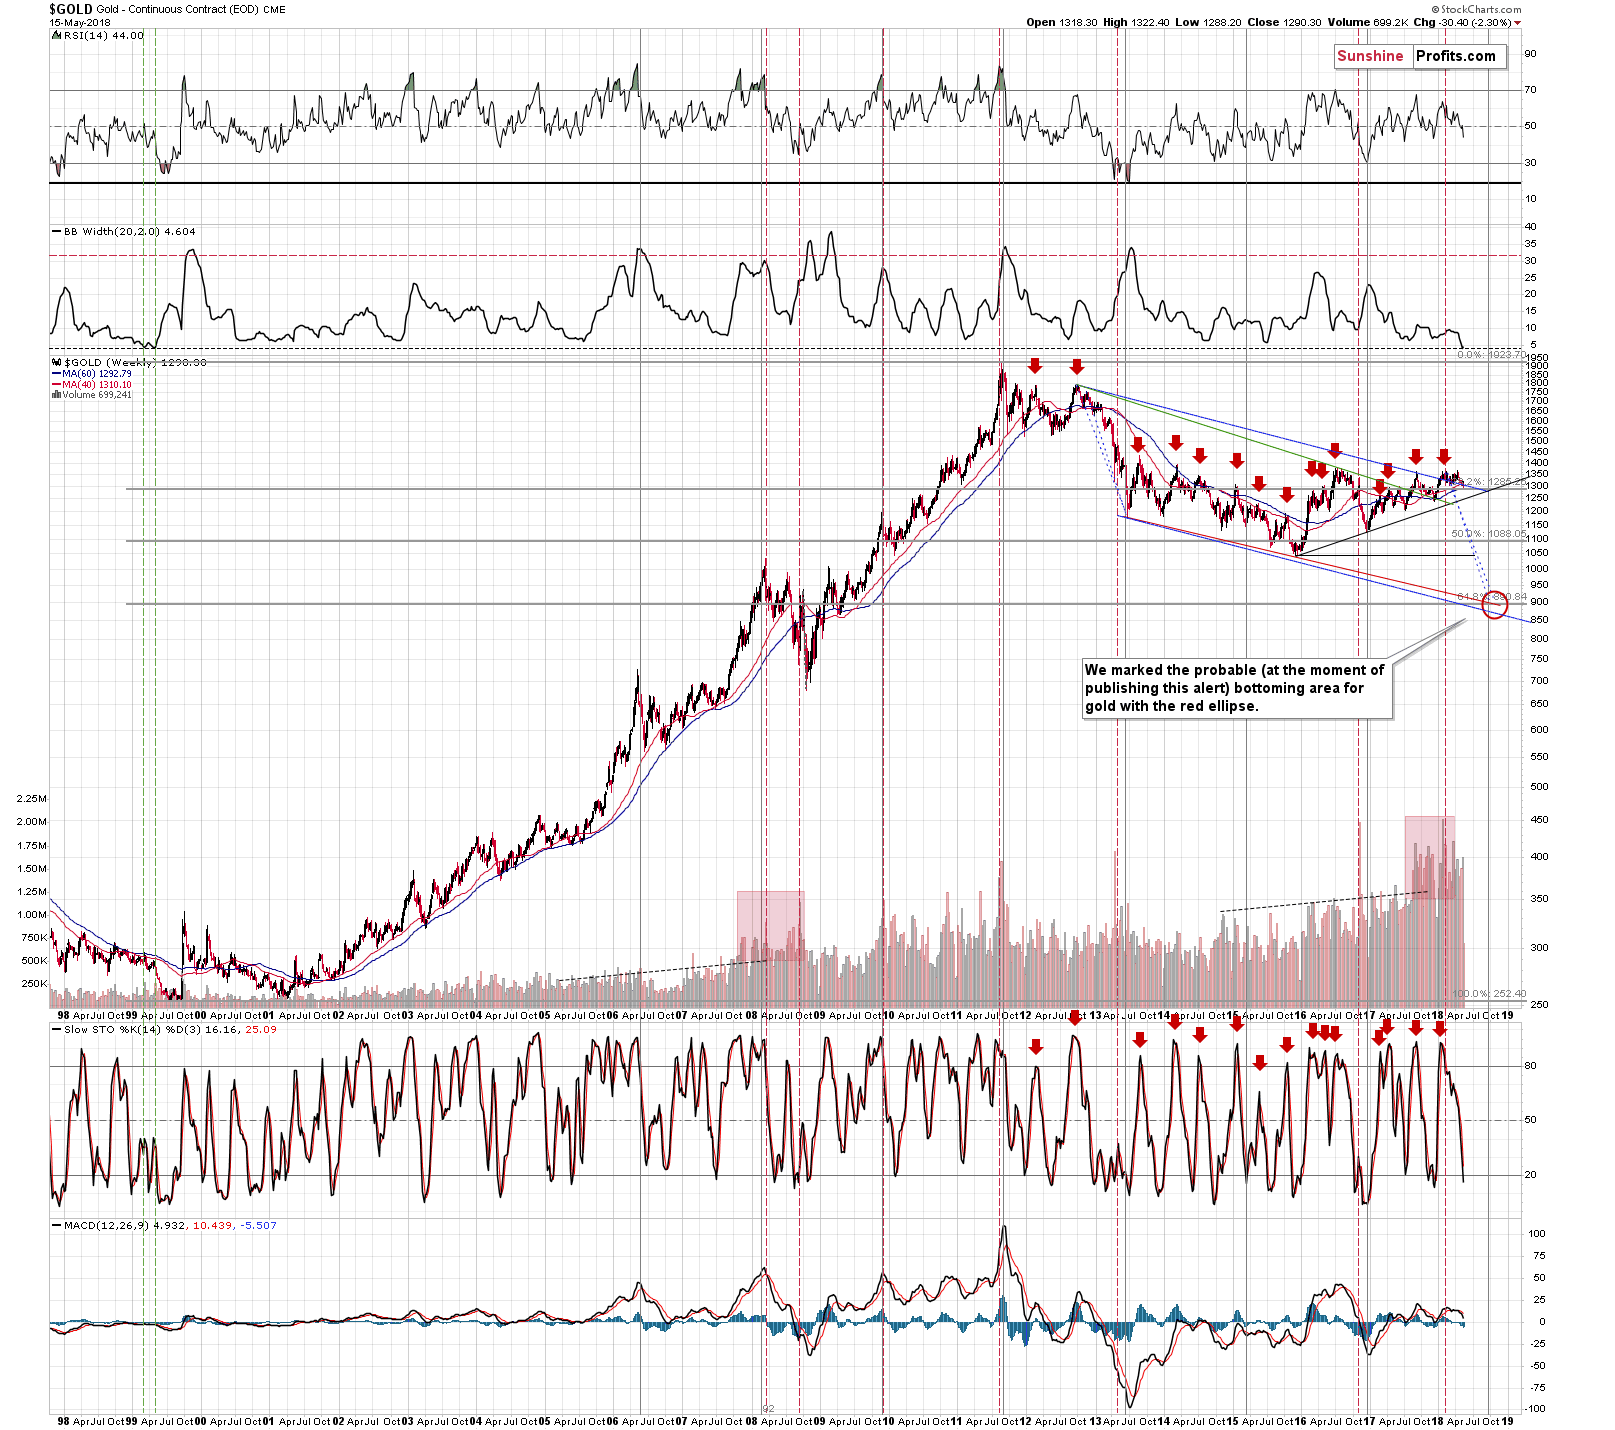
The decline could be very steep based on the very long-term gold chart as well. The Bollinger Band’s width (second indicator from the top) just moved to an extremely low level. This means that the gold price volatility is extremely low. This is exactly what one can see in a market right before a huge move. This is the calm before the storm and the indicator shows just how calm it is from the long-term point of view.
It’s been almost 20 years since the Bollinger Band’s width was this low. We saw it two times in the first half of 1999. Both times were seen right before declines.
Do you know when the final slide of 1999 happened and when it ended?
It started in May and it ended in mid-July, but the true rally started in mid-September.
Please note how perfectly it fits what we wrote earlier, based on entirely different techniques. The decline already began this month, the apex-based turning points suggest an important bottom in late July and/or early August and gold’s apex-based reversal along with the very long-term turning point suggest a major turnaround in late September or early October.
Now we also have a confirmation from the analogy to 1999 that’s based on the extremely low reading in gold price’s volatility.
While we’re discussing the apex-based reversals, let’s take a look at the short-term implications, which are visible in the case of gold and silver triangles.
Near-term Reversals
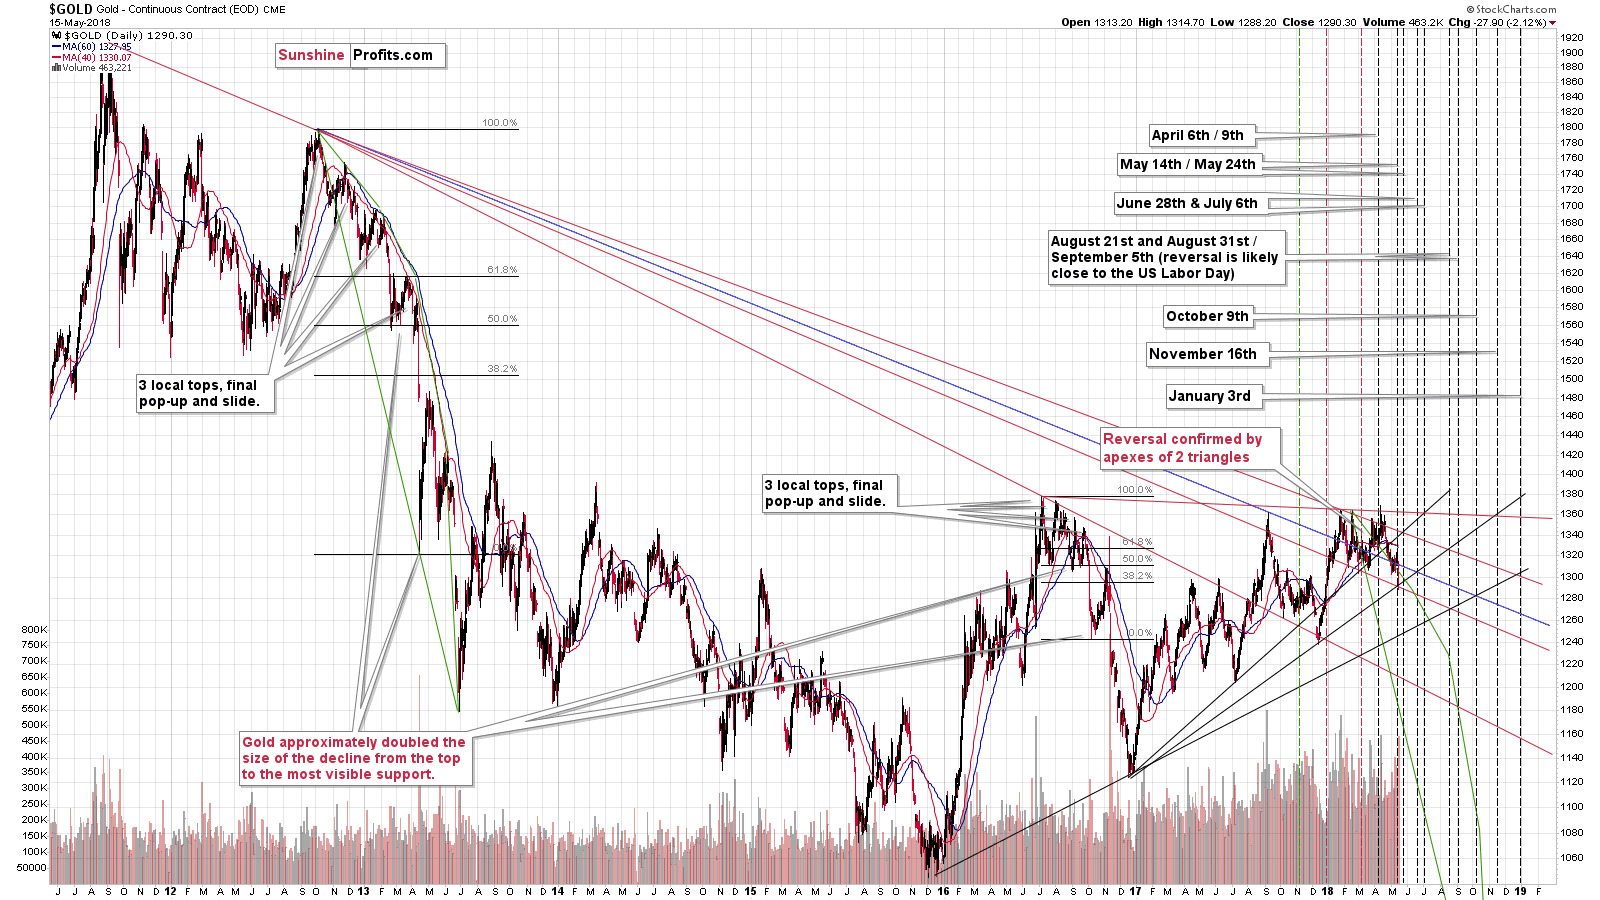
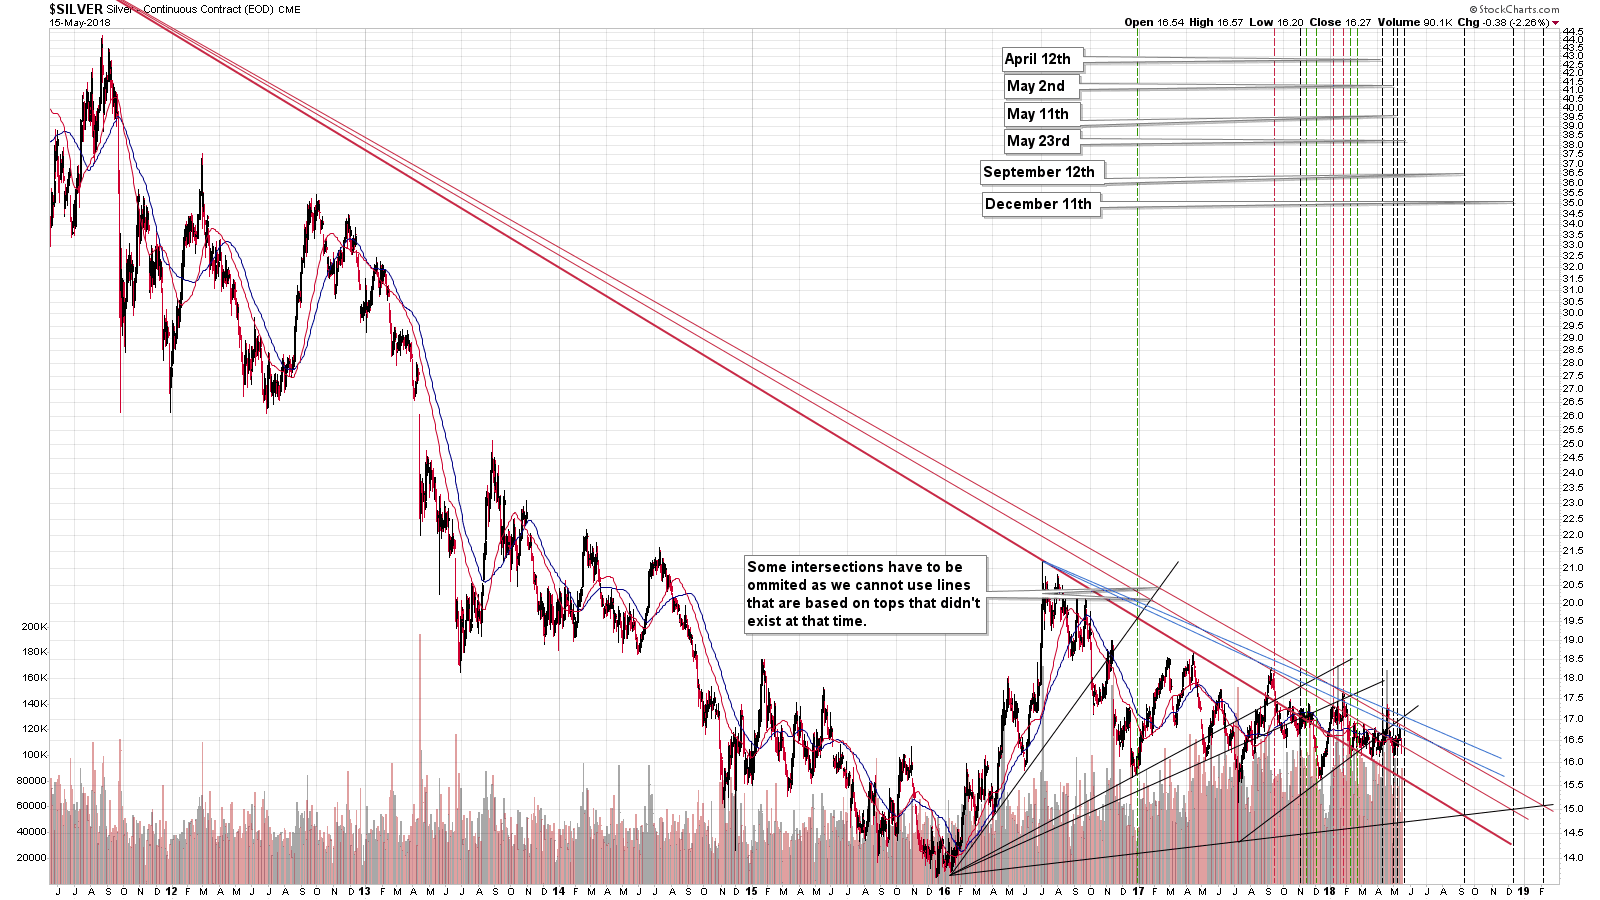
The next turning points are on May 23rd (silver) and May 24th (gold), which means that we should be expecting a short-term turnaround in a week. Again, based on what we have in the long-term charts, this may not or may not be a trading opportunity as the risk (missing profits) of being out of the short position seems quite significant. We’ll need to see what kind of signals we get and where the prices will be next week. As discussed earlier, we’ll focus on metals and miners and only use the USD as a supplementary tool.
Let’s move back to the big picture once again.
Mining Stock Ratios
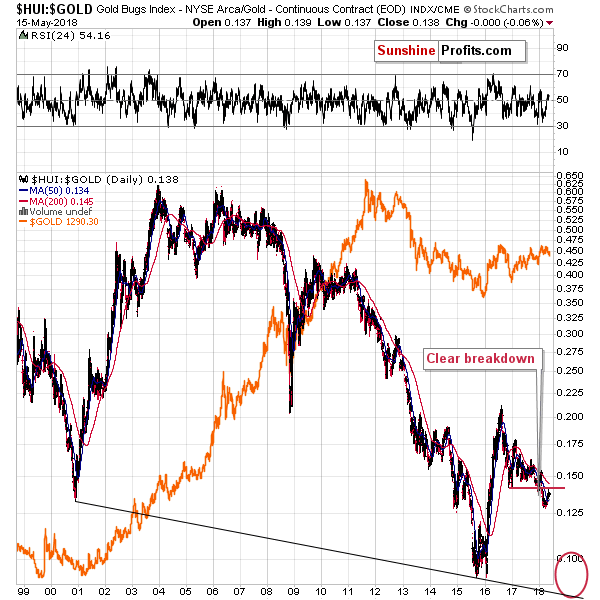
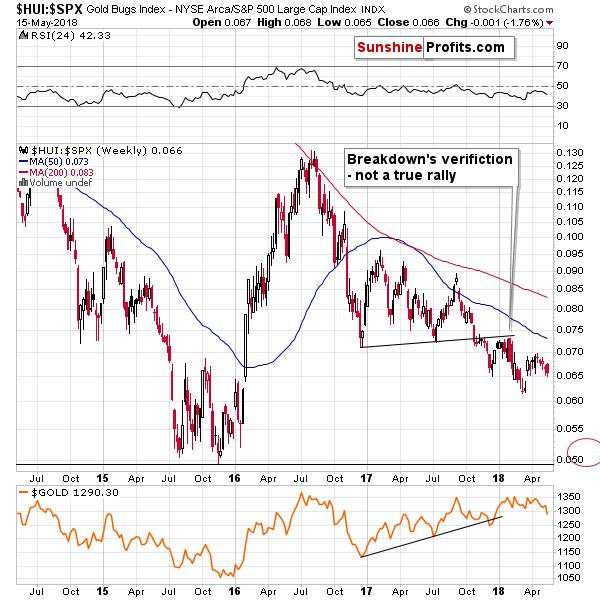
Both important ratios of gold stocks – to gold and to the general stock market – point to lower prices of the former in the upcoming months. The breakdowns below key support lines were confirmed and additionally verified by moves back to them.
Gold stocks’ outperformance of gold in the past few weeks might have seemed encouraging, but it really was just a confirmation of the breakdown in the ratio. As such, it was bullish only from the short-term point of view. The rally that we saw seems to be over and the medium-term implications are taking over. They are bearish.
Before summarizing, let’s look at both key precious metals.
Gold & Silver
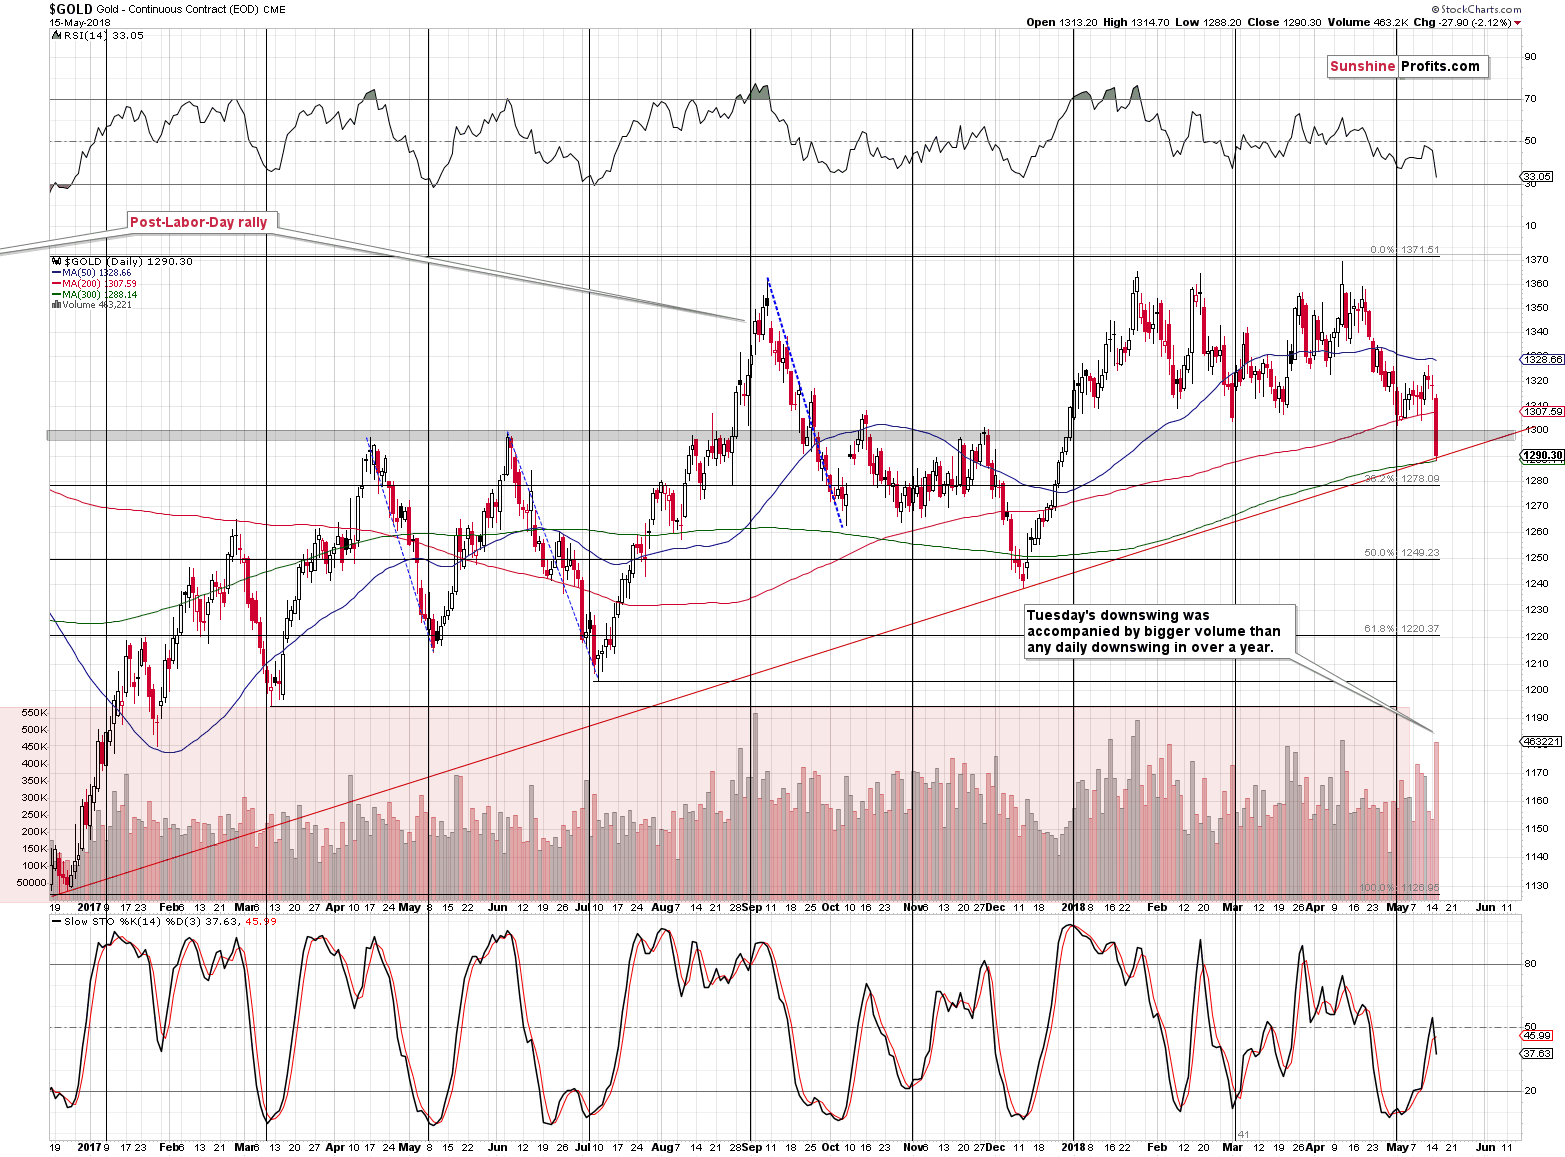
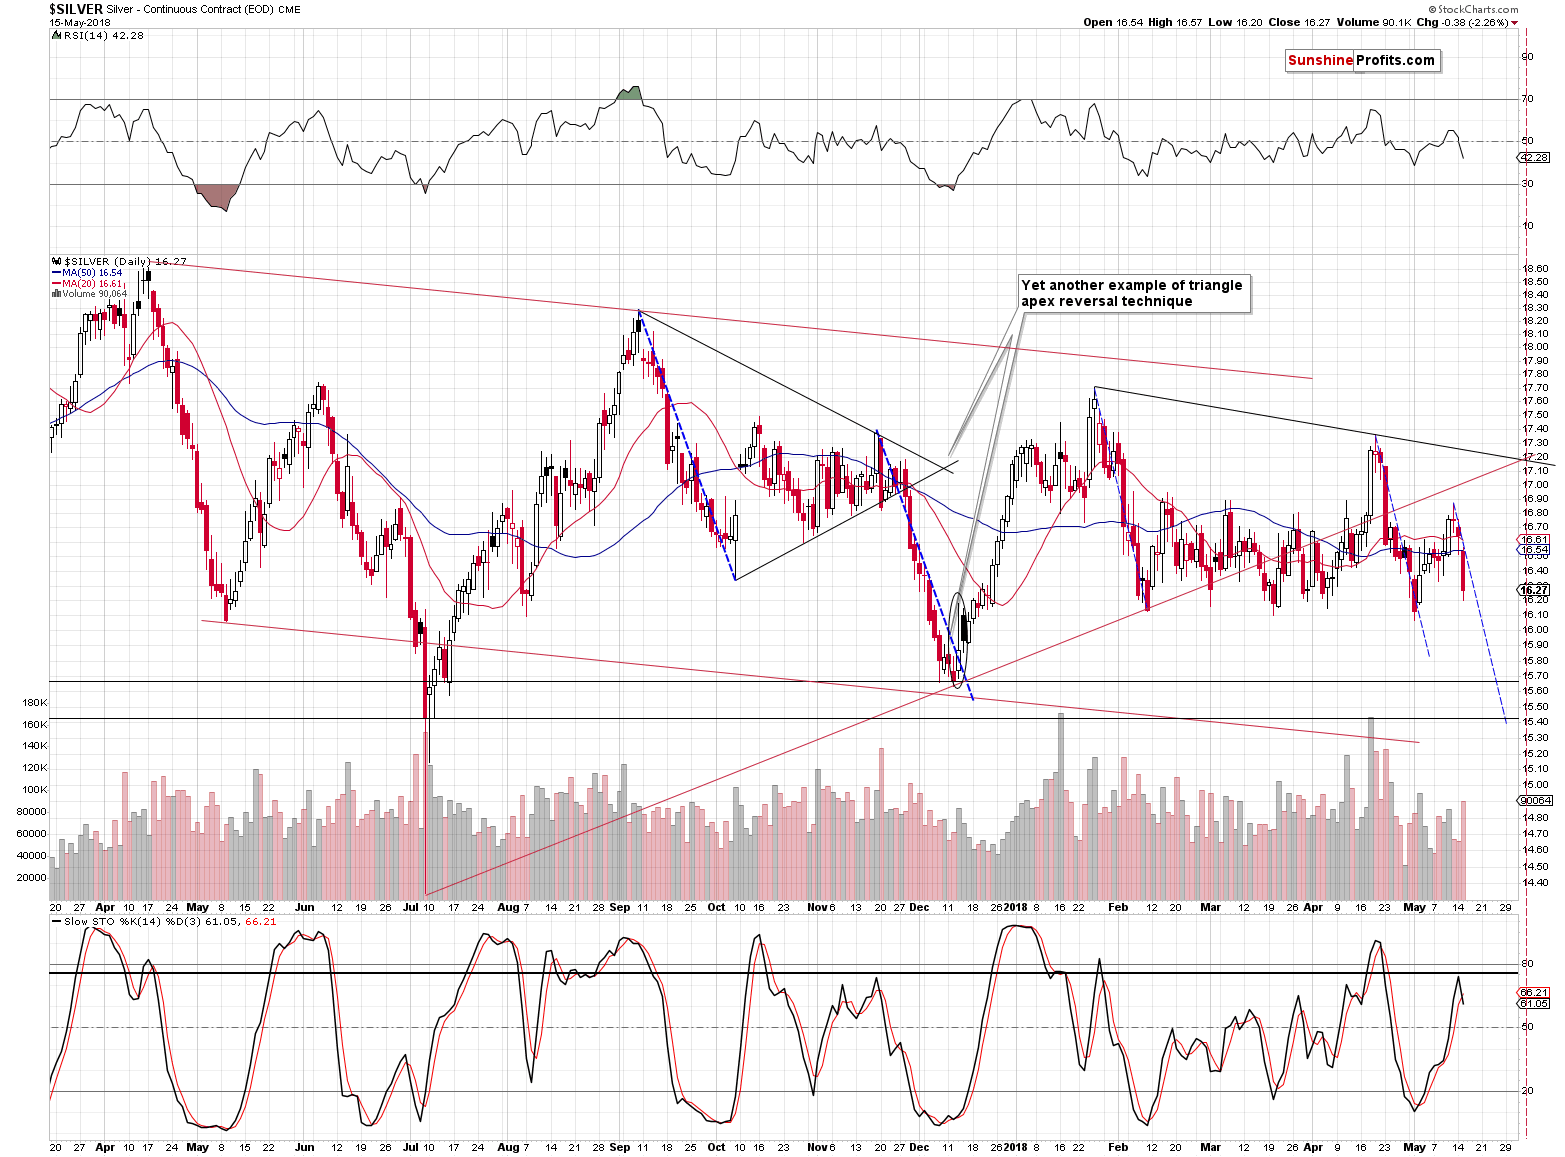
In yesterday’s alert, we wrote that we are adjusting the positions before the indicators flashed the sell signals and we didn’t have to wait for long for the Stochastic to confirm our earlier analysis. We saw sell signals in both metals.
What’s significant about gold is that the decline took place on enormous volume – the last time we saw a daily decline on volume that was even bigger, was in November 2016. That was the beginning of a powerful and sharp decline. To be clear, there were also cases when similarly big volume was followed by a brief pause – for instance the September 21, 2017 decline. The bigger decline continued after a few days nonetheless.
The bullish factor here is the rising, long-term support line based on the December 2016 and December 2017 bottoms. It was just reached yesterday, which means that gold could show some temporary strength.
While we may get a very short-term bounce here, based on multiple factors that we discussed above, it seems that waiting for it before adding to the short position is not worth it. Gold could get several dollars higher, but it might (which seems more likely) also decline a few tens of dollars and even if it does move higher today or tomorrow, it’s very likely to turn south shortly anyway.
Summary
Summing up, based on the apex-based reversals, True Seasonal patterns for gold, silver and mining stocks and the way the latter performed yesterday, it seems that the local top is already in. The USD Index broke out and it ceased to have bullish implications for PMs and started to have bearish ones.
Based on the support level that was reached in gold, some kind of corrective upswing was likely, but we already saw a small move higher during overnight trading, so the upswing may already be over.
Based on the nearby apex-based reversals in gold and silver, we might expect a turnaround next week on Wednesday or Thursday, which suggests that we’ll see a decline until that time and that the profits from the current short position will increase further before the trade is over. The breakdown in mining stocks serves as a bearish confirmation.
Due to the increased number of bearish factors and decreased number of bullish ones it seems that increasing speculative short positions even further is currently justified from the risk to reward point of view.
As always, we will keep you – our subscribers – informed.
To summarize:
Trading capital (supplementary part of the portfolio; our opinion): Full short positions (200% of the full position) in gold, silver and mining stocks are justified from the risk/reward perspective with the following stop-loss orders and initial target price levels:
- Gold: initial target price: $1,218; stop-loss: $1,382; initial target price for the DGLD ETN: $52.98; stop-loss for the DGLD ETN $37.48
- Silver: initial target price: $14.63; stop-loss: $18.06; initial target price for the DSLV ETN: $33.48; stop-loss for the DSLV ETN $19.17
- Mining stocks (price levels for the GDX ETF): initial target price: $19.22; stop-loss: $23.54; initial target price for the DUST ETF: $39.48; stop-loss for the DUST ETF $21.16
In case one wants to bet on junior mining stocks' prices (we do not suggest doing so – we think senior mining stocks are more predictable in the case of short-term trades – if one wants to do it anyway, we provide the details), here are the stop-loss details and initial target prices:
- GDXJ ETF: initial target price: $27.82; stop-loss: $36.14
- JDST ETF: initial target price: $92.88 stop-loss: $40.86
Long-term capital (core part of the portfolio; our opinion): No positions (in other words: cash)
Insurance capital (core part of the portfolio; our opinion): Full position
Important Details for New Subscribers
Whether you already subscribed or not, we encourage you to find out how to make the most of our alerts and read our replies to the most common alert-and-gold-trading-related-questions.
Please note that the in the trading section we describe the situation for the day that the alert is posted. In other words, it we are writing about a speculative position, it means that it is up-to-date on the day it was posted. We are also featuring the initial target prices, so that you can decide whether keeping a position on a given day is something that is in tune with your approach (some moves are too small for medium-term traders and some might appear too big for day-traders).
Plus, you might want to read why our stop-loss orders are usually relatively far from the current price.
Please note that a full position doesn’t mean using all of the capital for a given trade. You will find details on our thoughts on gold portfolio structuring in the Key Insights section on our website.
As a reminder – “initial target price” means exactly that – an “initial” one, it’s not a price level at which we suggest closing positions. If this becomes the case (like it did in the previous trade) we will refer to these levels as levels of exit orders (exactly as we’ve done previously). Stop-loss levels, however, are naturally not “initial”, but something that, in our opinion, might be entered as an order.
Since it is impossible to synchronize target prices and stop-loss levels for all the ETFs and ETNs with the main markets that we provide these levels for (gold, silver and mining stocks – the GDX ETF), the stop-loss levels and target prices for other ETNs and ETF (among other: UGLD, DGLD, USLV, DSLV, NUGT, DUST, JNUG, JDST) are provided as supplementary, and not as “final”. This means that if a stop-loss or a target level is reached for any of the “additional instruments” (DGLD for instance), but not for the “main instrument” (gold in this case), we will view positions in both gold and DGLD as still open and the stop-loss for DGLD would have to be moved lower. On the other hand, if gold moves to a stop-loss level but DGLD doesn’t, then we will view both positions (in gold and DGLD) as closed. In other words, since it’s not possible to be 100% certain that each related instrument moves to a given level when the underlying instrument does, we can’t provide levels that would be binding. The levels that we do provide are our best estimate of the levels that will correspond to the levels in the underlying assets, but it will be the underlying assets that one will need to focus on regarding the signs pointing to closing a given position or keeping it open. We might adjust the levels in the “additional instruments” without adjusting the levels in the “main instruments”, which will simply mean that we have improved our estimation of these levels, not that we changed our outlook on the markets. We are already working on a tool that would update these levels on a daily basis for the most popular ETFs, ETNs and individual mining stocks.
Our preferred ways to invest in and to trade gold along with the reasoning can be found in the how to buy gold section. Additionally, our preferred ETFs and ETNs can be found in our Gold & Silver ETF Ranking.
As a reminder, Gold & Silver Trading Alerts are posted before or on each trading day (we usually post them before the opening bell, but we don't promise doing that each day). If there's anything urgent, we will send you an additional small alert before posting the main one.
=====
Latest Free Trading Alerts:
Monday's session discovered currency bulls’ weakness, which was mercilessly used by their opponents during yesterday's trading. Thanks to the sellers’ attack, EUR/USD hit a fresh 2018 low, but will we see further declines in the coming days?
=====
Hand-picked precious-metals-related links:
PRECIOUS-Gold prices recover on short-covering
John Paulson and Ray Dalio Stay Loyal to Gold
Anglo American to spin off unit to encourage platinum demand
=====
In other news:
Dollar nears five-month high on bond yield surge, euro unfazed by Italy
North Korea says may reconsider summit with Trump, suspends talks with South
10-year U.S. government bond yield hits highest since 2011, briefly tops 3.09%
Pimco Sees U.S. 10-Year Treasury Yields Topping Out at 3.5%
Italy Bonds Roiled as Populists Debate $300 Billion Write-Down
Iran and Venezuela are 'a major challenge' to avoiding oil price hikes, IEA warns
=====
Thank you.
Sincerely,
Przemyslaw Radomski, CFA
Founder, Editor-in-chief, Gold & Silver Fund Manager
Gold & Silver Trading Alerts
Forex Trading Alerts
Oil Investment Updates
Oil Trading Alerts

