

Briefly: in our opinion, full (250% of the regular size of the position) speculative short positions in gold, silver and mining stocks are justified from the risk/reward perspective at the moment of publishing this Alert.
Gold didn’t do much yesterday, but silver moved to new highs in terms of both: intraday high and the closing prices, while the mining stocks moved to a new high based on the closing price and they did it on strong volume. What does that tell us?
Let’s move right into charts for details.
Gold’s Weakness
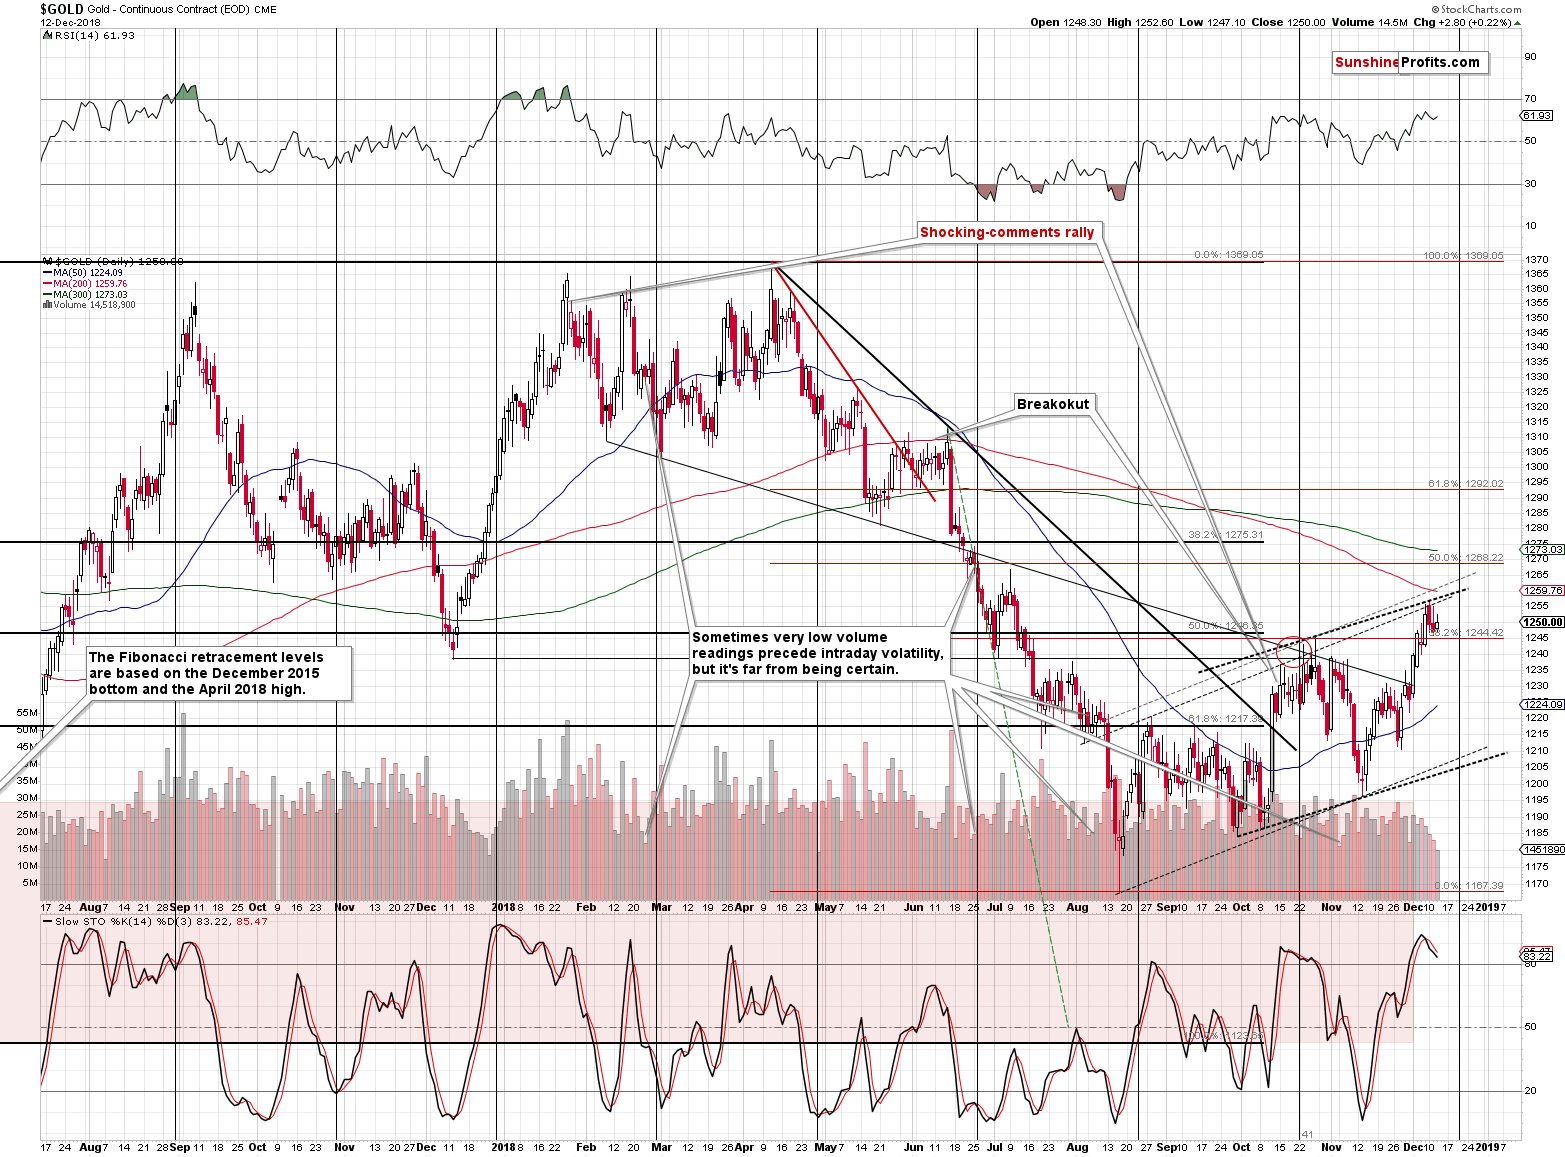
Gold moved only a bit higher yesterday and it did so on very low volume. The volume was likely not a data error because the volume in the GLD ETF was also very low. Generally, very low volume during an upswing suggests that this is not the true direction in which the market wants to move. If we saw the volume this low at the beginning of a move higher, it might have been the case that the rally is simply starting to pick up and the volume is not significant yet. But that’s not a beginning of a rally and thus low volume should be interpreted as a sign that the buying power is drying up.
Silver’s Strength
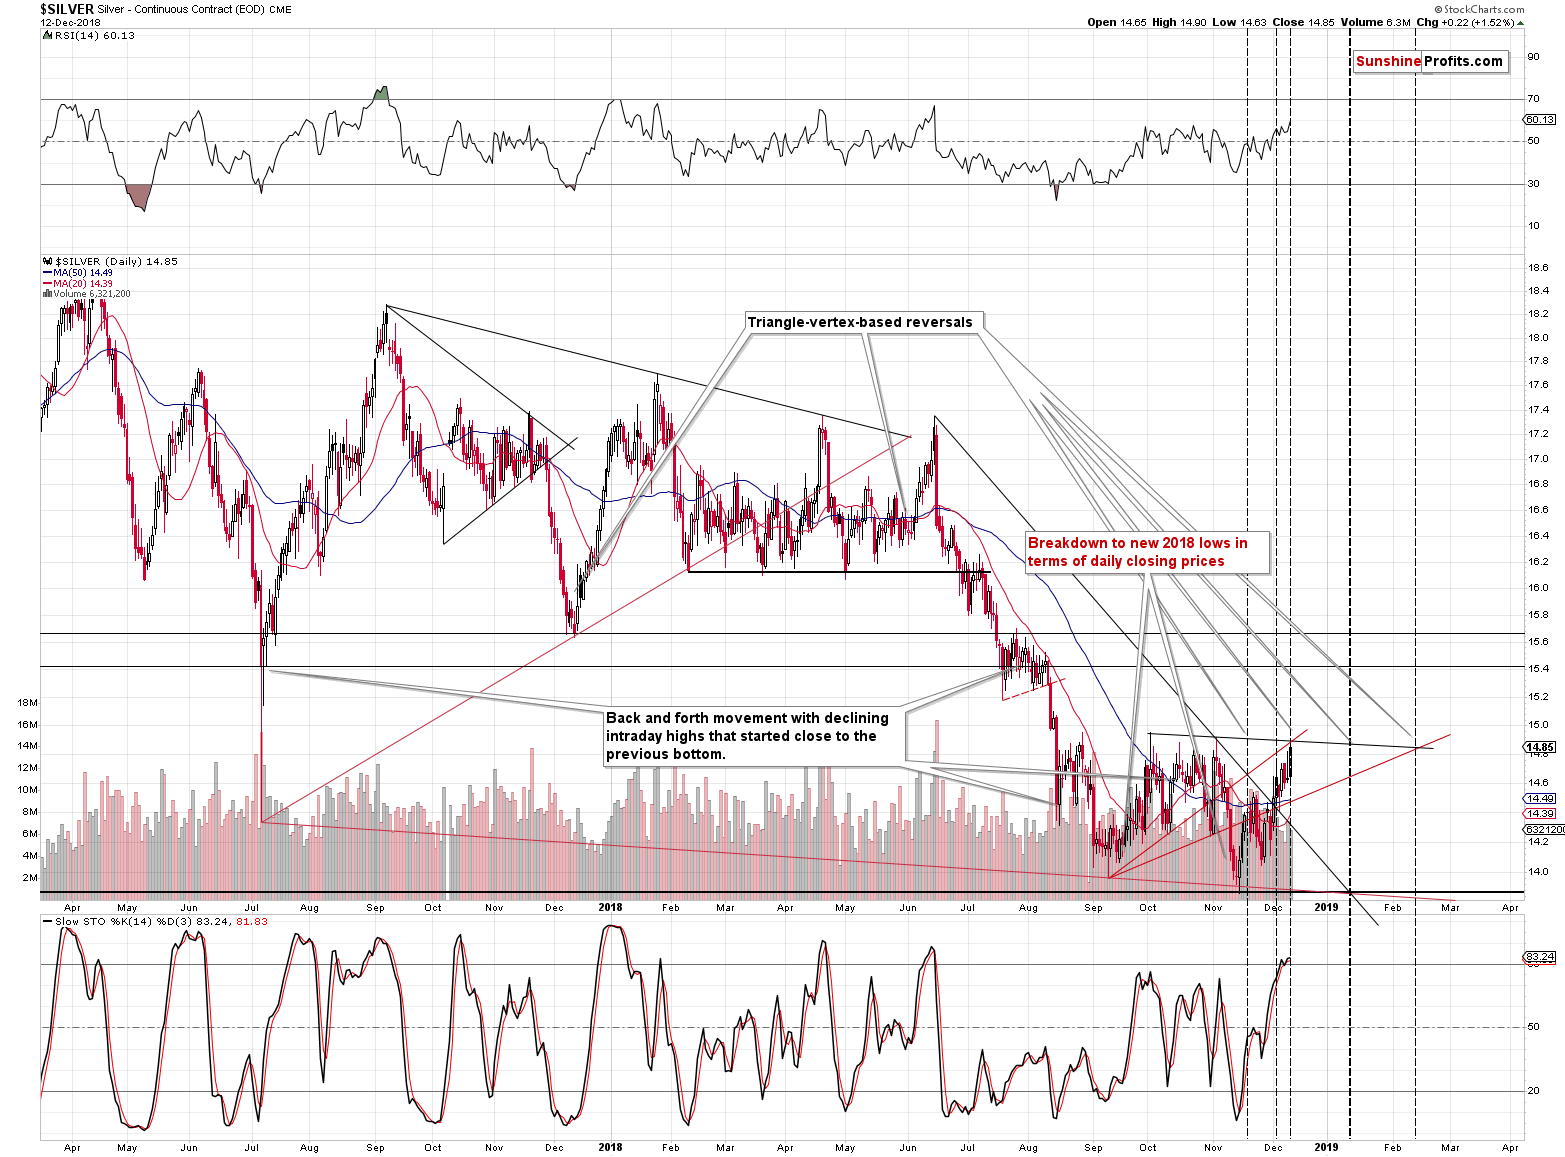
Silver’s rally without gold’s help means strong outperformance of the former. It’s a full-size repeat of the sign that we saw on an intraday basis on Tuesday. Silver tends to outperform gold on a short-term basis (sometimes only on an intraday basis) right before big declines. This has been the case multiple times and yet people – especially beginning investors – are still surprised by this phenomenon. We remember very well how bullish many people became in mid-June, when silver soared. We wrote that it was just a sell confirmation and it was quite difficult to believe. Yet, that was the top that started the $3+ decline in the white metal.
On June 12th, we wrote the following:
Silver has indeed moved higher yesterday, and it erased some of the gains in today’s pre-market trading ($16.84 at the moment of writing these words), so it’s already back below the previous June high. Did the move make the outlook significantly bullish? Not at all as it was not accompanied by strength in the gold market (extremely low volume during a small upswing in the GLD ETF is the opposite of strength) and the accompanying mining stocks’ rally was not as significant as it may appear at the first sight.
The above seems to be up-to-date also today. In particular, the part that we put in bold as gold’s volume was once again very low.
Silver moved higher, outperforming gold, it reached its resistance level and it all happened at silver’s triangle-vertex-based reversal. That’s a bearish, not bullish combination.
What about mining stocks?
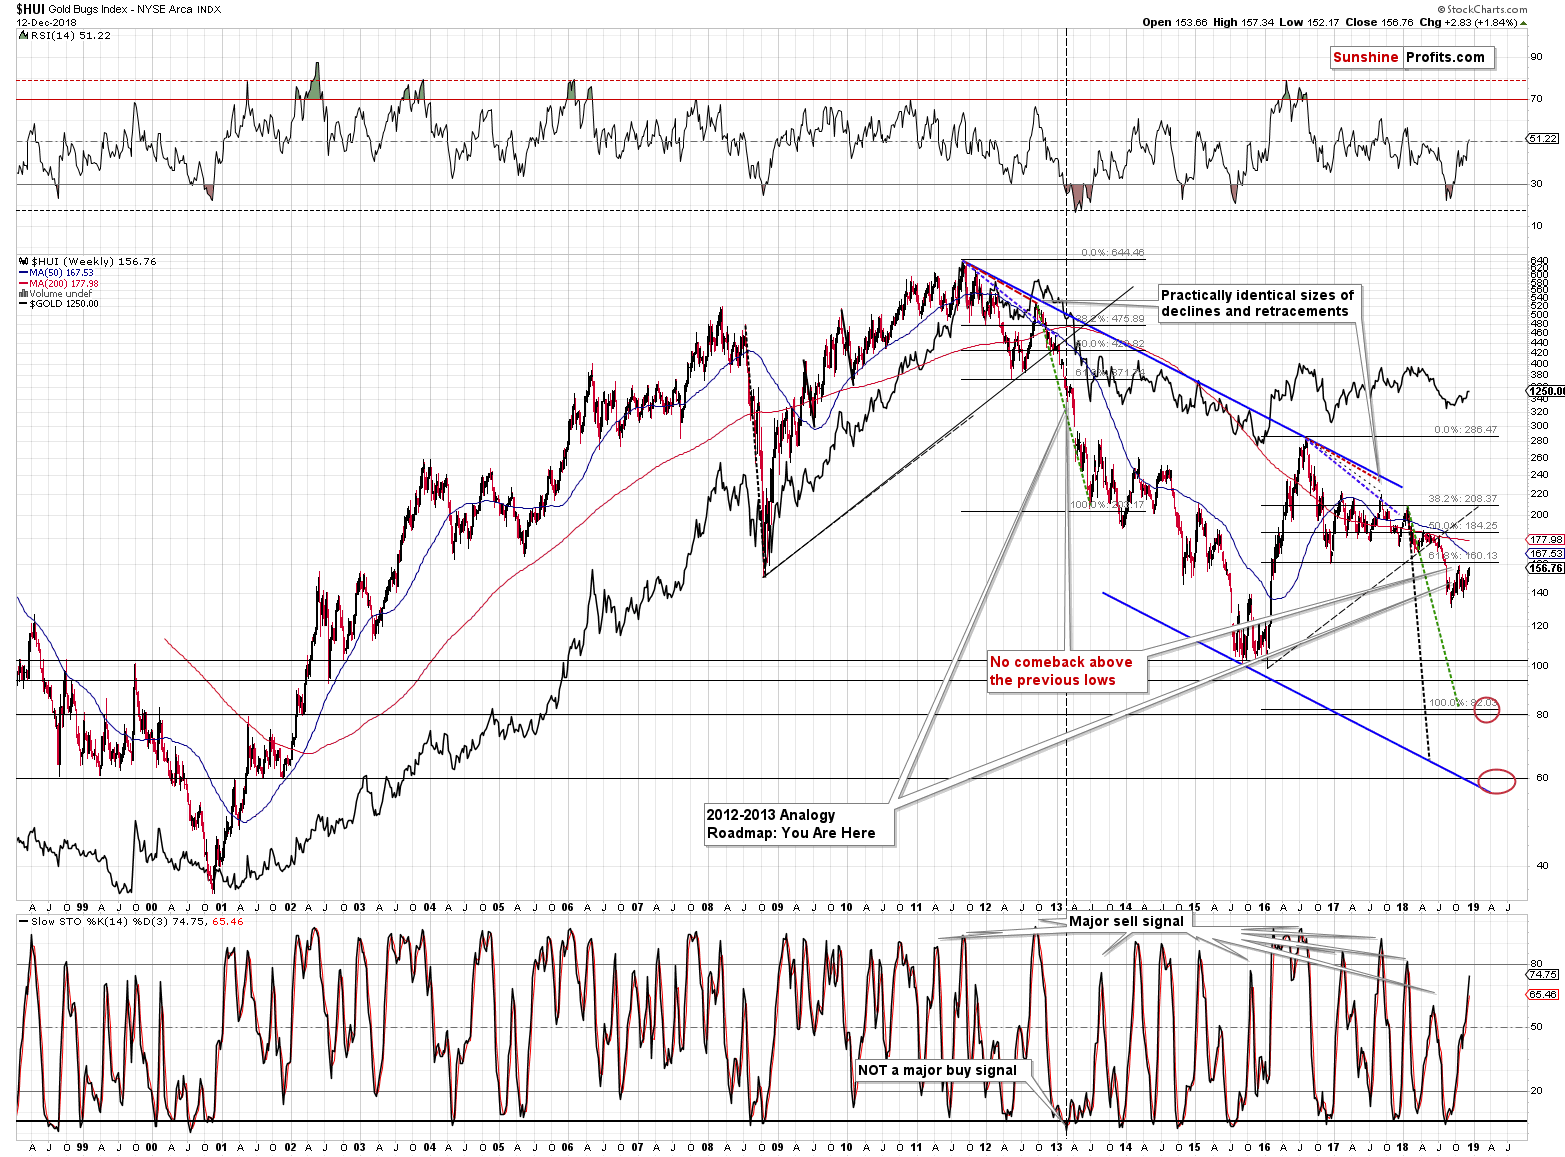
From the most important perspective, absolutely nothing changed. Gold miners are after a breakdown below the late-2016 bottom and have been consolidating below this low for a few months. Because of this consolidation, the market now appears ready for another big wave down.
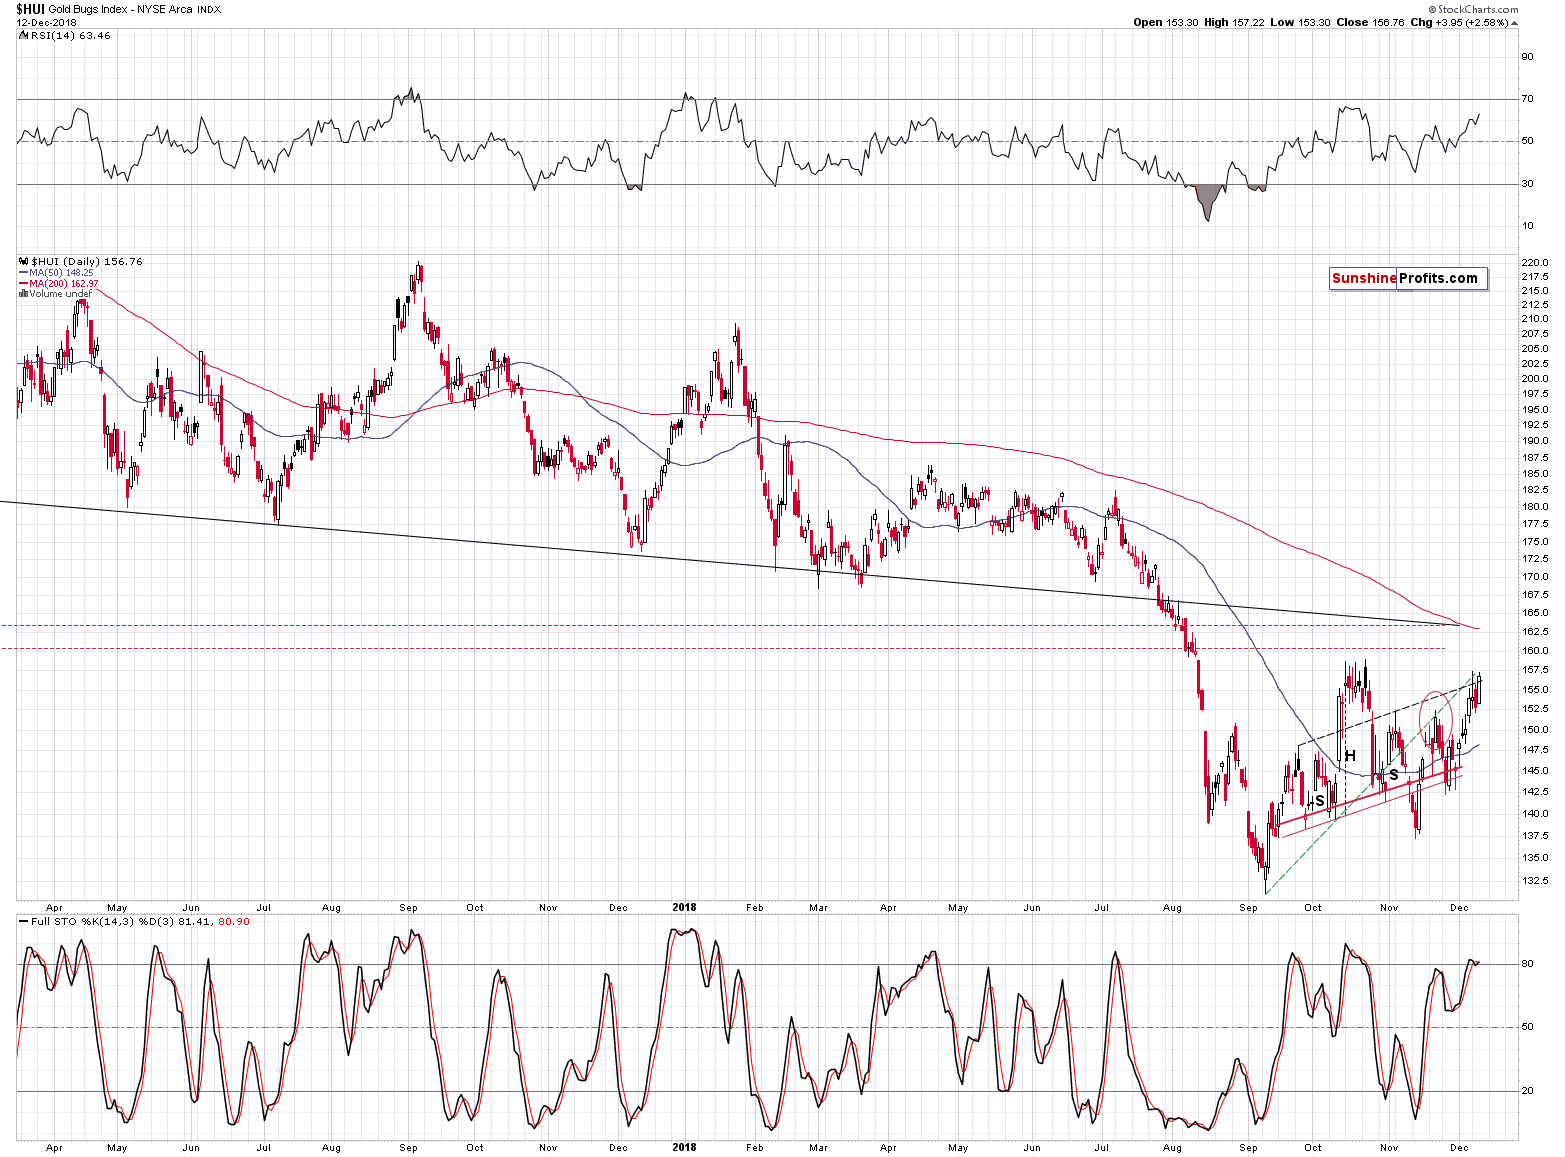
From the short-term point of view, we see that the HUI Index closed at a new high, even though it didn’t move to new intraday highs. It also didn’t move above the October intraday highs. Does it change anything? Not really – the breakout is small and definitely not confirmed. The 2016 bottom provides very strong resistance so any strength here is likely to be limited.
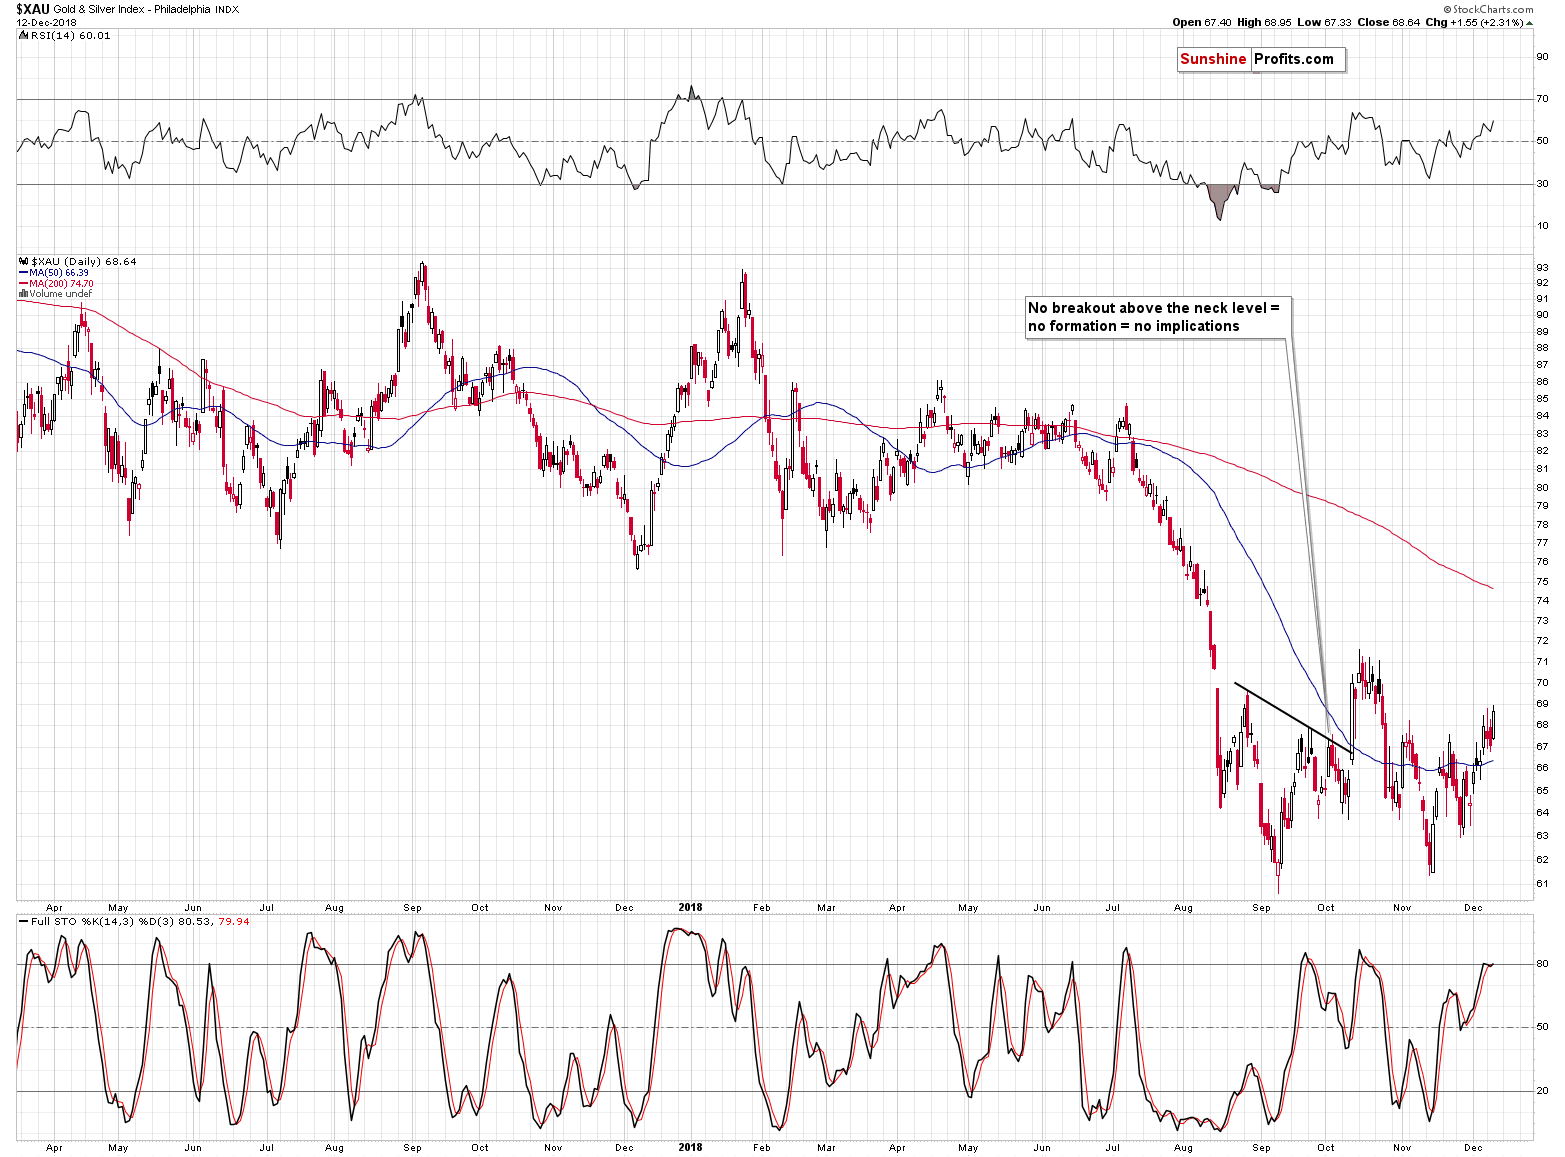
The XAU Index, another important proxy for the mining stocks, shows no breakout above the October highs, even in terms of the closing prices.
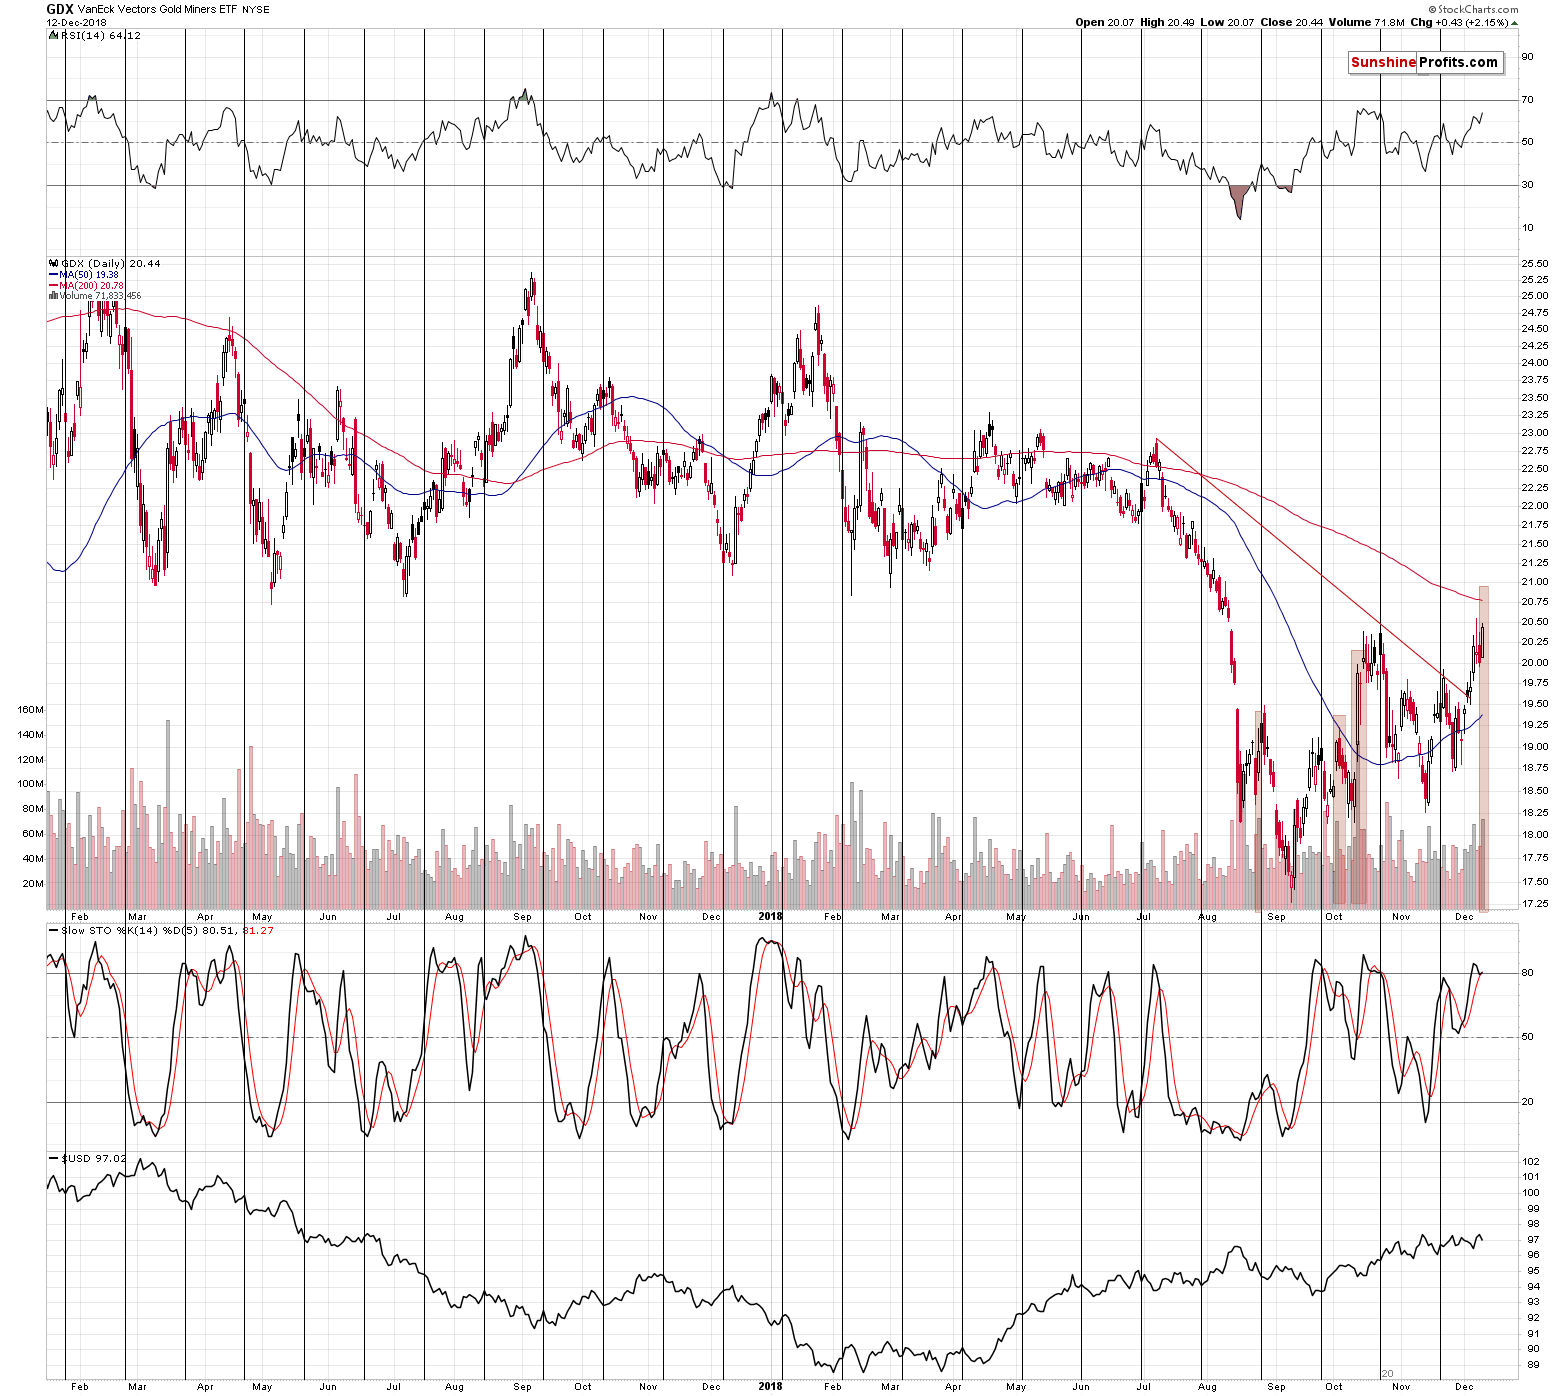
The GDX ETF, however, shows more strength and a move above the previous highs in terms of the closing prices. Since other proxies for the precious metals mining stocks don’t show analogous signal, it’s not the thing that’s particularly important. The thing that does appear important is the volume on which mining stocks rallied.
A rally on big volume is a bullish sign, right? It usually is, but before applying what makes sense usually, it’s a good idea to check if something really works on a given market. We marked a few of the recent cases when the GDX rallied on significant volume and it turns out that there were quite often signs that the rally is ending (we marked those cases on the above chart). It was not always the case, though. For instance, in mid-November, a rally on significant volume was indeed the start of a rally, not its end. So, what are the implications of the strong-volume rally?
Before providing the answer, let’s the GDX to GLD ratio in order to check what happened when the volume in mining stocks was much bigger than the volume in gold.
The ratio of volumes was indeed huge and we put a horizontal dashed line on the chart to make it easier to compare yesterday’s reading to the previous values. It turns out that there were only a few similar cases and while some of them were followed by gold’s rallies, some of them were followed by gold’s declines.
All in all, the above suggests that the big-volume rally in the miners is simply… inconsequential. It has no implications as similar cases were followed by both: rallies and declines.
Why are we discussing it if it doesn’t have any implications? Because a rally on sizable volume is a classic buy signal and we would likely receive a question about it shortly anyway. We really do try to find things that invalidate our outlook and we analyze them in order to make sure that we are indeed on the correct side of this trade.
Fortunately, the volume signals can come from more instruments than just from the GDX ETF. While the latter are not reliable, there are some that are. We already commented on the big volume readings in silver stocks, but it seems to be a good idea to quote them once again in order to show what a coherent volume-based signal looks like.
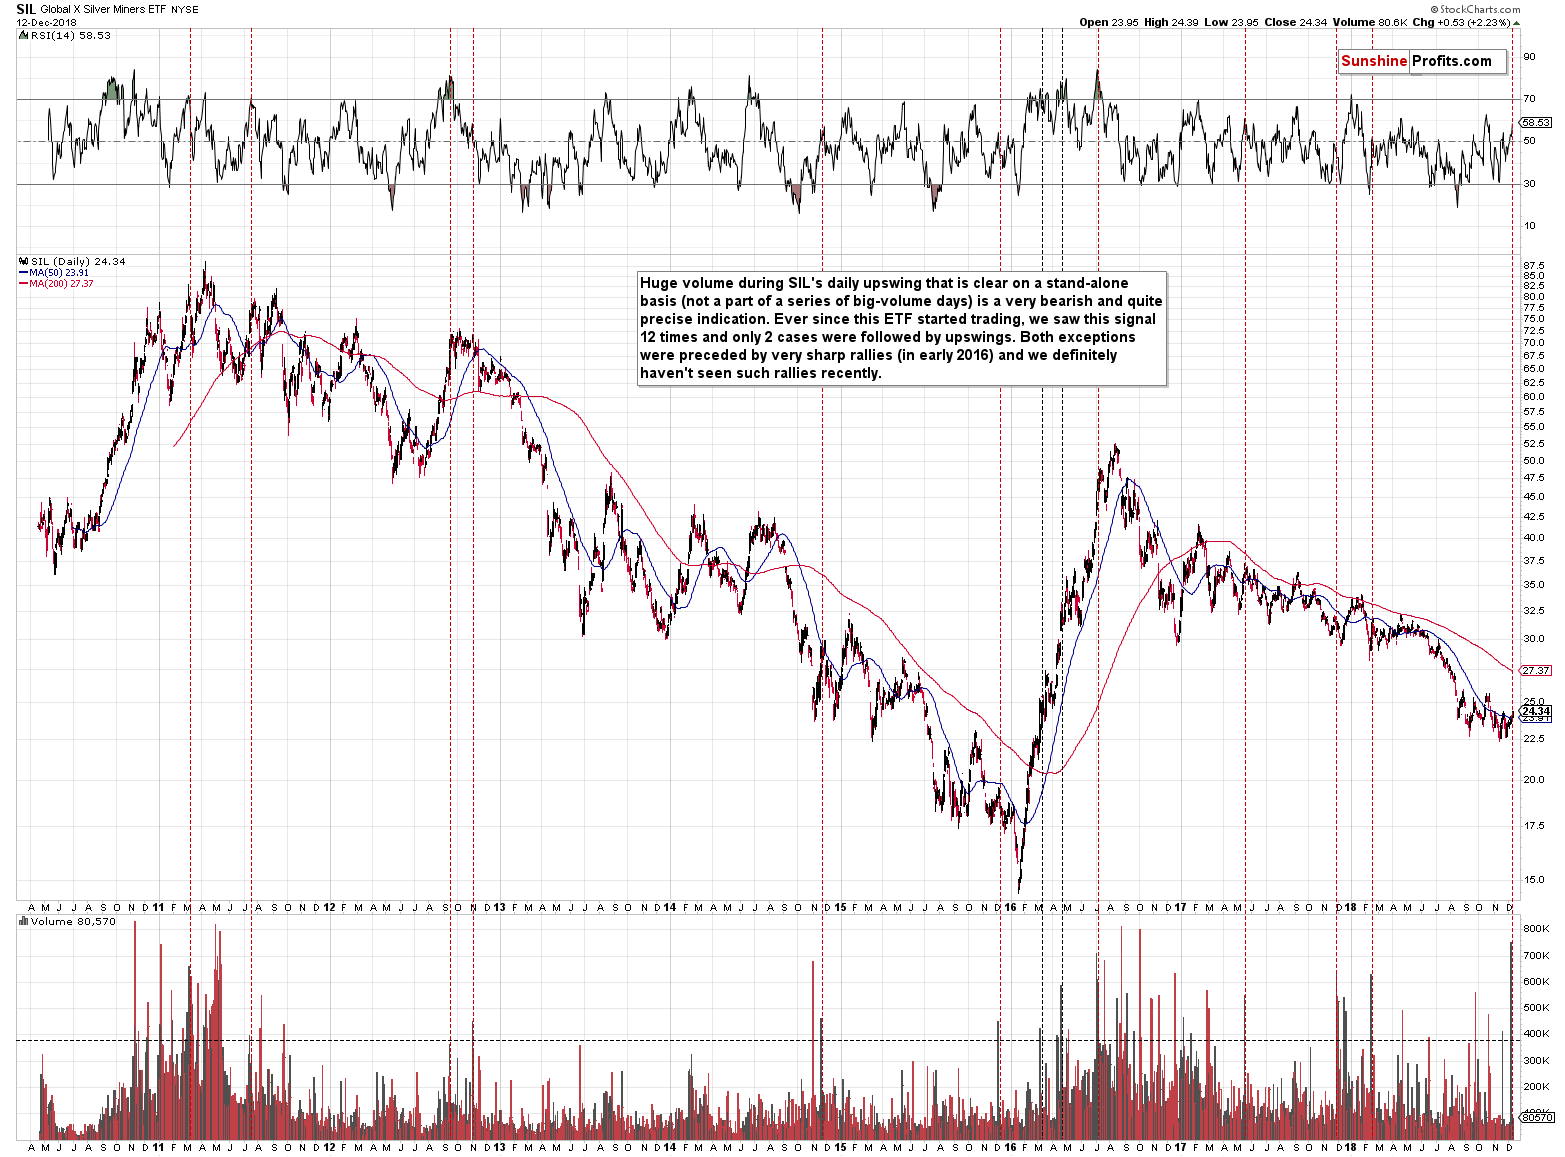
It was the volume on which silver stocks (the SIL ETF) rallied that was so extreme. It was the highest – ever – volume on which it moved higher during the day. There were higher volume readings during the declines, but never during the upswings. However, it is not that important that it was the record. It’s the fact that the volume was extremely high that makes it an extremely important signal.
The importance comes from the efficiency with which it signaled the same outcome, from the frequency, and from the fact that these signals were not all concentrated in the same period, but that they were spread over the course of the past years.
In 10 out of 12 previous cases when we saw extremely high volume during daily upswings, it was the end of a rally or very close to its end and in all these 10 cases it was a great shorting opportunity. Out of these 10 cases, the one that was followed by the biggest declines in the following months, was the one in late 2012. It was also the only case when we saw this signal after a consolidation. The only other time when we saw the spike in the daily volume during an upswing after a consolidation was… On Friday. The implications are very bearish.
The important analytical detail here is that we are considering the huge-volume sessions that were not preceded by volume that was similarly big. The reason is that if the volume is high in general, a single day’s high value is not as meaningful as if it’s a single huge-volume session among the low-volume days. In case of the former, the high volume is close to normal, while in case of the latter, it’s extreme. If you’re going 50 miles per hour and accelerate in 4 seconds to 60 miles per hour it’s nowhere close to being as extreme as if you increase to 60 miles per hour in 4 seconds starting from 0.
USD Index: Self-similarity and Link with Gold
Yesterday’s rally in silver makes our comments on the USD Index and the self-similarity between now and April even more up-to-date than they were yesterday. Quoting our previous analysis:
The outlook for the USD Index did not change based on Friday’s relatively small decline. Yes, that was the lowest daily close in 2 weeks, but the thing that matters is that we saw a breakdown below only one support line and it was just one daily close below it. This means that it’s not confirmed and thus not particularly meaningful at this time. The breakdown was below the rising red dashed line. The more short-term, solid, black line and the more long-term, dashed, blue line were not touched, let alone broken.
(…)
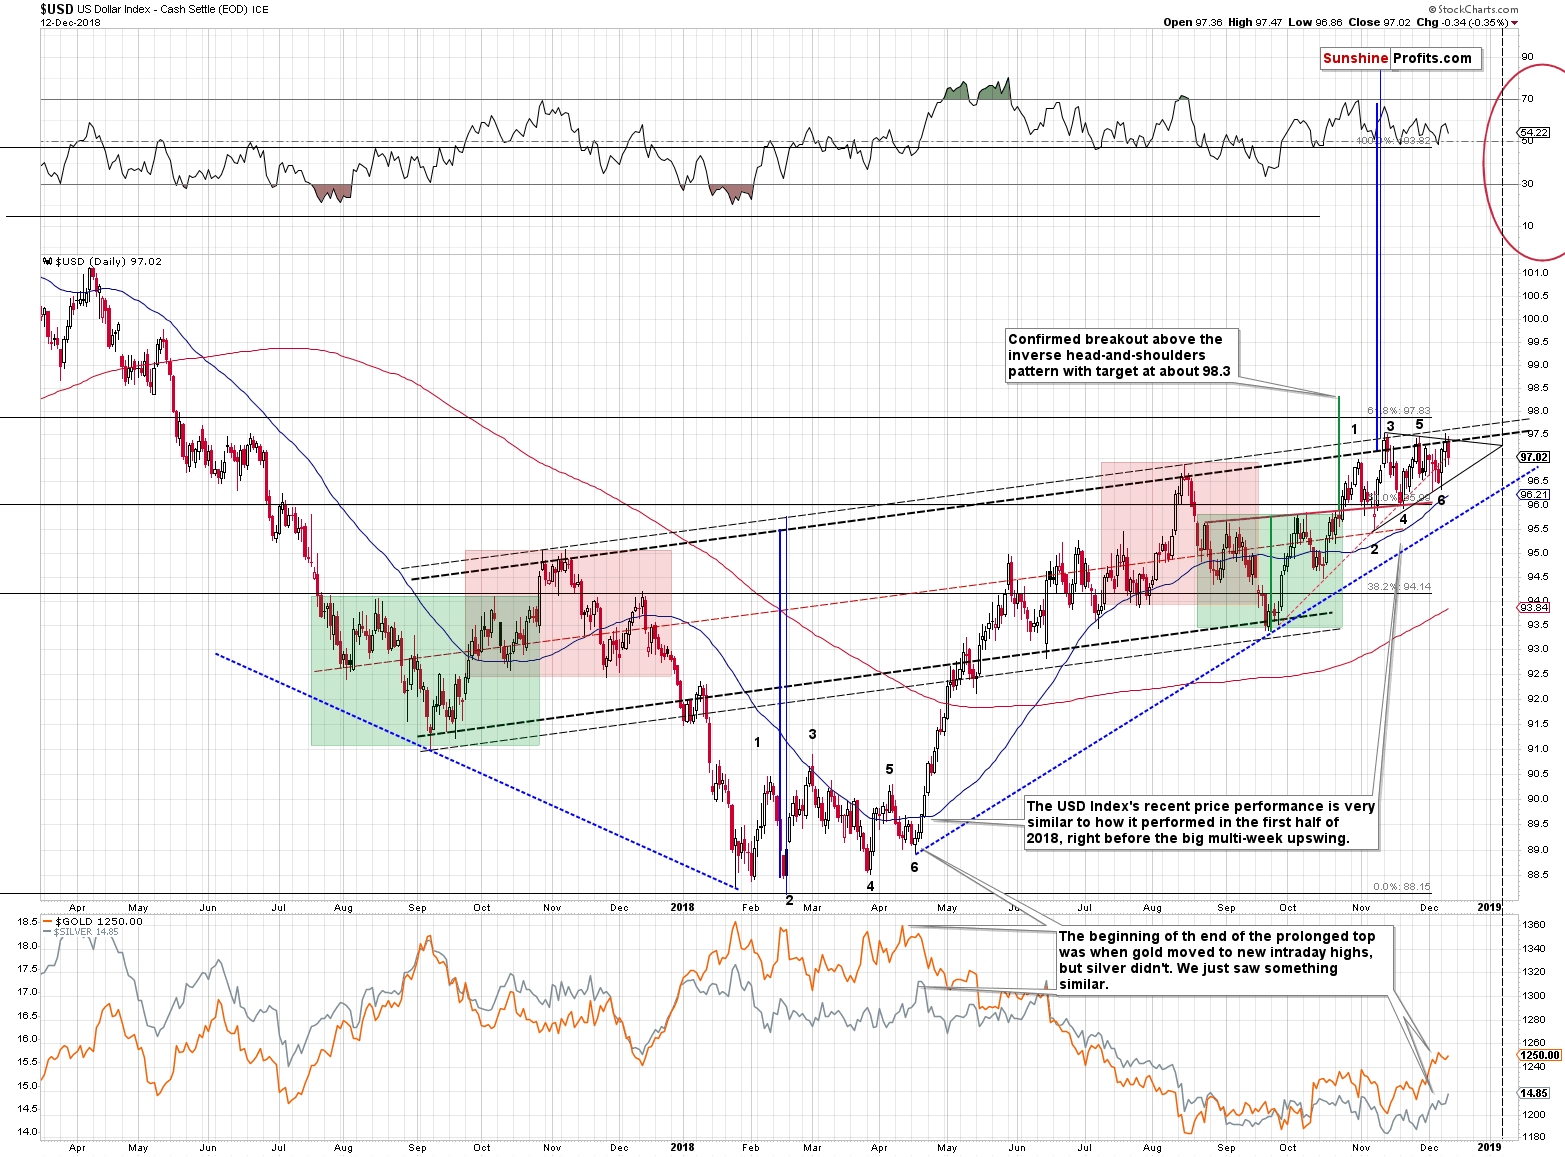
The situation in the USD Index has been developing in a very interesting manner recently. The USD Index has been following reflective pattern, where the 2017-2018 decline was reflected in the shape of the 2018 rally. The areas marked with red and green show similar patterns (head-and-shoulders and inverse head-and-shoulders patterns).
However, in the last few weeks, the pattern is somewhat unclear. While the move preceding the entire pattern (the decline up to July 2017) was an almost a straight line lower, the current price moves take form of a consolidation. The start of the pattern was quick, but the end of the pattern is prolonged. Why would that be?
It looks like if someone (or several investors / institutions / central banks) really doesn’t want to let the USDX to break above the neck level of the inverse head-and-shoulders pattern. The pattern is big and clear, and it’s quite obvious that breaking above the neck level thereof would very likely result in much higher USDX values. We have no proof that this is indeed the case, but it certainly looks that way – whenever the price moves close to the neckline, the USD gets pushed lower. It rallies again, and it gets hammered again. And again. The situation becomes very tense, like a coiled spring, and once the USDX finally breaks out, it’s likely to rally fast. After all, the market forces always prevail in the end.
Putting the “why” behind the price moves aside, let’s take a look at something that would be important even if the “why” behind the recent back-and-forth trading was entirely different.
The shape of the recent sideways trading is very similar to what we saw in the first half of the year, when the USD Index was bottoming. We marked the subsequent tops and bottoms with numbers from 1 to 6. The top number 3 was the highest one in both cases and all lows were higher than the previous ones.
The most interesting thing is that the similarity doesn’t end with the USD Index. It was the time when gold moved a bit above its previous high in intraday terms, while silver didn’t. It was also the time when the mining stocks underperformed gold in a visible way. We have exactly the same thing right now. The implications are bullish for the USD Index, and they are even more bearish for the PMs than they are bullish for the USDX.
(…) the highs #3 and #5 along with lows #2 and #6 form a triangle that has vertex in the first half of January, 2019. Consequently, we’re quite likely to see some kind of reversal close to January 7th, 2019.
We would like to supplement the above with another detail that further confirms the similarity between the recent back-and-forth trading and the early 2018 bottom. Please take a look at the shapes of each of the #2, #4, and #6 bottoms.
In both cases #2 bottom was volatile, the price ended above the intraday low, and the daily reversal was followed by a sharp upswing.
In both cases #4 bottom was characterized by a daily close near the intraday low and it was followed by a quick rally that was not as big as the one that followed the #2 bottom.
In both cases #6 bottom took form of a double bottom.
The similarity is undeniable. The implications are very bullish for the USD Index.
However, the implications are even more bearish for the precious metals market because of the paragraph that we put in bold above. Gold moved higher in the recent weeks despite the back-and-forth trading in the USDX. This appears bullish at the first sight, but it’s important to note that this was also the case between mid-March and mid-April. This would have not been so important if it wasn’t for the clear self-similarity in the USD Index. It’s not only in the USD – it’s also in the way gold reacts to USD’s changes.
And you know what? Gold mostly ignored USD’s strength after the #6 bottom in April, so it’s not surprising or bearish that it didn’t plunge yesterday despite a decent upswing in the US currency. It took a few days for the precious metals investors to catch up with the new reality, which was rallying USD Index. And it was THE rally of the year (at least so far). It was also what preceded THE decline of the year (at least so far) in the precious metals. Is the gold-USD link at this time really bullish for the yellow metal? No, it’s not. The investors and traders are likely to catch up with their reaction once it becomes apparent that the USD Index is really moving higher, and not topping here. Good news is that this should take place right now or shortly.
[Tuesday’s] session was in perfect tune with what we saw in the second half of April – we saw another daily rally, to which gold and silver didn’t respond yet. But, we also saw something else that makes the similarity to April even clearer.
Silver outperformed gold, which is a classic top-is-in confirmation - at least for those, who have been following this market and our analyses for some time. It did so only on an intraday basis, but that’s enough for the signal to be important. And for it to be similar to what happened in April. It was the white metal’s outperformance that marked the very end of the consolidation and the beginning of the biggest decline of the year.
Silver outperformed only in terms of the daily closing prices, which makes the April-now link even stronger.
Summary
Summing up, this prolonged correction within the big downtrend has been very tiring, but based on the long-term factors being patient was very well worth it, and based on the short-term signs, it seems that the waiting is over or about to be over. The outlook for the precious metals market remains very bearish for the following weeks and months and short position remains justified from the risk to reward point of view, even if we see a few extra days of back and forth trading or even a small brief upswing. There is a very high probability of a huge downswing that makes the short position justified, not the outlook for the next few days.
As always, we’ll keep you – our subscribers – informed.
To summarize:
Trading capital (supplementary part of the portfolio; our opinion): Full short positions (250% of the full position) in gold, silver and mining stocks are justified from the risk/reward perspective with the following stop-loss orders and exit profit-take price levels:
- Gold: profit-take exit price: $1,062; stop-loss: $1,272; initial target price for the DGLD ETN: $82.96; stop-loss for the DGLD ETN $47.17
- Silver: profit-take exit price: $12.32; stop-loss: $15.11; initial target price for the DSLV ETN: $47.67; stop-loss for the DSLV ETN $28.37
- Mining stocks (price levels for the GDX ETF): profit-take exit price: $13.12; stop-loss: $20.83; initial target price for the DUST ETF: $80.97; stop-loss for the DUST ETF $24.87
Note: the above is a specific preparation for a possible sudden price drop, it does not reflect the most likely outcome. You will find a more detailed explanation in our August 1 Alert. In case one wants to bet on junior mining stocks’ prices (we do not suggest doing so – we think senior mining stocks are more predictable in the case of short-term trades – if one wants to do it anyway, we provide the details), here are the stop-loss details and target prices:
- GDXJ ETF: profit-take exit price: $17.52; stop-loss: $31.23
- JDST ETF: initial target price: $154.97 stop-loss: $51.78
Long-term capital (core part of the portfolio; our opinion): No positions (in other words: cash)
Insurance capital (core part of the portfolio; our opinion): Full position
Important Details for New Subscribers
Whether you already subscribed or not, we encourage you to find out how to make the most of our alerts and read our replies to the most common alert-and-gold-trading-related-questions.
Please note that the in the trading section we describe the situation for the day that the alert is posted. In other words, it we are writing about a speculative position, it means that it is up-to-date on the day it was posted. We are also featuring the initial target prices, so that you can decide whether keeping a position on a given day is something that is in tune with your approach (some moves are too small for medium-term traders and some might appear too big for day-traders).
Plus, you might want to read why our stop-loss orders are usually relatively far from the current price.
Please note that a full position doesn’t mean using all of the capital for a given trade. You will find details on our thoughts on gold portfolio structuring in the Key Insights section on our website.
As a reminder – “initial target price” means exactly that – an “initial” one, it’s not a price level at which we suggest closing positions. If this becomes the case (like it did in the previous trade) we will refer to these levels as levels of exit orders (exactly as we’ve done previously). Stop-loss levels, however, are naturally not “initial”, but something that, in our opinion, might be entered as an order.
Since it is impossible to synchronize target prices and stop-loss levels for all the ETFs and ETNs with the main markets that we provide these levels for (gold, silver and mining stocks – the GDX ETF), the stop-loss levels and target prices for other ETNs and ETF (among other: UGLD, DGLD, USLV, DSLV, NUGT, DUST, JNUG, JDST) are provided as supplementary, and not as “final”. This means that if a stop-loss or a target level is reached for any of the “additional instruments” (DGLD for instance), but not for the “main instrument” (gold in this case), we will view positions in both gold and DGLD as still open and the stop-loss for DGLD would have to be moved lower. On the other hand, if gold moves to a stop-loss level but DGLD doesn’t, then we will view both positions (in gold and DGLD) as closed. In other words, since it’s not possible to be 100% certain that each related instrument moves to a given level when the underlying instrument does, we can’t provide levels that would be binding. The levels that we do provide are our best estimate of the levels that will correspond to the levels in the underlying assets, but it will be the underlying assets that one will need to focus on regarding the signs pointing to closing a given position or keeping it open. We might adjust the levels in the “additional instruments” without adjusting the levels in the “main instruments”, which will simply mean that we have improved our estimation of these levels, not that we changed our outlook on the markets. We are already working on a tool that would update these levels on a daily basis for the most popular ETFs, ETNs and individual mining stocks.
Our preferred ways to invest in and to trade gold along with the reasoning can be found in the how to buy gold section. Additionally, our preferred ETFs and ETNs can be found in our Gold & Silver ETF Ranking.
As a reminder, Gold & Silver Trading Alerts are posted before or on each trading day (we usually post them before the opening bell, but we don't promise doing that each day). If there's anything urgent, we will send you an additional small alert before posting the main one.
=====
Latest Free Trading Alerts:
Zero. The US inflation rate was unchanged in November. What does the flat CPI mean for the gold market?
Does Flat CPI in November Imply Flat Gold?
Stocks gained yesterday, but they reversed their intraday upward course again. So, is this a new uptrend or just another advance within a two-month-long consolidation?
Uncertainty Following Recent Advance, S&P 500 Still Below 2,700
=====
Hand-picked precious-metals-related links:
PRECIOUS-Gold dips as stocks rally; palladium scales new peak
=====
In other news:
ECB Ends Historic Stimulus Push With Bet on Economic Growth
UK Prime Minister Theresa May wins confidence vote, but faces uphill battle to pass Brexit deal
Swiss National Bank keep expansive policy, cuts inflation view
Norway's central bank keeps rates on hold, sees slower tightening
China's central bank governor says economic growth is nearing potential
Oil falls below $60 a barrel as inventories stay high
=====
Thank you.
Sincerely,
Przemyslaw Radomski, CFA
Editor-in-chief, Gold & Silver Fund Manager
Gold & Silver Trading Alerts
Forex Trading Alerts
Oil Investment Updates
Oil Trading Alerts

