

Briefly: in our opinion, full (250% of the regular size of the position) speculative short positions in gold, silver and mining stocks are justified from the risk/reward perspective at the moment of publishing this Alert.
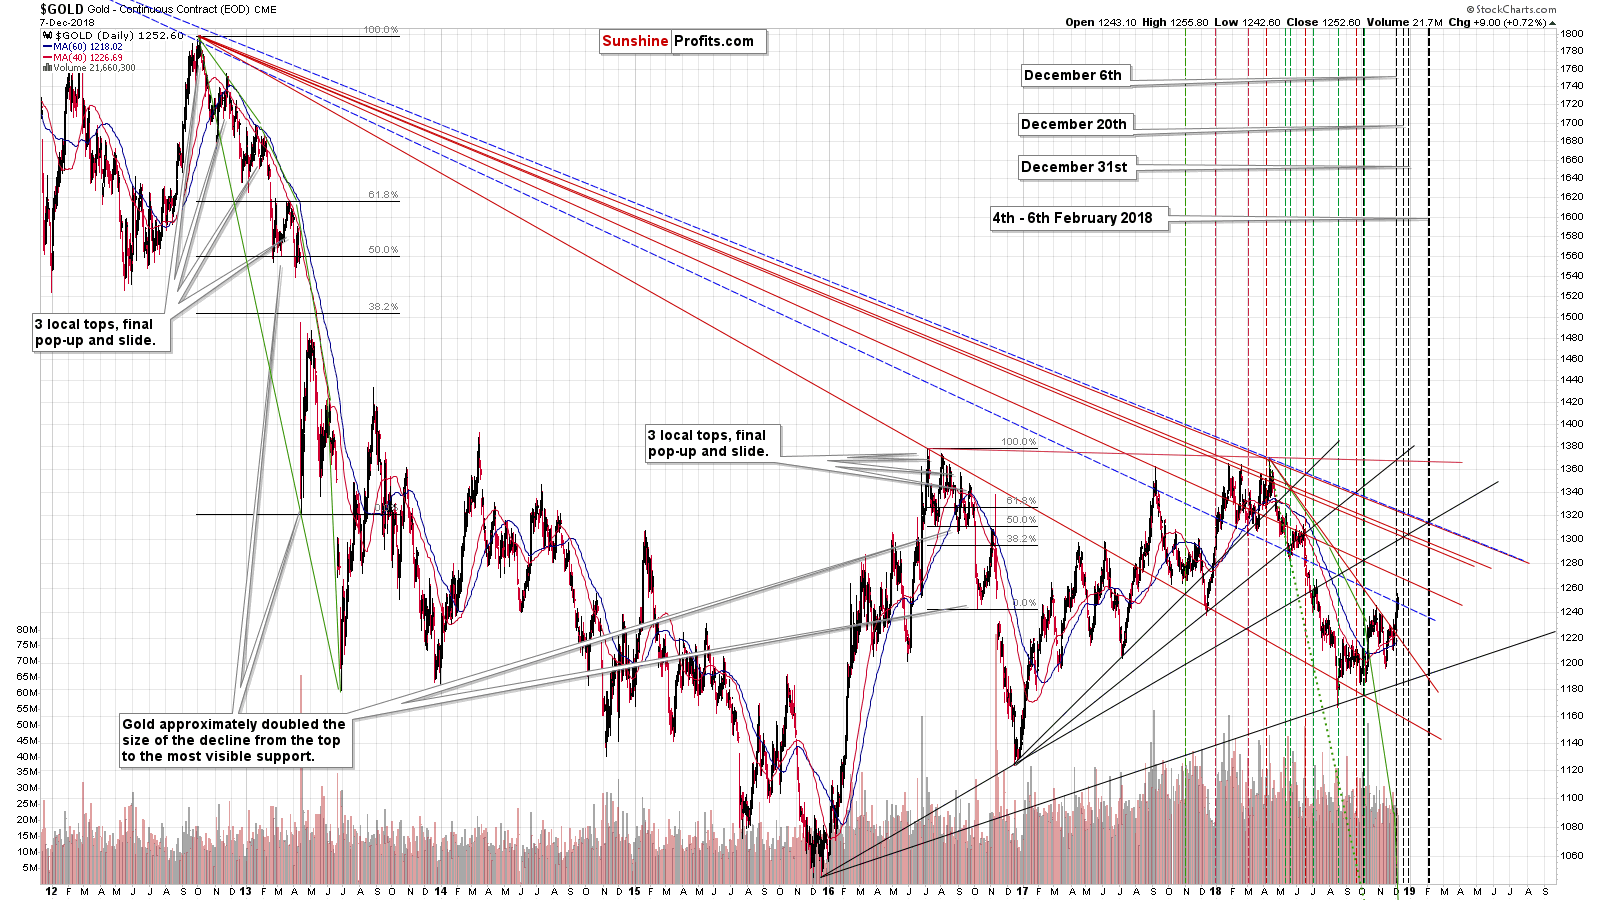
All the bearish techniques, all the bearish analogies, and all the sell signals… And gold is still rallying. At some point one has to revisit the charts and update them so that they reflect the reality, not one’s wishes. What was likely based on the past information is not necessarily what is still likely based on what we have right now. So what is likely now? After gold rallied above $1,250 pretty much without USD’s help? And given the first-time-in-years shocker that we just saw on Friday?
Exactly the same thing that was likely before. Gold rallied to $1,252.60, but so what? This does not mean any important breakout or invalidation of a previous breakdown. Precisely: it is a breakout above the 38.2% Fibonacci retracement level based on the April – August decline, but it’s only one daily close above it, which means that the breakout is not confirmed. Therefore, it is not yet particularly important.
Will New Signals Mean Changes for Gold?
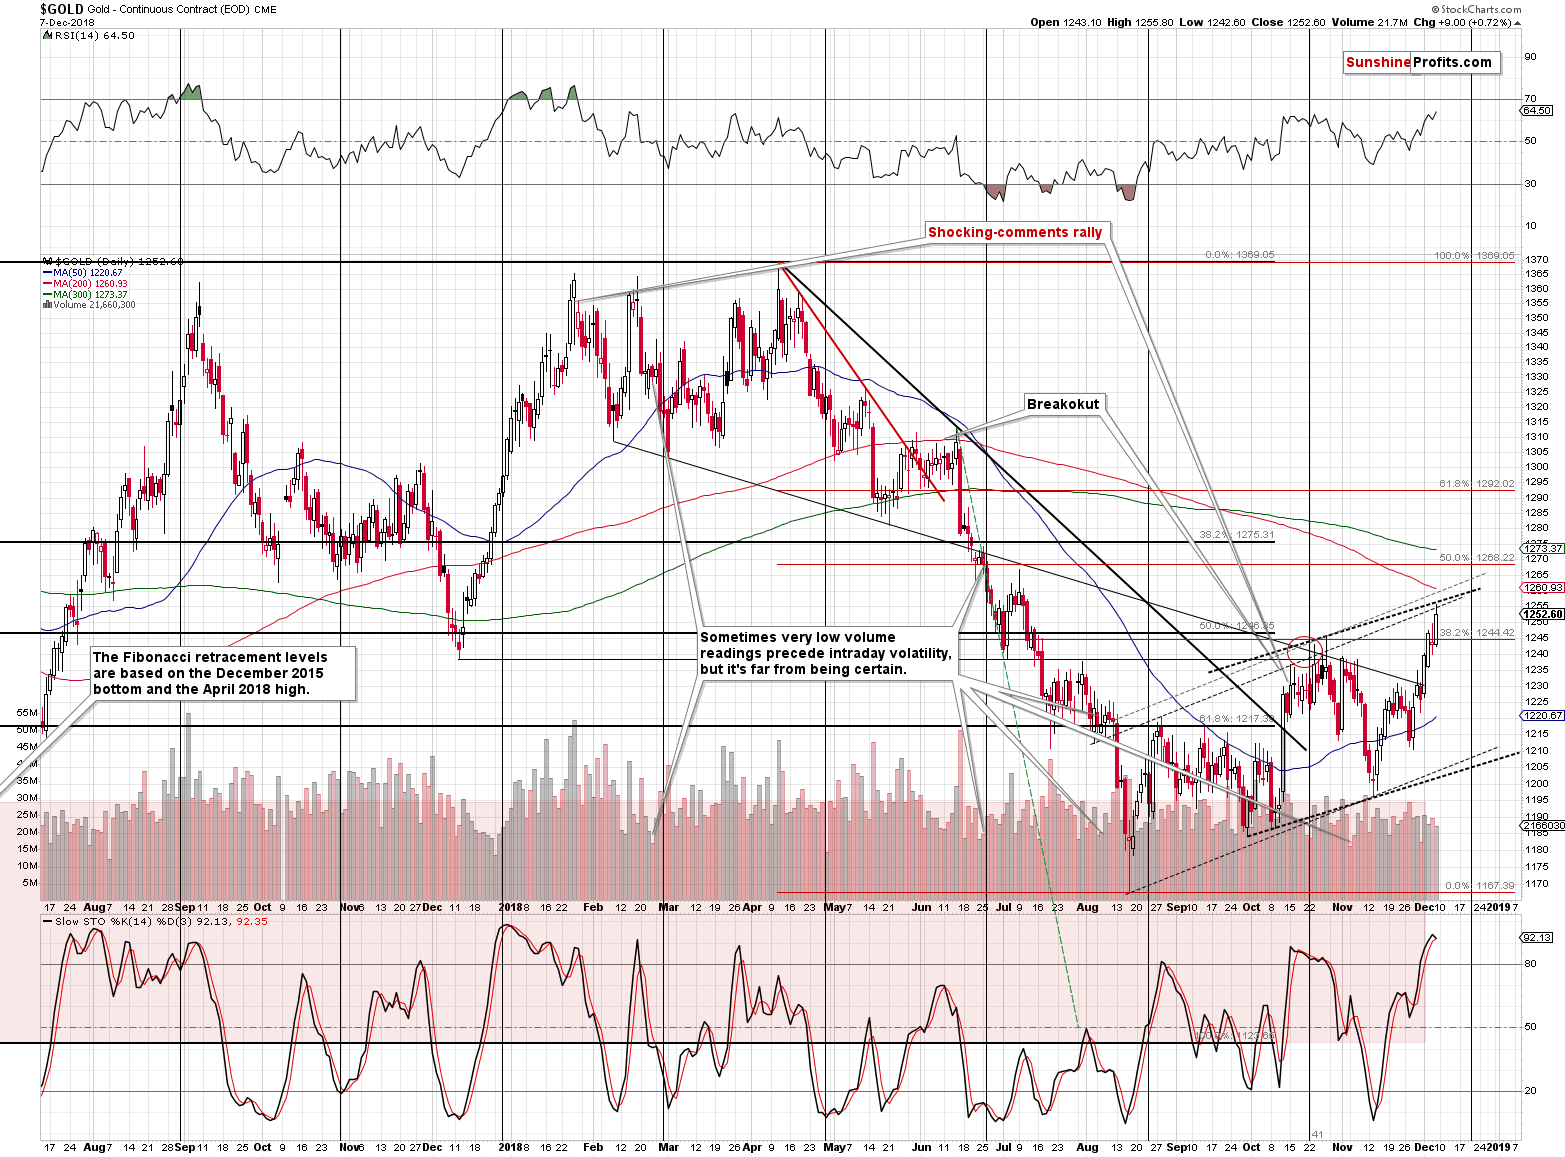
Gold also moved above the October highs, but that’s not a new development. It wasn’t accompanied by a strong or rising volume either. What also happened was that gold moved to the upper border of the rising trend channel (line that’s parallel to the line based on the previous lows) and then reversed. In fact, that happened with regard to two trend channels (thick and thin black, dashed lines). This is not a reason for gold to rally, but to decline.
Please note that there is also an additional way to draw the upper border of the rising trend channel that is based on the late-October high. In this case, the resistance is at about $1,260. Even if gold reaches this level, it will not change much from the technical point of view.
The situation in the indicators also supports the above-mentioned outcome. The RSI is at the levels at which it was in late March and early April – when the previous big decline started. The Stochastic indicator shows a tiny (but still) sell signal at very overbought levels. This is a bearish combination.
Having said that, let’s take a look at silver.
Silver’s Prolonged Consolidation
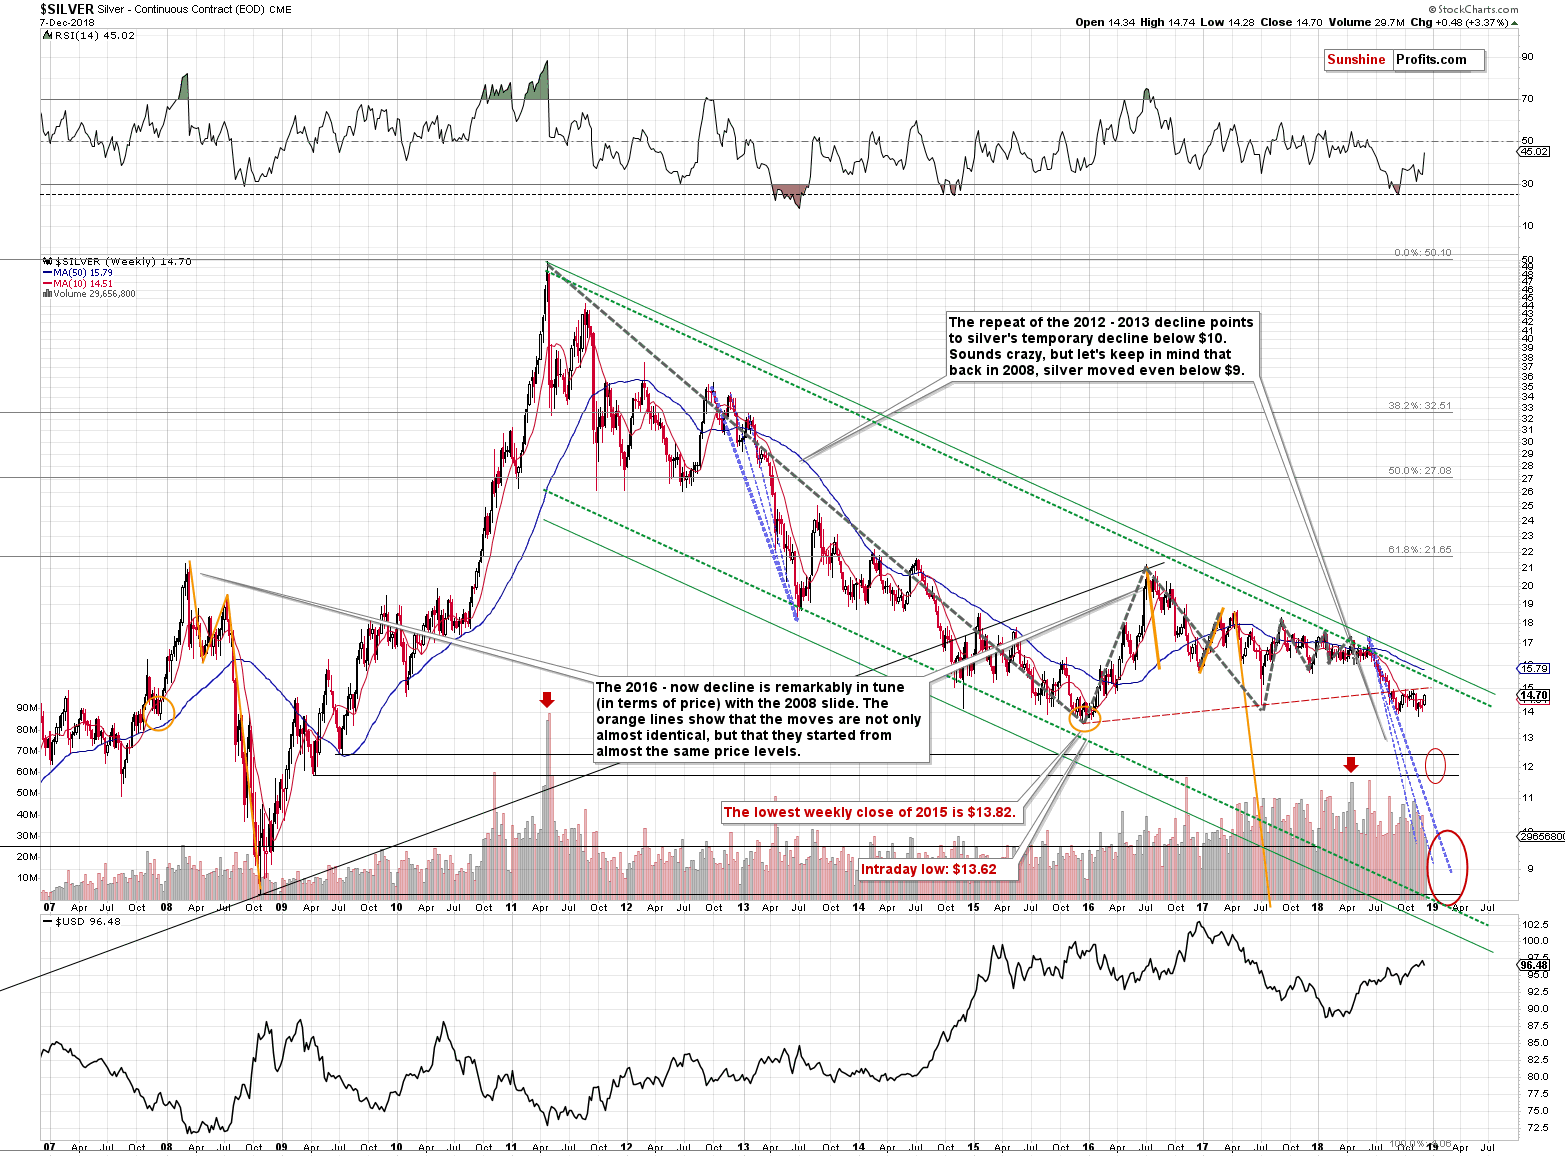
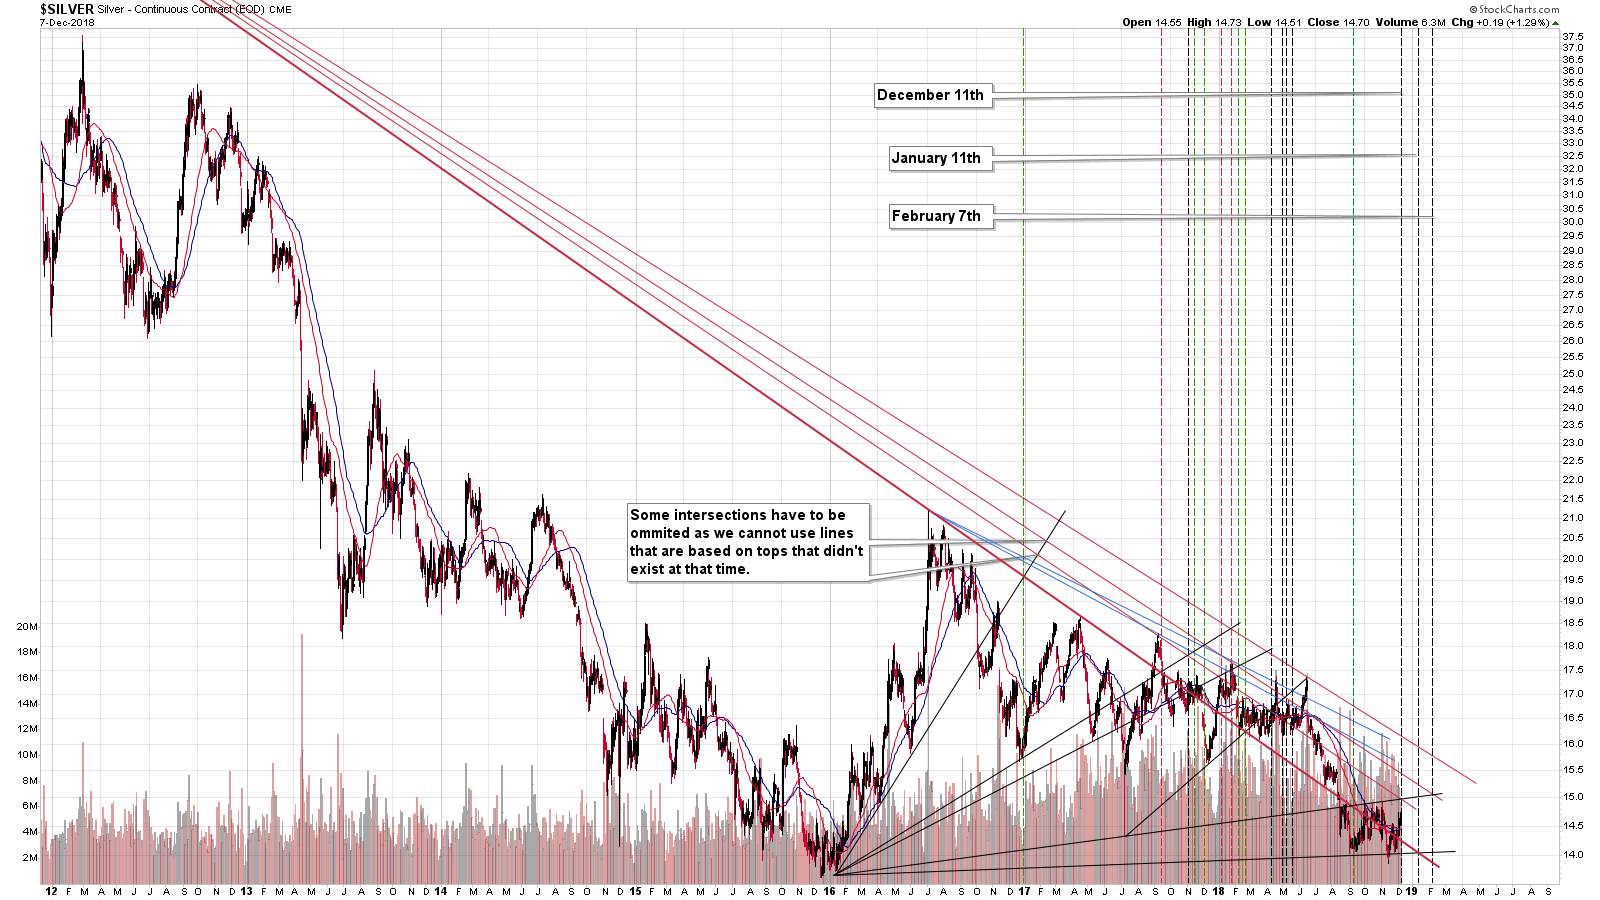
We’re starting with silver’s very long-term chart, because that’s the most important chart and the signal coming from it is the clearest. The white metal is after a major breakdown and after a prolonged consolidation. Consequently, silver is likely to decline substantially. Silver moved higher in the last few days and from the long-term perspective it changed absolutely nothing. In fact, even if silver moved a bit above its most recent local high, it wouldn’t change anything. Only an invalidation of the breakdown might change anything, and silver is not close to invalidating it.
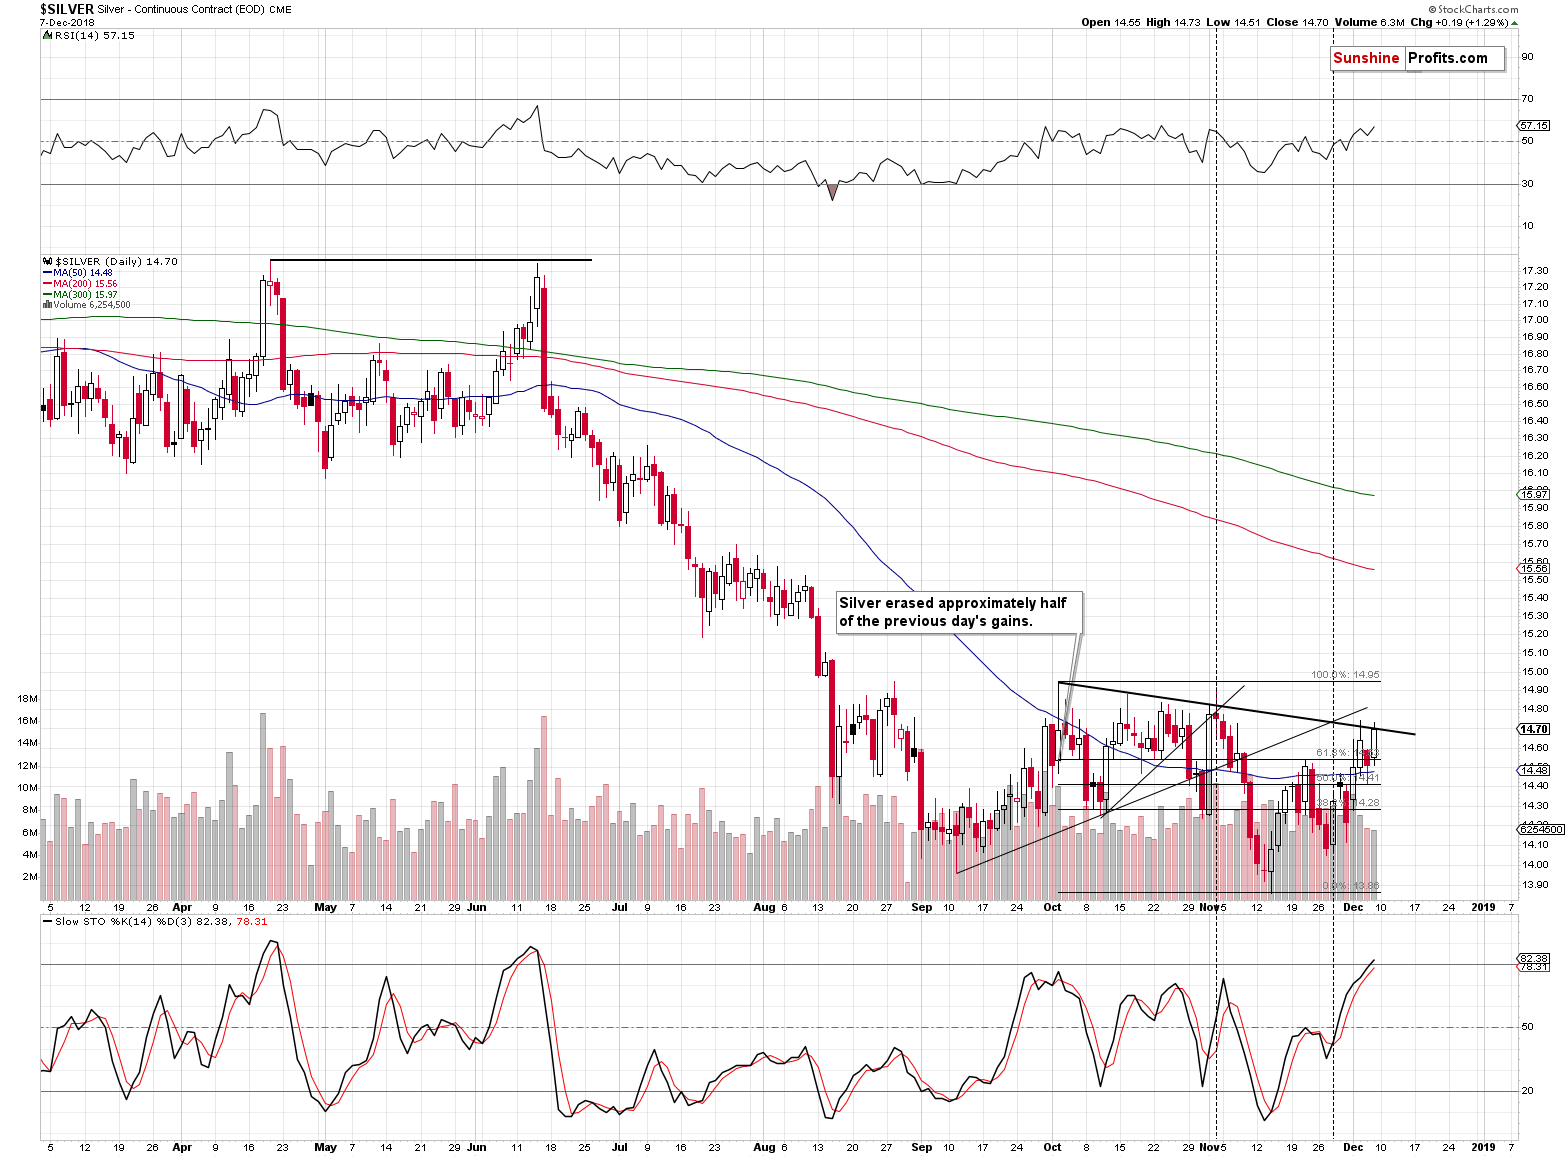
On a short-term basis, we see that silver is not at the October or November highs, but that it closed at the line that’s based on them. Even a move to any of these highs would not invalidate the bearish outlook as it would be in tune with what happened previously – for instance in June. Silver rallied, but only to the resistance in the form of the previous high. Will silver rally to the previous highs this time? Not necessarily.
Gold to silver ratio is after a major breakout so silver is less likely to show good performance. Then again, silver is known to outperform in the final parts of the upswings, so it would not be that surprising to see the white metal rally even though gold doesn’t. The former scenario, in which silver simply tops at its resistance, seems more probable, though.
Moreover, please note that the Stochastic indicator is above 80. There were only 2 similar cases in the previous months and when the indicator moved above this level both cases were excellent shorting opportunities. That was not the exact top, but it was close enough to a top and to the following sharp slide to view this as a good chance to be prepared for the upcoming decline. And we are definitely prepared now.
Did anything change for the mining stocks?
Gold Miners’ Outlook
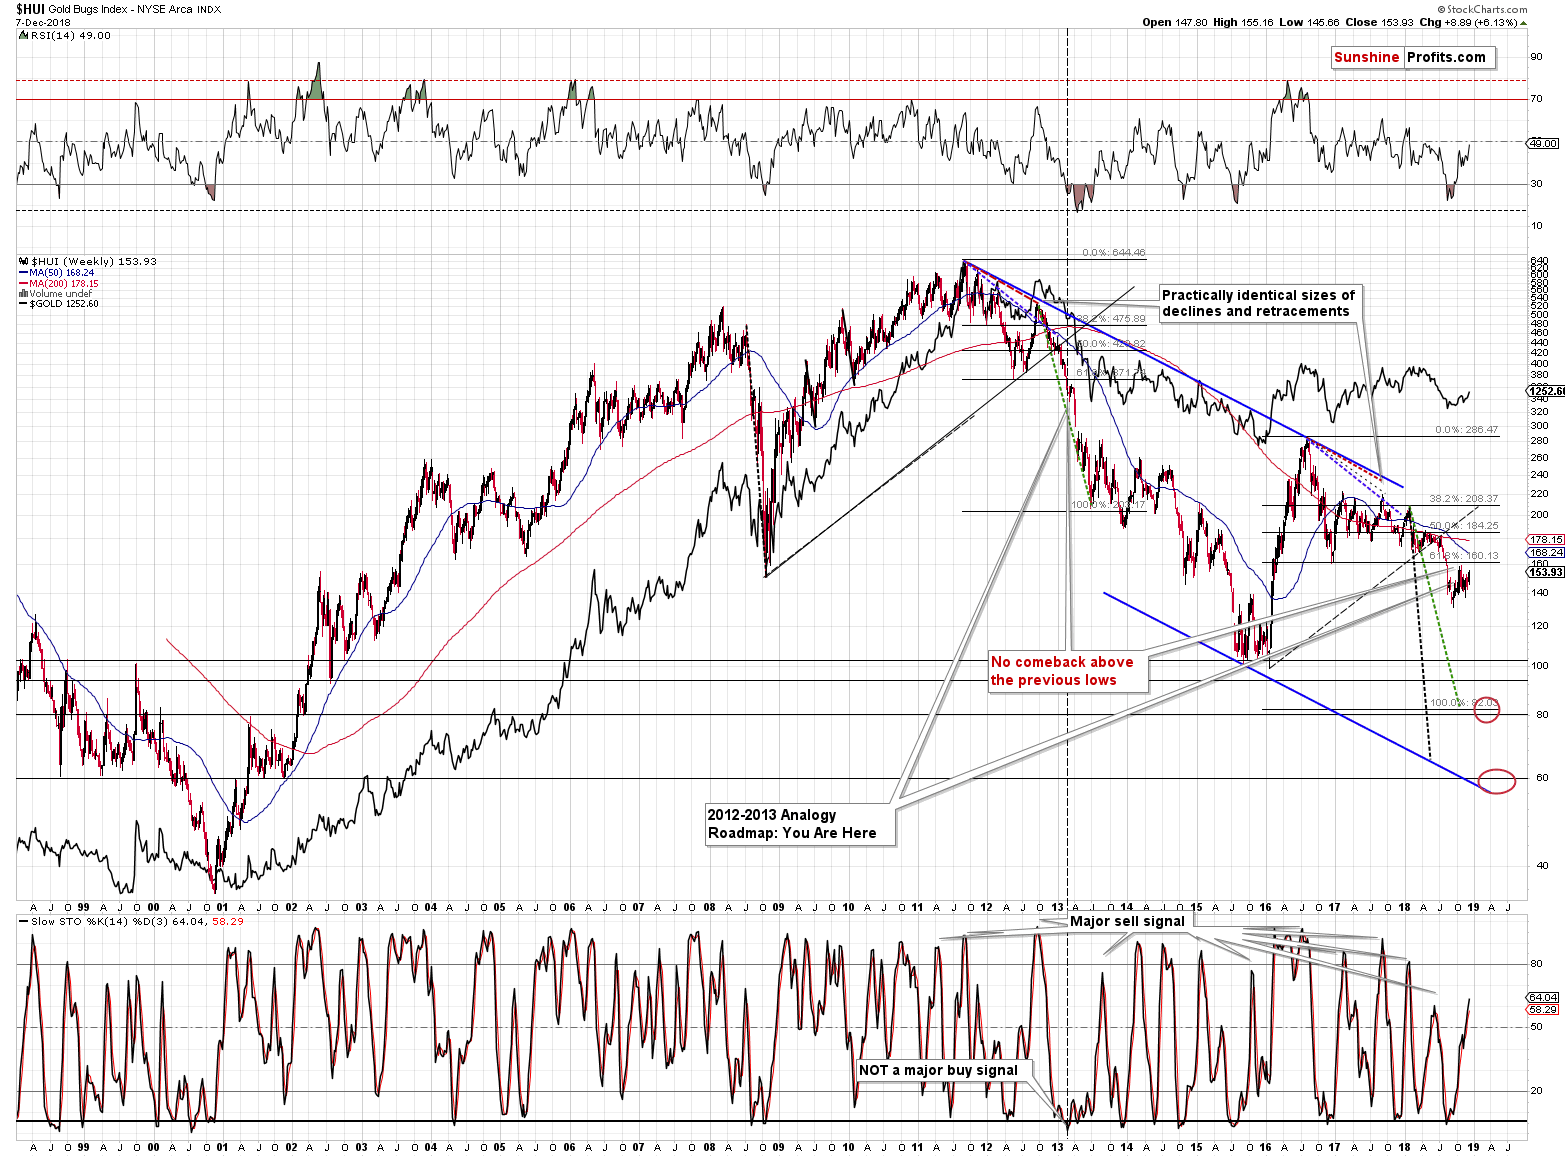
Definitely not from the long-term point of view. The mining stocks moved below their late-2016 bottom and they are now consolidating after this breakdown. In a way, the long-term situation in the gold stocks is similar to the one in silver. We saw a major long-term technical development and now we are in the consolidation phase of the move. The implications are simply bearish, and they will remain bearish unless the breakdown is invalidated. And – as it is the case with silver – miners are far from invalidating their breakdown.
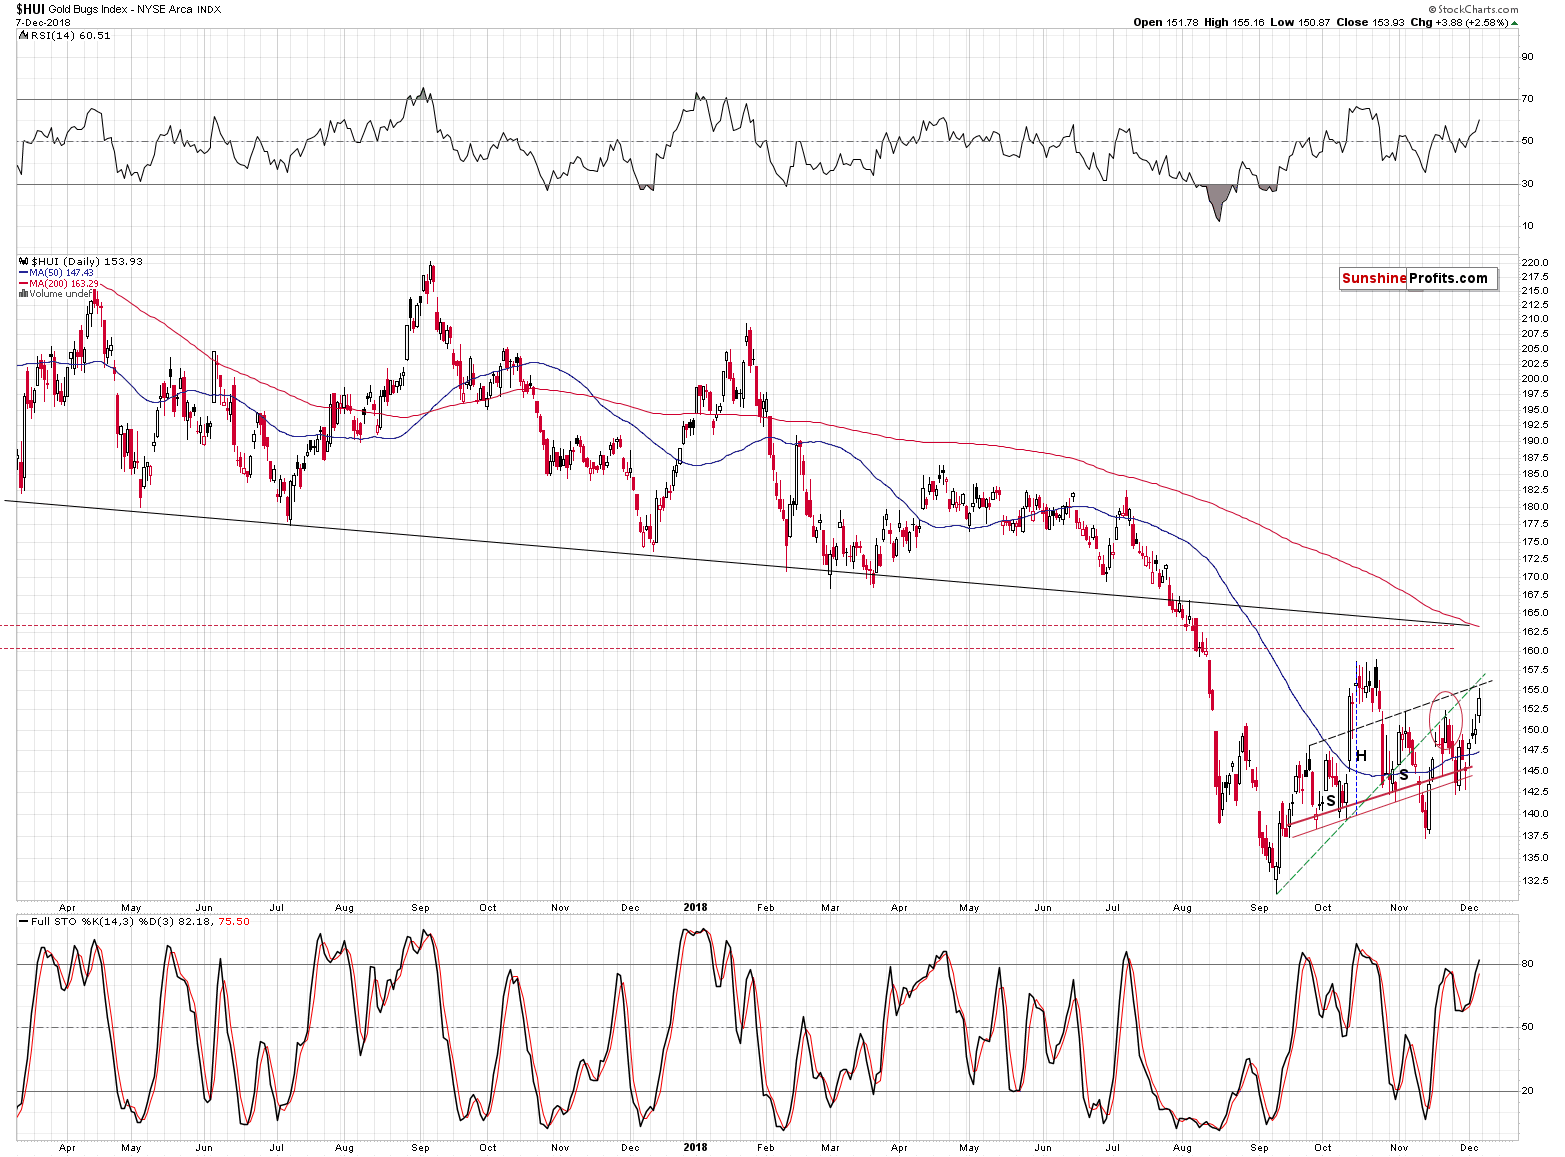
On a short-term basis we see that on the intraday basis, the HUI Index moved to two resistance lines (one based on the previous highs and one based on the previous lows) without breaking above them. Gold stocks are still below their October highs even though gold is well above its October high – the former still underperform despite the daily price increase.
What does it mean? The resistance lines that were reached mean that the rally could be over or very close to being over, and the general underperformance of the miners relative to gold suggests that the next sizable move in the PM sector will be to the downside.
Having discussed the price changes for gold stocks, it’s time for the first-time-in-years shocker that we just saw on Friday. It was in silver stocks.
Silver Miners’ Extreme Volume
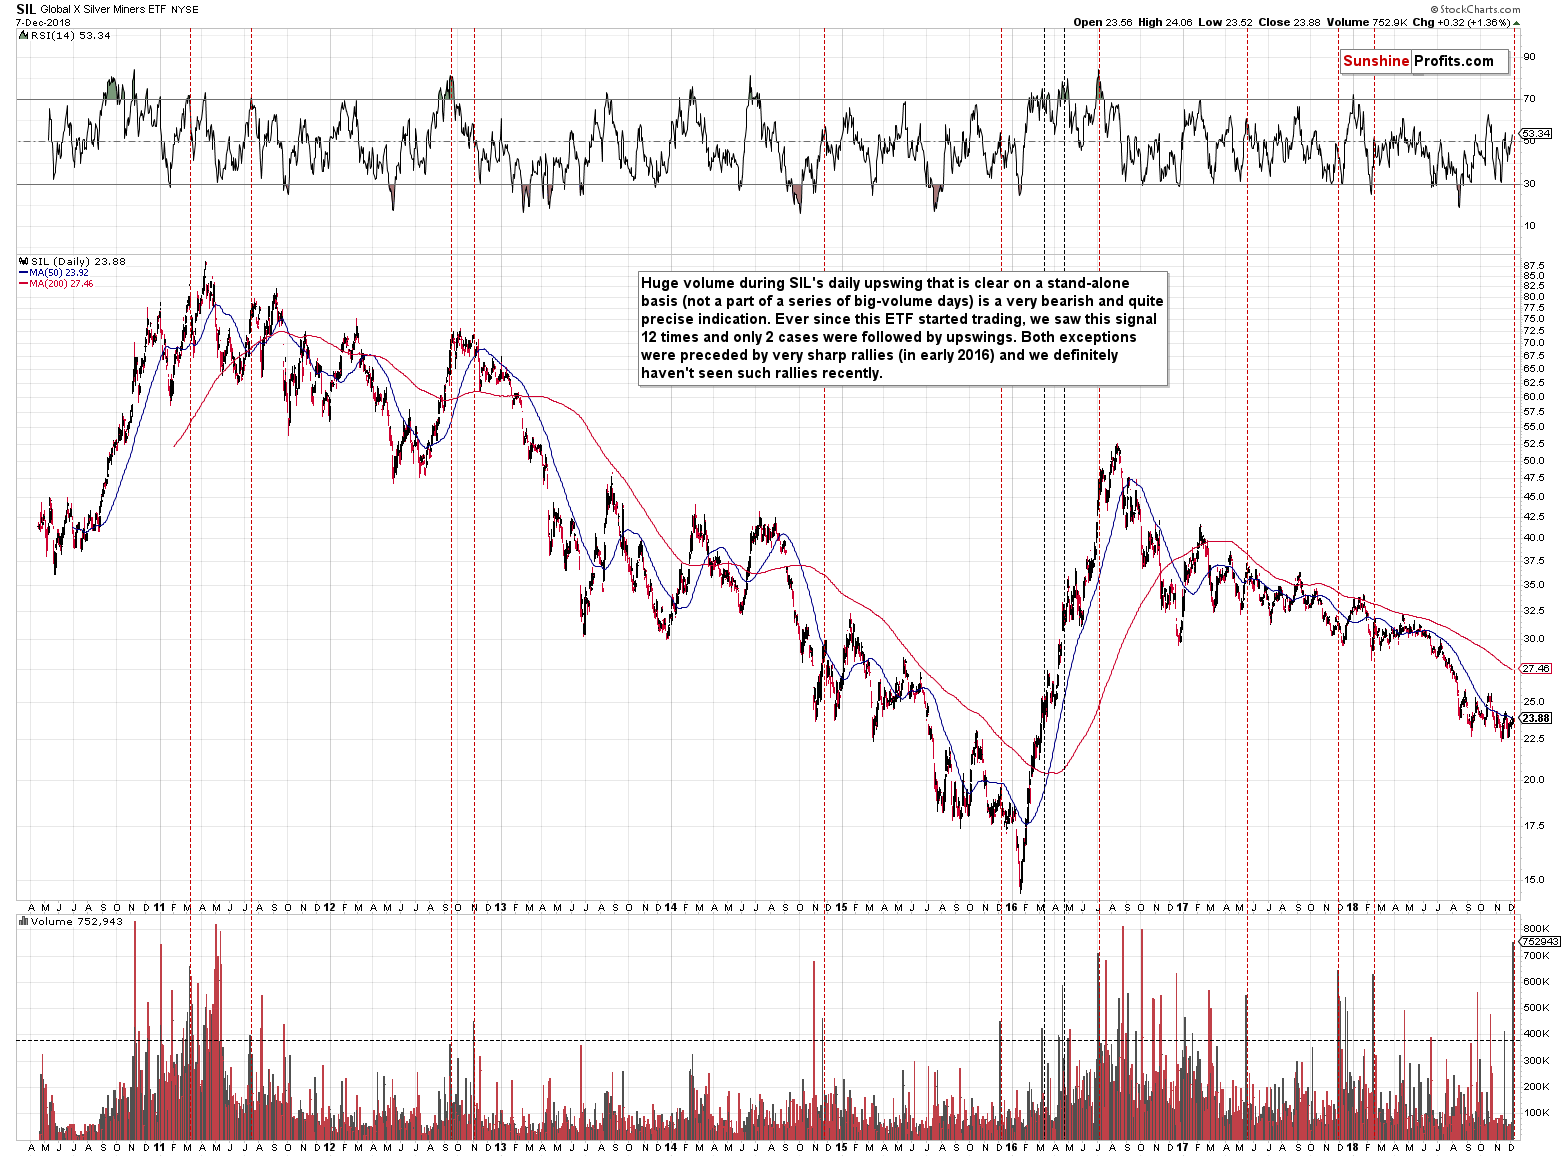
It was the volume on which silver stocks (the SIL ETF) rallied that was so extreme. It was the highest – ever – volume on which it moved higher during the day. There were higher volume readings during the declines, but never during the upswings. However, it is not that important that it was the record. It’s the fact that the volume was extremely high that makes it an extremely important signal.
The importance comes from the efficiency with which it signaled the same outcome, from the frequency, and from the fact that these signals were not all concentrated in the same period, but that they were spread over the course of the past years.
In 10 out of 12 previous cases when we saw extremely high volume during daily upswings, it was the end of a rally or very close to its end and in all these 10 cases it was a great shorting opportunity. Out of these 10 cases, the one that was followed by the biggest declines in the following months, was the one in late 2012. It was also the only case when we saw this signal after a consolidation. The only other time when we saw the spike in the daily volume during an upswing after a consolidation was… On Friday. The implications are very bearish.
The important analytical detail here is that we are considering the huge-volume sessions that were not preceded by volume that was similarly big. The reason is that if the volume is high in general, a single day’s high value is not as meaningful as if it’s a single huge-volume session among the low-volume days. In case of the former, the high volume is close to normal, while in case of the latter, it’s extreme. If you’re going 50 miles per hour and accelerate in 4 seconds to 60 miles per hour it’s nowhere close to being as extreme as if you increase to 60 miles per hour in 4 seconds starting from 0.
What about the USD Index? Did its outlook became bearish?
Outlook for the USD Index
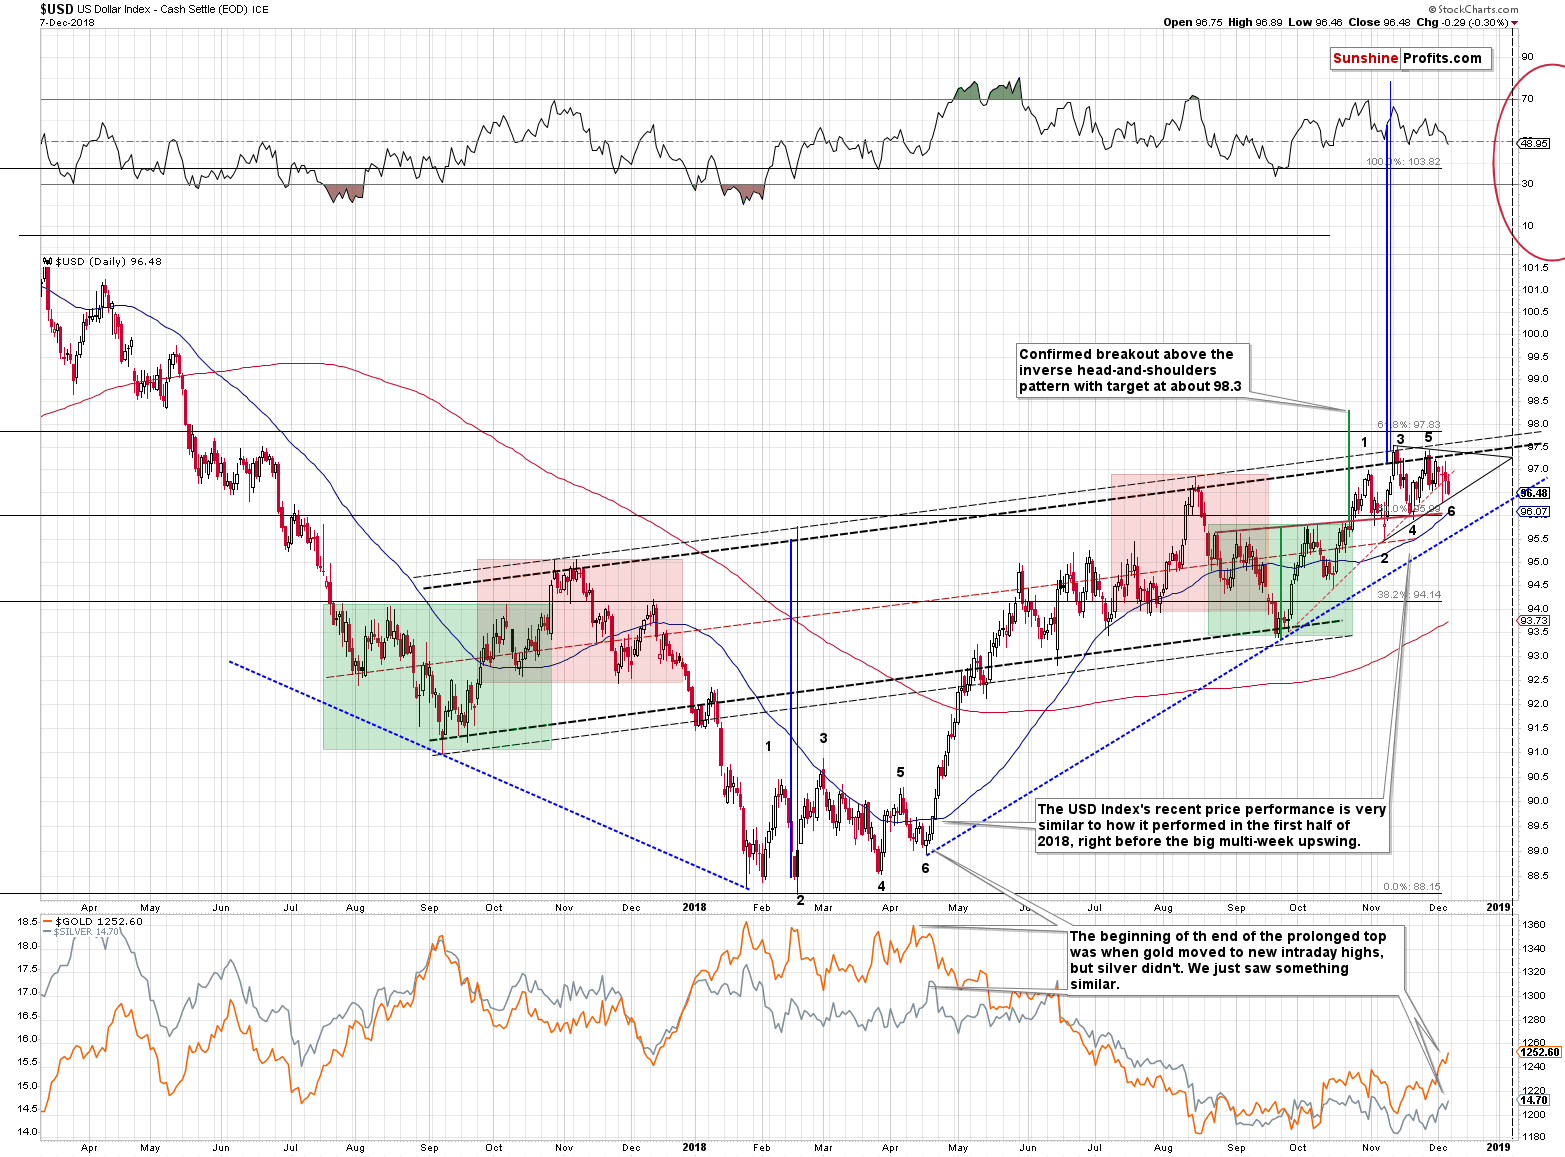
The outlook for the USD Index did not change based on Friday’s relatively small decline. Yes, that was the lowest daily close in 2 weeks, but the thing that matters is that we saw a breakdown below only one support line and it was just one daily close below it. This means that it’s not confirmed and thus not particularly meaningful at this time. The breakdown was below the rising red dashed line. The more short-term, solid, black line and the more long-term, dashed, blue line were not touched, let alone broken.
This means that outlook for the USD Index remains bullish and that our Friday’s comments on the USDX chart remain up-to-date:
The situation in the USD Index has been developing in a very interesting manner recently. The USD Index has been following reflective pattern, where the 2017-2018 decline was reflected in the shape of the 2018 rally. The areas marked with red and green show similar patterns (head-and-shoulders and inverse head-and-shoulders patterns).
However, in the last few weeks, the pattern is somewhat unclear. While the move preceding the entire pattern (the decline up to July 2017) was an almost a straight line lower, the current price moves take form of a consolidation. The start of the pattern was quick, but the end of the pattern is prolonged. Why would that be?
It looks like if someone (or several investors / institutions / central banks) really doesn’t want to let the USDX to break above the neck level of the inverse head-and-shoulders pattern. The pattern is big and clear, and it’s quite obvious that breaking above the neck level thereof would very likely result in much higher USDX values. We have no proof that this is indeed the case, but it certainly looks that way – whenever the price moves close to the neckline, the USD gets pushed lower. It rallies again, and it gets hammered again. And again. The situation becomes very tense, like a coiled spring, and once the USDX finally breaks out, it’s likely to rally fast. After all, the market forces always prevail in the end.
Putting the “why” behind the price moves aside, let’s take a look at something that would be important even if the “why” behind the recent back-and-forth trading was entirely different.
The shape of the recent sideways trading is very similar to what we saw in the first half of the year, when the USD Index was bottoming. We marked the subsequent tops and bottoms with numbers from 1 to 6. The top number 3 was the highest one in both cases and all lows were higher than the previous ones.
The most interesting thing is that the similarity doesn’t end with the USD Index. It was the time when gold moved a bit above its previous high in intraday terms, while silver didn’t. It was also the time when the mining stocks underperformed gold in a visible way. We have exactly the same thing right now. The implications are bullish for the USD Index, and they are even more bearish for the PMs than they are bullish for the USDX.
There are two things that we would like to add today. The first thing is that the highs #3 and #5 along with lows #2 and #6 form a triangle that has vertex in the first half of January, 2019. Consequently, we’re quite likely to see some kind of reversal close to January 7th, 2019.
The second thing is that we should consider how gold is performing relative to the movement in the USDX. And we are seeing a very clear signal in today’s pre-market trading. Namely, the USD Index is down to 96.50 (a decline of 0.30) and at the same time gold is down by $0.50. Silver is down by $0.04. It’s not the size of the declines that matters, but the absence of rallies. PMs are not reacting to USD’s decline as they should, which is a strong bearish factor for the short term. This is what a confirmation of a reversal looks like.
Speaking of reversals, the reversals that are based on long-term triangles for gold and silver suggest that the price should reverse right now or shortly.
The Upcoming Reversals
The triangle-based reversals are a technique that’s been very effective for the precious metals market in the previous months, so it shouldn’t be ignored. As weird and ridiculous as it may sound, the proximity of the reversals is something that makes the recent rallies bearish developments. Without them, the reversals would now have unclear or even bullish implications. Since rallies preceded them, the implications are clearly bearish.
Using Reversals – Dangerous Overinterpretations
Does the above mean that one should use all their capital and buy some more to buy short-term put options (or similarly risky instruments) and speculate on the immediate decline? Of course not. Just because a given move is likely or even very likely and it’s likely to take place shortly is absolutely no reason to abuse the money management rules. They are the #1 reason (we don’t have hard data for this, but many sources point to it) due to which individual investors (mostly beginning investors) lose money on trading. They put too much on a given trade. The current situation seems to provide an epic trading opportunity and, in our view, there is a good reason (in fact, there are many reasons) to think that using more capital than usually makes sense in case of this particular trade.
However, there is a huge difference between using more and using everything or almost everything. There will be also other great opportunities in the future and if anything goes wrong (and from time to time it HAS TO go wrong, and / or something HAS TO be delayed, that’s how trading “works”) one needs to have enough capital to participate in these opportunities. What if this trade goes wrong? What if the next one goes wrong too? And then the third one? And perhaps fourth? This is not likely. In fact, it’s very unlikely in our opinion, but it’s certainly possible, and it is critical to have an investment / trading plan that takes the above into account and that makes sure that you can sleep well even after several bad trades in a row. Naturally, one could also have a trusted professional do that for them, but that is a different matter. If you haven’t done so already, please review the simulation of the returns on trades in our Beginner’s Guide. If you’re an advanced trader, but you didn’t read it, we invite you to take a look nonetheless, perhaps something will add value to what you already know. The section that is most important with regard to the above is entitled The KEY Issue – Position Sizes.
We’re doing as much as we can to provide you with detailed and objective analysis in order to help you grow your portfolio so that you can keep or gain financial safety and finance your and your loved ones’ dreams. But we can’t do everything for you through this newsletter arrangement. We can only provide the analysis and some general ideas regarding trades (they are the same for all subscribers – they are not taking anyone’s individual circumstances into consideration). In the newsletter, we don’t have to possibility to choose and apply the position sizes for you and we can’t select individual instruments for the trade either. We’re providing the target prices and stop-loss details for the most popular (and requested) instruments, but it doesn’t mean that they are perfect for you. Only you know your financial situation – we don’t, and even if we did, we wouldn’t be able to do anything with this knowledge as we cannot provide investment advice here. We’re determined to provide as much as we can, but a newsletter simply has its limits. While we’re discussing what we can do and what we can’t do – if you subscribed recently, or you didn’t have the opportunity to read the list of factors that determine the success of a given trade we strongly encourage you to do so today. You will find the Research, Investment, and Returns section in the final part of the September 24, 2018 Gold & Silver Trading Alert.
Summary
Summing up, the outlook for the precious metals market remains very bearish for the following weeks and months and short position remains justified from the risk to reward point of view, even if we see a few extra days of back and forth trading or even a small brief upswing. There is a very high probability of a huge downswing that makes the short position justified, not the outlook for the next few days. The strongly bearish analogies to 2013 and 1999, miners’ underperformance, the number of intraday reversals in the GLD ETF, the triangle-based reversals in gold and silver, the outlook for the USD Index as well as the situation in the gold to palladium ratio are only several of multiple reasons suggesting that its 2013 and 2008 type of action that is being repeated, not the 2016 one.
As always, we’ll keep you – our subscribers – informed.
To summarize:
Trading capital (supplementary part of the portfolio; our opinion): Full short positions (250% of the full position) in gold, silver and mining stocks are justified from the risk/reward perspective with the following stop-loss orders and exit profit-take price levels:
- Gold: profit-take exit price: $1,062; stop-loss: $1,272; initial target price for the DGLD ETN: $82.96; stop-loss for the DGLD ETN $47.17
- Silver: profit-take exit price: $12.32; stop-loss: $15.11; initial target price for the DSLV ETN: $47.67; stop-loss for the DSLV ETN $28.37
- Mining stocks (price levels for the GDX ETF): profit-take exit price: $13.12; stop-loss: $20.83; initial target price for the DUST ETF: $80.97; stop-loss for the DUST ETF $24.87
Note: the above is a specific preparation for a possible sudden price drop, it does not reflect the most likely outcome. You will find a more detailed explanation in our August 1 Alert. In case one wants to bet on junior mining stocks’ prices (we do not suggest doing so – we think senior mining stocks are more predictable in the case of short-term trades – if one wants to do it anyway, we provide the details), here are the stop-loss details and target prices:
- GDXJ ETF: profit-take exit price: $17.52; stop-loss: $31.23
- JDST ETF: initial target price: $154.97 stop-loss: $51.78
Long-term capital (core part of the portfolio; our opinion): No positions (in other words: cash)
Insurance capital (core part of the portfolio; our opinion): Full position
Important Details for New Subscribers
Whether you already subscribed or not, we encourage you to find out how to make the most of our alerts and read our replies to the most common alert-and-gold-trading-related-questions.
Please note that the in the trading section we describe the situation for the day that the alert is posted. In other words, it we are writing about a speculative position, it means that it is up-to-date on the day it was posted. We are also featuring the initial target prices, so that you can decide whether keeping a position on a given day is something that is in tune with your approach (some moves are too small for medium-term traders and some might appear too big for day-traders).
Plus, you might want to read why our stop-loss orders are usually relatively far from the current price.
Please note that a full position doesn’t mean using all of the capital for a given trade. You will find details on our thoughts on gold portfolio structuring in the Key Insights section on our website.
As a reminder – “initial target price” means exactly that – an “initial” one, it’s not a price level at which we suggest closing positions. If this becomes the case (like it did in the previous trade) we will refer to these levels as levels of exit orders (exactly as we’ve done previously). Stop-loss levels, however, are naturally not “initial”, but something that, in our opinion, might be entered as an order.
Since it is impossible to synchronize target prices and stop-loss levels for all the ETFs and ETNs with the main markets that we provide these levels for (gold, silver and mining stocks – the GDX ETF), the stop-loss levels and target prices for other ETNs and ETF (among other: UGLD, DGLD, USLV, DSLV, NUGT, DUST, JNUG, JDST) are provided as supplementary, and not as “final”. This means that if a stop-loss or a target level is reached for any of the “additional instruments” (DGLD for instance), but not for the “main instrument” (gold in this case), we will view positions in both gold and DGLD as still open and the stop-loss for DGLD would have to be moved lower. On the other hand, if gold moves to a stop-loss level but DGLD doesn’t, then we will view both positions (in gold and DGLD) as closed. In other words, since it’s not possible to be 100% certain that each related instrument moves to a given level when the underlying instrument does, we can’t provide levels that would be binding. The levels that we do provide are our best estimate of the levels that will correspond to the levels in the underlying assets, but it will be the underlying assets that one will need to focus on regarding the signs pointing to closing a given position or keeping it open. We might adjust the levels in the “additional instruments” without adjusting the levels in the “main instruments”, which will simply mean that we have improved our estimation of these levels, not that we changed our outlook on the markets. We are already working on a tool that would update these levels on a daily basis for the most popular ETFs, ETNs and individual mining stocks.
Our preferred ways to invest in and to trade gold along with the reasoning can be found in the how to buy gold section. Additionally, our preferred ETFs and ETNs can be found in our Gold & Silver ETF Ranking.
As a reminder, Gold & Silver Trading Alerts are posted before or on each trading day (we usually post them before the opening bell, but we don't promise doing that each day). If there's anything urgent, we will send you an additional small alert before posting the main one.
=====
Thank you.
Sincerely,
Przemyslaw Radomski, CFA
Editor-in-chief, Gold & Silver Fund Manager
Gold & Silver Trading Alerts
Forex Trading Alerts
Oil Investment Updates
Oil Trading Alerts

