

Briefly: in our opinion, full (300% of the regular position size) speculative short positions in junior mining stocks are justified from the risk/reward point of view at the moment of publishing this Alert.
The tensions around Ukraine remain high, and the situation on the precious metals market develops in tune with what happened in 2014 during the Crimea crisis, with the previous technical indications, and with what I wrote recently.
Consequently, I’ll start today’s analysis, with a quote from yesterday’s Alert, as it remains up-to-date:
Well, it looks pretty much like what we saw at the beginning of the invasion of Crimea and then its annexation. From Russia’s point of view – if it worked once, why shouldn’t it work again?
A full-blown invasion was unlikely, but unfortunately, it seems like there might be some kind of military conflict after all.
What’s going to happen next is anyone’s guess, but it doesn’t look very encouraging at this point.
What does it change in the case of our short positions in junior mining stocks?
Absolutely nothing.
I already wrote the “why” behind the above in one of my recent replies to the question that I had received about the what-if-there-is-an-invasion scenario:
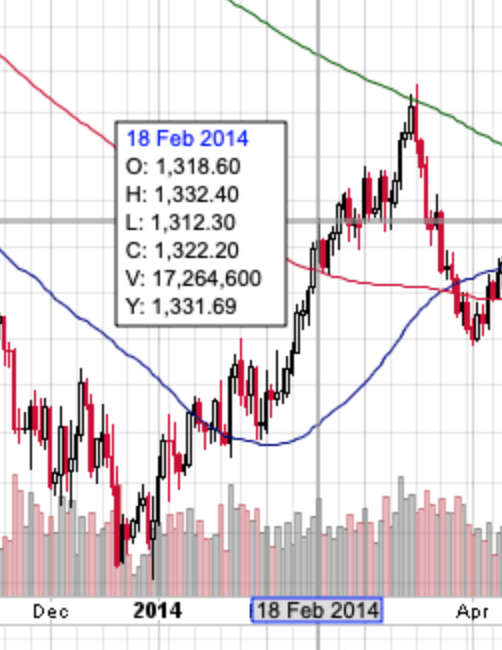
What would happen then is that PMs would be likely to rally until the conflict actually starts, then a bit more, and then they would likely continue their medium-term decline. It already happened in 2014, when Russia took over Crimea. Interestingly, it was more or less at the same time of year. By mid-Feb, the majority of the rally was over. The entire rally in gold was about $200, and the part that continued after mid-Feb. was about $50.
Thus, considering December 2021 as the starting point of this rally, gold is up by about $150 now – so the history rhymes here.
Consequently, IF (and that’s a big if) the tensions escalate and Russia takes over a part of Ukraine once again, we might be looking at “only” an extra $50 rally in gold or so and a top in mid-March – and then the medium-term slide would be likely to continue.
Since it’s much more likely to me that there will be no invasion / annexation / etc. this time, it seems that the upside is much more limited, if it exists at all. [EDIT: Now, annexation of additional regions seems much more probable, but a full-blown war still seems unlikely.] Perhaps gold simply moves back up to its 2021 high (so another $20 higher or so) and then collapses, or it might decline right away (today’s pre-market decline might be indicating that, especially in light of the triangle-vertex-based reversals).
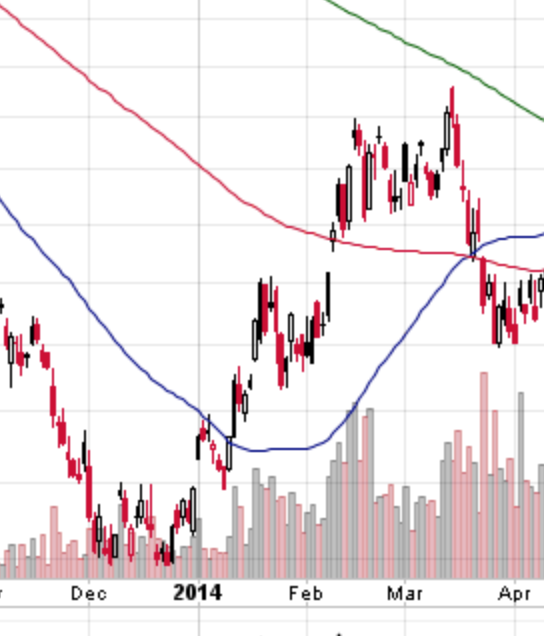
Oh, and by the way, GDXJ actually topped in mid-Feb 2014, and then it just moved back and forth until gold topped in mid-March 2014. OK, to be precise, the GDXJ’s intraday high in March was about 3% above its mid-Feb high, and it was then followed by an immediate decline.
It seems like the worst time to be exiting short positions in junior mining stocks. Instead, it might be a perfect time to be entering or adding to them (if one doesn’t have the desired exposure yet).
The above analogy is even more important now, given the recent escalation.
Let’s see how gold futures have reacted so far this week:
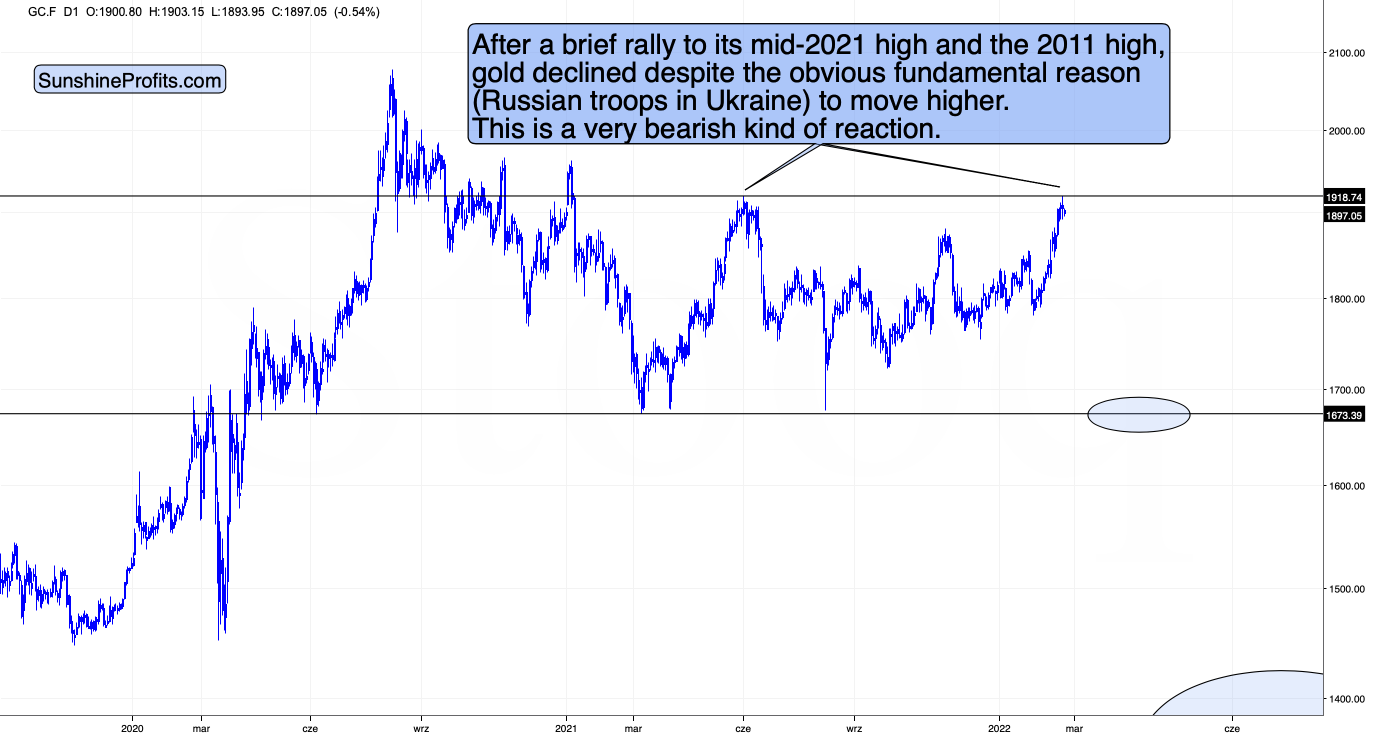
Gold futures are currently trading at practically the same price level as they were trading 24 hours ago, so what I wrote yesterday, remains perfectly up-to-date. Namely, gold didn’t rally this week, and in fact, it declined despite the obvious fundamental reason (Russian troops in Ukraine) for moving higher.
This is a very bearish kind of reaction.
Silver is slightly higher than it was trading 24 hours ago, but the important thing is that overall it’s still higher this week, while gold is lower.
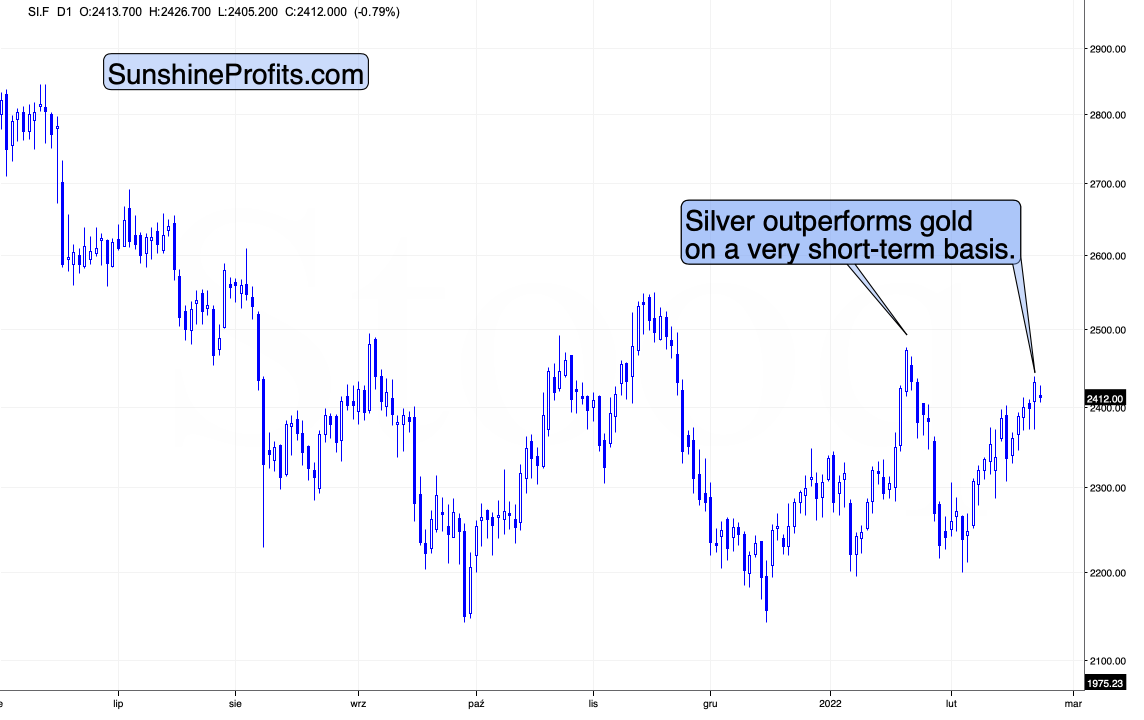
Consequently, we just saw the signal that often marks the final moments of a given short-term upswing – silver’s short-term outperformance.
In this week’s trading (including today’s London trading), junior miners GDXJ ETF (which is also trading on the London Stock Exchange) is down, as well as GDXJ (-0.92%), much more than gold (-0.18%).
Silver is outperforming gold and mining stocks are underperforming it – that’s typical for a market top.
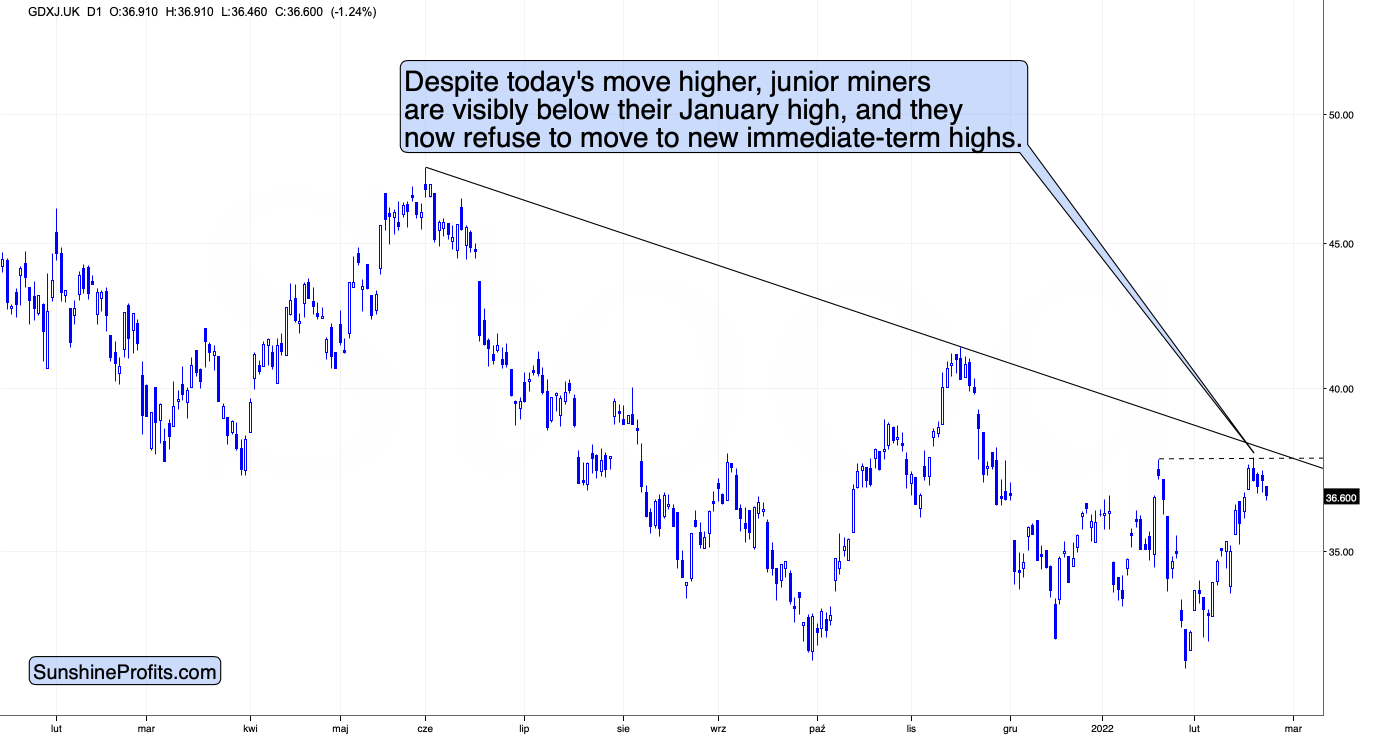
From the broader point of view, this means that they precious metals sector is performing just like in 2014.
The tensions and uncertainties regarding Ukraine seem to have peaked or are very close to their peak (at least among gold junior mining stock investors), and the rally that was to take place based on them, is likely already behind us.
What’s next? As long as the geopolitical situation remains unclear and gold’s reaction might be to rally (analogy to 2014), decline (technical situation) or trade sideways (taking both into account), it seems that junior mining stocks’ rally is over or very close to being over.
Consequently, it seems like a great moment to be entering short positions in junior gold miners, not exiting them. It’s obvious, but still, let me say it: tops are formed when everyone wants to buy and everything favorable has already happened for a given market (and it no longer responds to it as everyone who wanted to buy is already in the market). The opposite happens in the case of bottoms. To maximize profits, one wants to exit long positions and perhaps enter short positions close to the tops – and it seems that we are at one or very close to one in the case of junior gold miners.
Having said that, let’s take a look at the markets from a more fundamental point of view.
A Tired Rally
While gold remains uplifted due to the Russia-Ukraine drama, the GDXJ ETF declined for the second-straight day on Feb. 22. Moreover, I warned on numerous occasions that the junior miners are more correlated with the general stock market than their precious metals peers. As a result, when the S&P 500 slides, the GDXJ ETF often follows suit.
To that point, with shades of 2018 unfolding beneath the surface, the Russia-Ukraine headlines have covered up the implications of the current correction. However, the similarities should gain more traction in the coming weeks. For context, I wrote on Feb. 22:
When the Fed’s rate hike cycle roiled the NASDAQ 100 in 2017-2018, the GDXJ ETF suffered too. Thus, while the Russia-Ukraine drama has provided a distraction, the fundamentals that impacted both asset classes back then are present now.
Please see below:
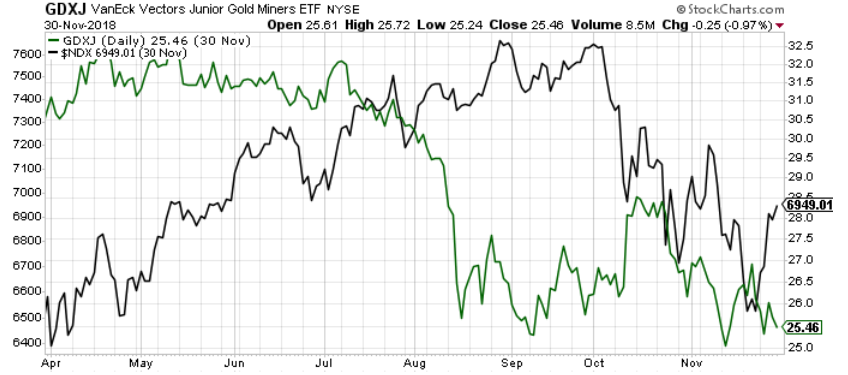
To explain, the green line above tracks the GDXJ ETF in 2018, while the black line above tracks the NASDAQ 100. If you analyze the performance, you can see that the Fed’s rate hike cycle initially rattled the former and the latter rolled over soon after. However, the negativity persisted until Fed Chairman Jerome Powell performed a dovish pivot and both assets rallied. As a result, with the Fed Chair unlikely to perform a dovish pivot this time around, the junior miners have some catching up to do.
Furthermore, while the S&P 500 also reacts to the geopolitical risks, the Fed’s looming rate hike cycle is a much bigger story. With the U.S. equity benchmark also following its price path from 2018, a drawdown to new 2022 lows should help sink the GDXJ ETF.
Please see below:
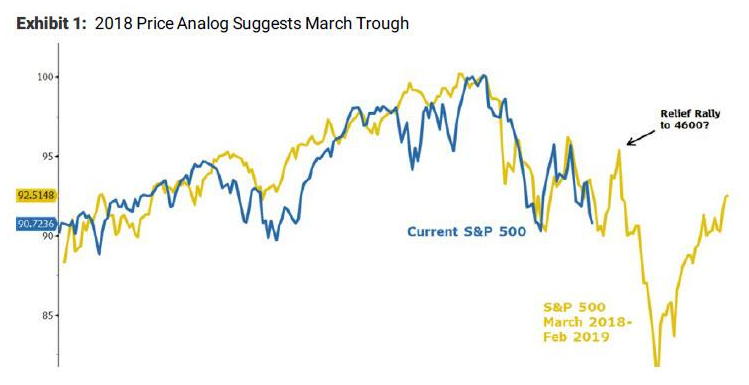 Source: Morgan Stanley
To explain, the yellow line above tracks the S&P 500 from March 2018 until February 2019, while the blue line above tracks the index's current movement. If you analyze the performance, it's a near-splitting image.
Moreover, while Morgan Stanley Chief Equity Strategist Michael Wilson thinks a relief rally to ~4,600 is plausible, he told clients that "this correction looks incomplete." "Rarely have we witnessed such weak breadth and havoc under the surface when the S&P 500 is down less than 10%. In our experience, when such a divergence like this happens, it typically ends with the primary index catching down to the average stock," he added.
As a result, while a short-term bounce off of oversold conditions may materialize, the S&P 500's downtrend should resume with accelerated fervor. In the process, the GDXJ ETF should suffer materially as the medium-term drama unfolds.
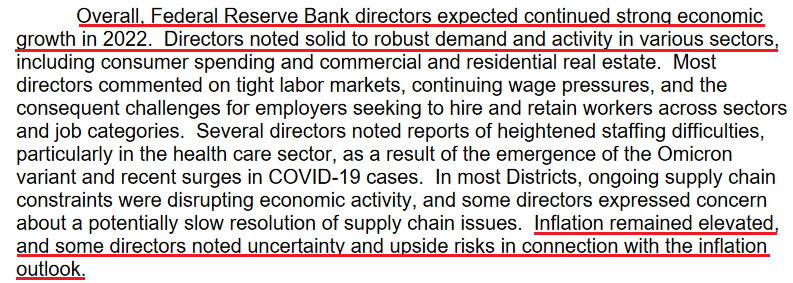
To that point, the Fed released the minutes from its discount rate meetings on Jan. 18 and Jan. 26. While the committee left interest rates unchanged, the report revealed:
“Given ongoing inflation pressures and strong labor market conditions, a number of directors noted that it might soon become appropriate to begin a process of removing policy accommodation. The directors of three Reserve Banks favored increasing the primary credit rate to 0.50 percent, in response to elevated inflation or to help manage economic and financial stability risks over the longer term.”
For context, the hawkish pleas came from the Cleveland, St. Louis, and Kansas City Feds. Moreover, the last time Fed officials couldn’t reach a unanimous decision was October 2019. As a result, the lack of agreement highlights the monetary policy uncertainty that should help upend financial assets in the coming months.
As evidence, the report also revealed:
 Source: U.S. Fed
Thus, while I’ve highlighted on numerous occasions that a bullish U.S. economy is bearish for the PMs, the Russia-Ukraine drama has been a short-term distraction. However, with Fed officials highlighting that growth and inflation meet their thresholds for tightening monetary policy, higher real interest rates and a stronger USD Index will have much more influence over the medium term.
To that point, IHS Markit released its U.S. Composite PMI on Feb. 22. With the headline index increasing from 51.1 in January to 56.0 in February, an excerpt from the report read:
“February data highlighted a sharp and accelerated increase in new business among private sector companies that was the fastest in seven months. Firms mentioned that sales were boosted by the retreat of the pandemic, improved underlying demand, expanded client bases, aggressive marketing campaigns and new partnerships. Customers reportedly made additional purchases to avoid future price hikes. Quicker increases in sales (trades) were evident among both manufacturers and service providers.”
More importantly, though:
 Source: IHS Markit
In addition, since the Fed’s dual mandate includes inflation and employment, the report revealed:
 Source: IHS Markit
Likewise, Chris Williamson, Chief Business Economist at IHS Markit, added:
“With demand rebounding and firms seeing a relatively modest impact on order books from the Omicron wave, future output expectations improved to the highest for 15 months, and jobs growth accelerated to the highest since last May, adding to the upbeat picture.”
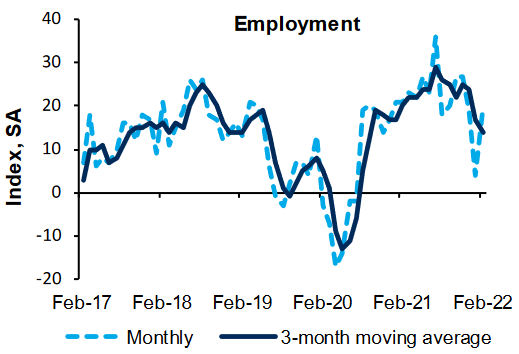
If that wasn't enough, the Richmond Fed released its Fifth District Survey of Manufacturing Activity on Feb. 22. While the headline index wasn't so optimistic, the report revealed that "the third component in the composite index, employment, increased to 20 from 4 in January" and that "firms continued to report increasing wages."
For context, the dashed light blue line below tracks the month-over-month (MoM) change, while the dark blue line below tracks the three-month moving average. If you analyze the former's material increase, it's another data point supporting the Fed's hawkish crusade.
 Source: Richmond Fed
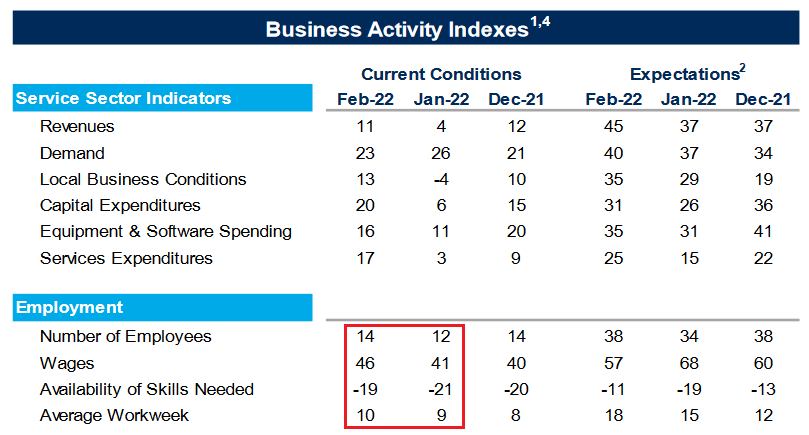
Finally, the Richmond Fed also released its Fifth District Survey of Service Sector Activity on Feb. 22. For context, the U.S. service sector suffers the brunt of COVID-19 waves. However, the recent decline in cases has increased consumers’ appetite for in-person activities. The report revealed:
“Fifth District service sector activity showed improvement in February, according to the most recent survey by the Federal Reserve Bank of Richmond. The revenues index increased from 4 in January to 11 in February. The demand index remained in expansionary territory at 23. Firms also reported increases in spending, as the index for capital expenditures, services expenditures, and equipment and software spending all increased.”
Furthermore, with the employment index increasing from 12 to 14, the wages index increasing from 41 to 46, and the average workweek index increasing from 9 to 10, the labor market strengthened in February. Likewise, the index that tracks businesses’ ability to find skilled workers increased from -21 to -19. As a result, inflation, employment and economic growth create the perfect cocktail for the Fed to materially tighten monetary policy in the coming months.
 Source: Richmond Fed
The bottom line? While the Russia-Ukraine saga may dominate the headlines for some time, the bearish fundamentals that hurt gold and silver in 2021 remain intact: the U.S. economy is on solid footing, and demand is still fueling inflation. Moreover, with information technology and communication services’ stocks – which account for roughly 39% of the S&P 500 – highly allergic to higher interest rates, the volatility should continue to weigh on the GDXJ ETF. As such, while gold may have extended its shelf life, mining stocks may not be so lucky.
In conclusion, the PMs were mixed on Feb. 22, as the news cycle continues to swing financial assets in either direction. However, while headlines may have a short-term impact, technicals and fundamentals often reign supreme over the medium term. As a result, lower lows should confront gold, silver, and mining stocks in the coming months.
Overview of the Upcoming Part of the Decline
- It seems to me that the corrective upswing is now over or very close to being over , and that gold, silver, and mining stocks are now likely to continue their medium-term decline.
- It seems that the first (bigger) stop for gold will be close to its previous 2021 lows, slightly below $1,700. Then it will likely correct a bit, but it’s unclear if I want to exit or reverse the current short position based on that – it depends on the number and the nature of the bullish indications that we get at that time.
- After the above-mentioned correction, we’re likely to see a powerful slide, perhaps close to the 2020 low ($1,450 - $1,500).
- If we see a situation where miners slide in a meaningful and volatile way while silver doesn’t (it just declines moderately), I plan to – once again – switch from short positions in miners to short positions in silver. At this time, it’s too early to say at what price levels this could take place, and if we get this kind of opportunity at all – perhaps with gold close to $1,600.
- I plan to exit all remaining short positions once gold shows substantial strength relative to the USD Index while the latter is still rallying. This may be the case with gold close to $1,350 - $1,400. I expect silver to fall the hardest in the final part of the move. This moment (when gold performs very strongly against the rallying USD and miners are strong relative to gold after its substantial decline) is likely to be the best entry point for long-term investments, in my view. This can also happen with gold close to $1,375, but at the moment it’s too early to say with certainty.
- As a confirmation for the above, I will use the (upcoming or perhaps we have already seen it?) top in the general stock market as the starting point for the three-month countdown. The reason is that after the 1929 top, gold miners declined for about three months after the general stock market started to slide. We also saw some confirmations of this theory based on the analogy to 2008. All in all, the precious metals sector is likely to bottom about three months after the general stock market tops.
- The above is based on the information available today, and it might change in the following days/weeks.
You will find my general overview of the outlook for gold on the chart below:
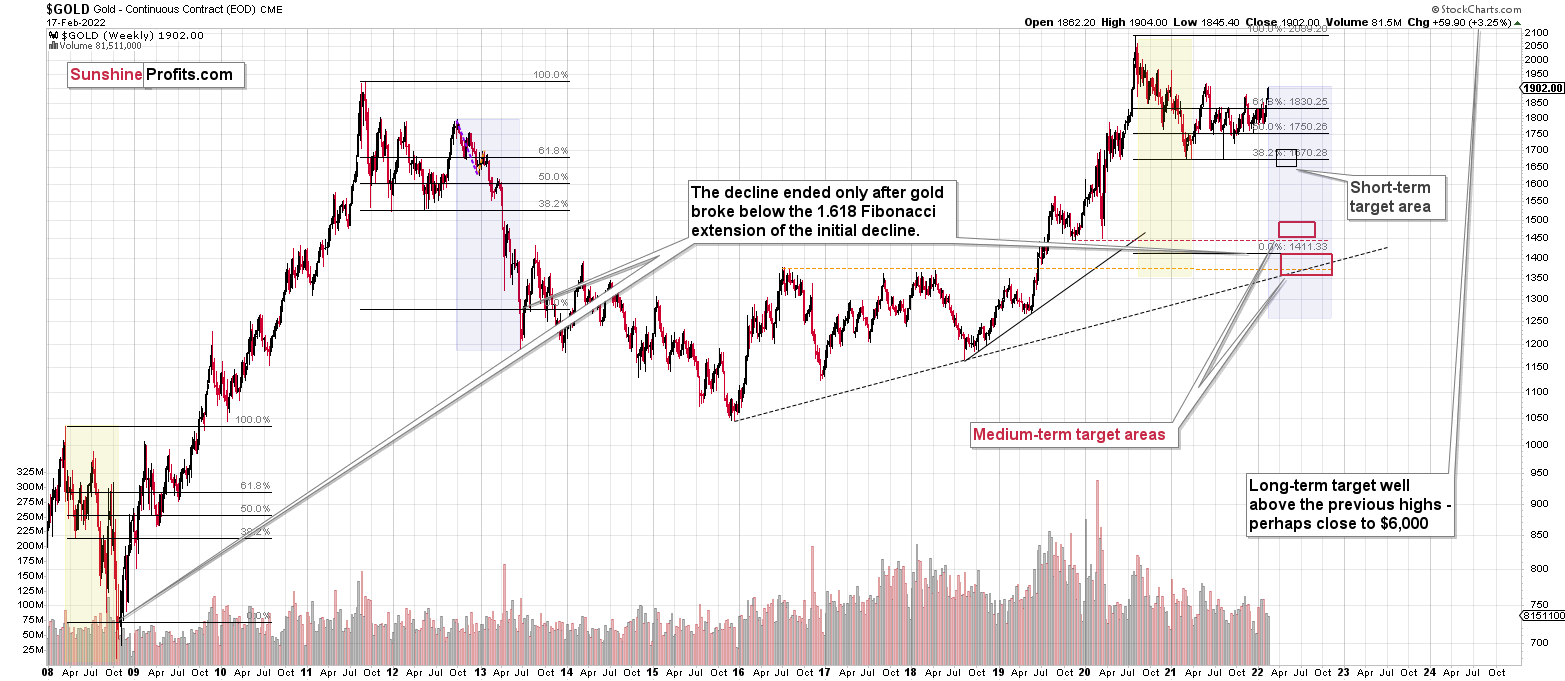
Please note that the above timing details are relatively broad and “for general overview only” – so that you know more or less what I think and how volatile I think the moves are likely to be – on an approximate basis. These time targets are not binding or clear enough for me to think that they should be used for purchasing options, warrants or similar instruments.
Summary
Summing up, it seems to me that the corrective upswing in junior mining stocks is over, or that we won’t have to wait too long for it to be over. The situation in case of gold and silver is not as clear especially due to gold’s tendency to react to geopolitical news in the very short term. Any additional rallies here are not likely to last, though.
Moreover, let’s keep in mind that there are triangle-vertex-based reversals in mid- and late-February, so even if we see more back-and-forth trading soon, it’s likely that the decline resumes later this month.
I continue to think that junior mining stocks are currently likely to decline the most out of all the parts of the precious metals sector.
From the medium-term point of view, the two key long-term factors remain the analogy to 2013 in gold and the broad head and shoulders pattern in the HUI Index. They both suggest much lower prices ahead.
It seems that our profits from the short positions are going to become truly epic in the coming months.
After the sell-off (that takes gold to about $1,350 - $1,500), I expect the precious metals to rally significantly. The final part of the decline might take as little as 1-5 weeks, so it's important to stay alert to any changes.
Most importantly, please stay healthy and safe. We made a lot of money last March and this March, and it seems that we’re about to make much more on the upcoming decline, but you have to be healthy to enjoy the results.
As always, we'll keep you - our subscribers - informed.
To summarize:
Trading capital (supplementary part of the portfolio; our opinion): Full speculative short positions (300% of the full position) in junior mining stocks are justified from the risk to reward point of view with the following binding exit profit-take price levels:
Mining stocks (price levels for the GDXJ ETF): binding profit-take exit price: $34.63; stop-loss: none (the volatility is too big to justify a stop-loss order in case of this particular trade)
Alternatively, if one seeks leverage, we’re providing the binding profit-take levels for the JDST (2x leveraged) and GDXD (3x leveraged – which is not suggested for most traders/investors due to the significant leverage). The binding profit-take level for the JDST: $14.98; stop-loss for the JDST: none (the volatility is too big to justify a SL order in case of this particular trade); binding profit-take level for the GDXD: $25.48; stop-loss for the GDXD: none (the volatility is too big to justify a SL order in case of this particular trade).
For-your-information targets (our opinion; we continue to think that mining stocks are the preferred way of taking advantage of the upcoming price move, but if for whatever reason one wants / has to use silver or gold for this trade, we are providing the details anyway.):
Silver futures downside profit-take exit price: $19.12
SLV profit-take exit price: $17.72
ZSL profit-take exit price: $38.28
Gold futures downside profit-take exit price: $1,683
HGD.TO – alternative (Canadian) inverse 2x leveraged gold stocks ETF – the upside profit-take exit price: $11.79
HZD.TO – alternative (Canadian) inverse 2x leveraged silver ETF – the upside profit-take exit price: $29.48
Long-term capital (core part of the portfolio; our opinion): No positions (in other words: cash
Insurance capital (core part of the portfolio; our opinion): Full position
Whether you already subscribed or not, we encourage you to find out how to make the most of our alerts and read our replies to the most common alert-and-gold-trading-related-questions.
Please note that we describe the situation for the day that the alert is posted in the trading section. In other words, if we are writing about a speculative position, it means that it is up-to-date on the day it was posted. We are also featuring the initial target prices to decide whether keeping a position on a given day is in tune with your approach (some moves are too small for medium-term traders, and some might appear too big for day-traders).
Additionally, you might want to read why our stop-loss orders are usually relatively far from the current price.
Please note that a full position doesn't mean using all of the capital for a given trade. You will find details on our thoughts on gold portfolio structuring in the Key Insights section on our website.
As a reminder - "initial target price" means exactly that - an "initial" one. It's not a price level at which we suggest closing positions. If this becomes the case (like it did in the previous trade), we will refer to these levels as levels of exit orders (exactly as we've done previously). Stop-loss levels, however, are naturally not "initial", but something that, in our opinion, might be entered as an order.
Since it is impossible to synchronize target prices and stop-loss levels for all the ETFs and ETNs with the main markets that we provide these levels for (gold, silver and mining stocks - the GDX ETF), the stop-loss levels and target prices for other ETNs and ETF (among other: UGL, GLL, AGQ, ZSL, NUGT, DUST, JNUG, JDST) are provided as supplementary, and not as "final". This means that if a stop-loss or a target level is reached for any of the "additional instruments" (GLL for instance), but not for the "main instrument" (gold in this case), we will view positions in both gold and GLL as still open and the stop-loss for GLL would have to be moved lower. On the other hand, if gold moves to a stop-loss level but GLL doesn't, then we will view both positions (in gold and GLL) as closed. In other words, since it's not possible to be 100% certain that each related instrument moves to a given level when the underlying instrument does, we can't provide levels that would be binding. The levels that we do provide are our best estimate of the levels that will correspond to the levels in the underlying assets, but it will be the underlying assets that one will need to focus on regarding the signs pointing to closing a given position or keeping it open. We might adjust the levels in the "additional instruments" without adjusting the levels in the "main instruments", which will simply mean that we have improved our estimation of these levels, not that we changed our outlook on the markets. We are already working on a tool that would update these levels daily for the most popular ETFs, ETNs and individual mining stocks.
Our preferred ways to invest in and to trade gold along with the reasoning can be found in the how to buy gold section. Furthermore, our preferred ETFs and ETNs can be found in our Gold & Silver ETF Ranking.
As a reminder, Gold & Silver Trading Alerts are posted before or on each trading day (we usually post them before the opening bell, but we don't promise doing that each day). If there's anything urgent, we will send you an additional small alert before posting the main one.
Thank you.
Przemyslaw Radomski, CFA
Founder, Editor-in-chief

