

Briefly: in our opinion, full (300% of the regular position size) speculative short positions in mining stocks are justified from the risk/reward point of view at the moment of publishing this Alert.
In yesterday’s flagship Gold & Silver Trading Alert, I emphasized that the next short-term top had most likely already formed last Thursday (Apr. 8). The basis for this was the triangle-vertex-based reversal in gold as well as the USD’s correction that appears to be analogous to its 2018 correction that was followed by another powerful rally.
In short, the above expectation (and reasoning behind it) remains up-to-date. Let’s start today’s discussion with a look at the USD Index.
The USD Index
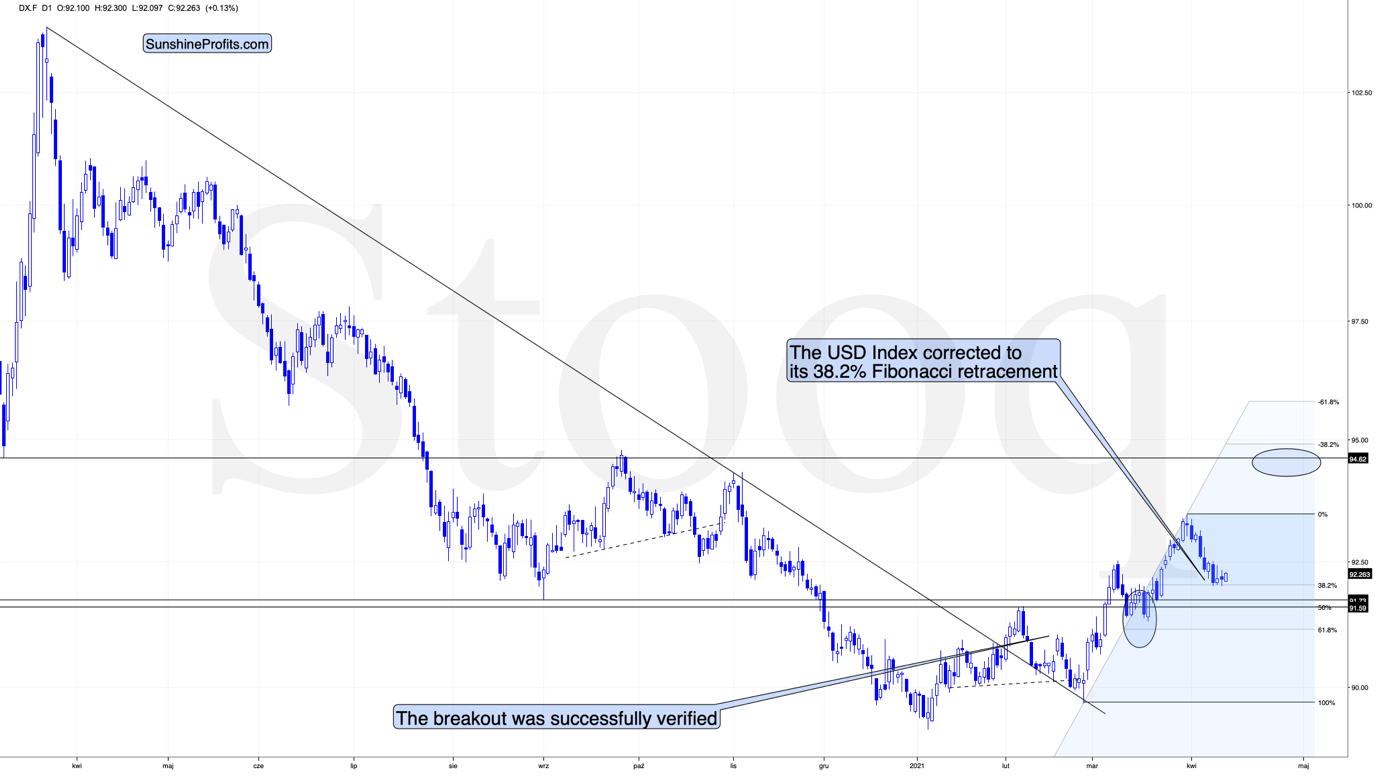
In short, the USD Index is trading sideways after moving to its mid-2020 lows and to its 38.2% Fibonacci retracement level. This combination of support levels has likely created a bottom in the USD Index, but that’s not the only factor that needs to be considered. The other – very important factor – is the continuous similarity in the USDX to how it rallied in 2018 after a very similar yearly decline. I wrote about it previously, and these comments remain up-to-date.
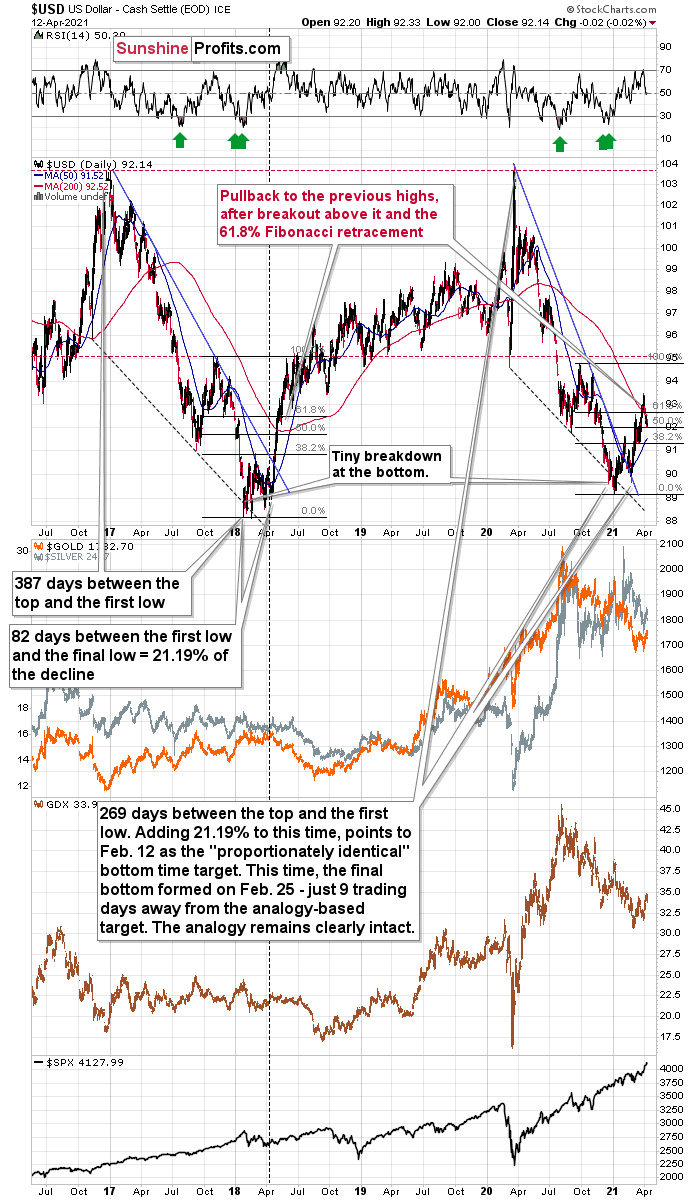
The similarity between two declines (2017-2018 and 2020-2021) is so big that it’s almost useless to describe it. Almost identical starting points, extremely similar ending points, and a very similar correction after the first half of the decline. The recent decline was a bit shorter, but otherwise both price moves are almost identical.
In both cases, the declines have ended below 90 and the final confirmation came when the USD Index rallied above both: its declining blue resistance line, and the 50-day moving average, which is also marked in blue. There was also – in both cases – a pullback after the USD Index soared above its 200-day moving average that I marked in red. That’s the “you are here” point on the roadmap.
What’s next? Most likely another sharp short-term upswing.
Given the magnitude of the 2017-2018 upswing, ~94.5 is likely the USD Index’s first stop. And in the months to follow, the USDX will likely exceed 100 at some point over the medium or long term.
Keep in mind though: as far as the fundamentals of different currencies are concerned, we’re not bullish the greenback because of the U.S.’s absolute outperformance. It’s because the region is doing (and likely to do) better than the Eurozone and Japan, and it’s this relative outperformance that matters, not the strength of just one single country or monetary area. After all, the USD Index is a weighted average of currency exchange rates and the latter move on a relative basis.
If the USD Index is practically done correcting, then the rally in the precious metals is also over, and that’s exactly what the charts are saying.
Gold
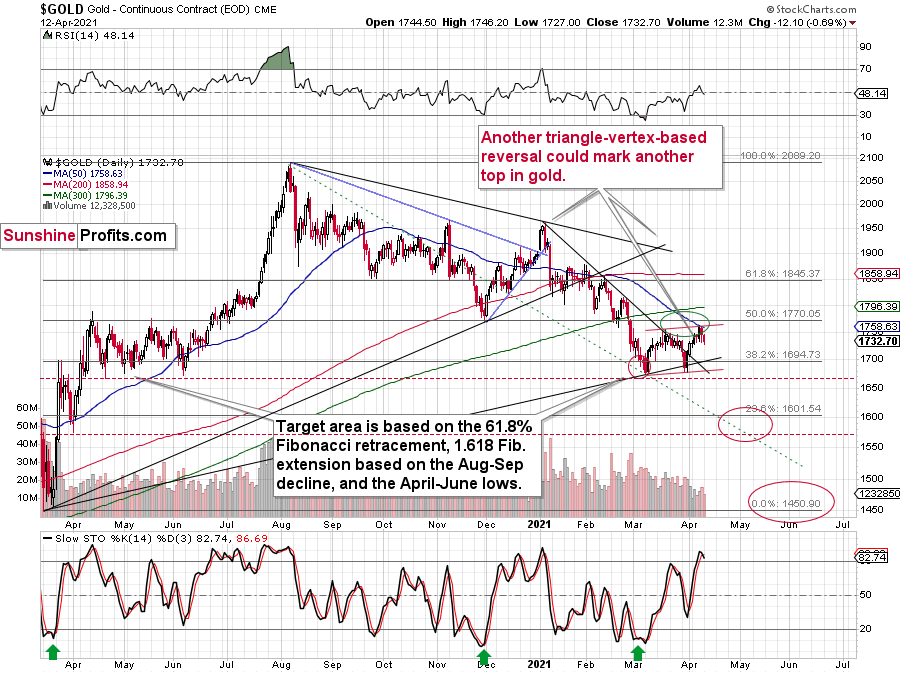
Gold topped right at its triangle-vertex-based reversal, just like it did in mid-March and in early January (please note the points that are marked on the above chart for confirmation – they are described in red). That happened on Thursday (Apr. 8), and since that time gold continue to move lower (also during today’s pre-market trading).
Gold invalidated the breakout above its mid-March highs, proving that what we saw was nothing more than just an ABC (zigzag) correction within a bigger downswing. The moves that follow such corrections are likely to be similar to the moves that precede it. In this case, the move that preceded the correction was the 2021 decline of over $150. This means that another $150+ decline could have just begun.
Miners: GDX and GDXJ ETFs
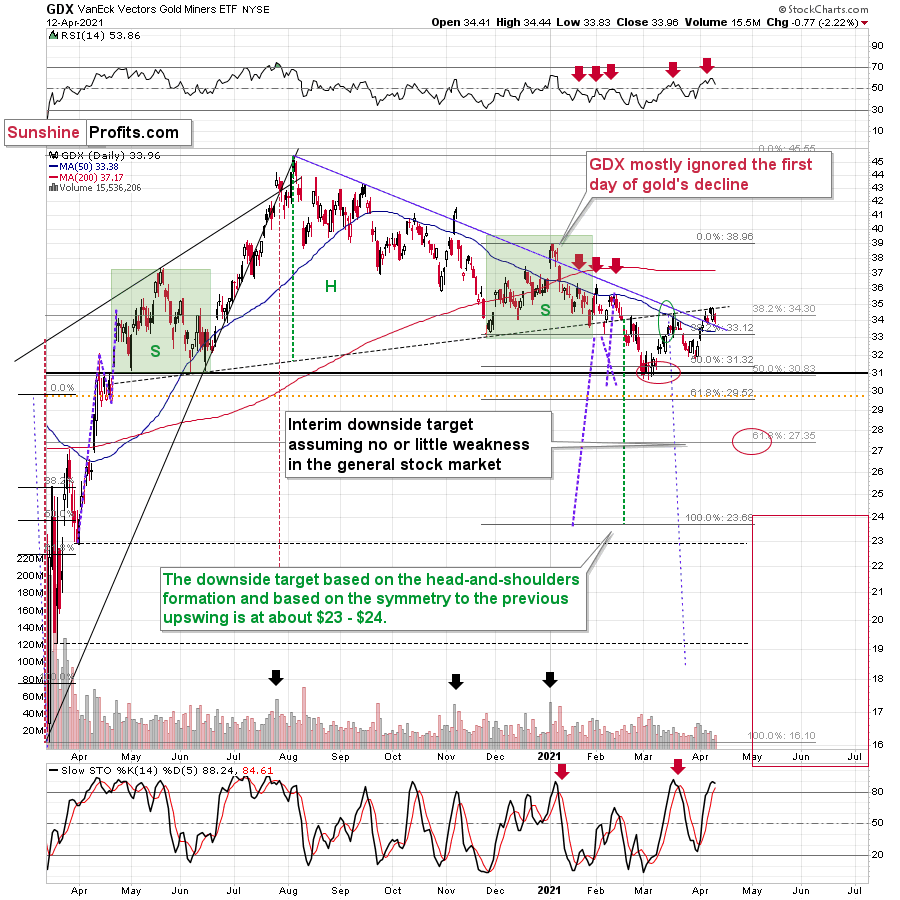
Just like the GDX ETF invalidated the breakout above its mid-March highs, it once again verified the breakdown below the broad head-and-shoulders pattern. Also, please note that the volume that accompanied yesterday’s (Apr. 12) decline was bigger than that which accompanied Friday’s (Apr. 9) intraday rally.
The implications are bearish, and we can say the same about the implications of the situation in the GDXJ chart.
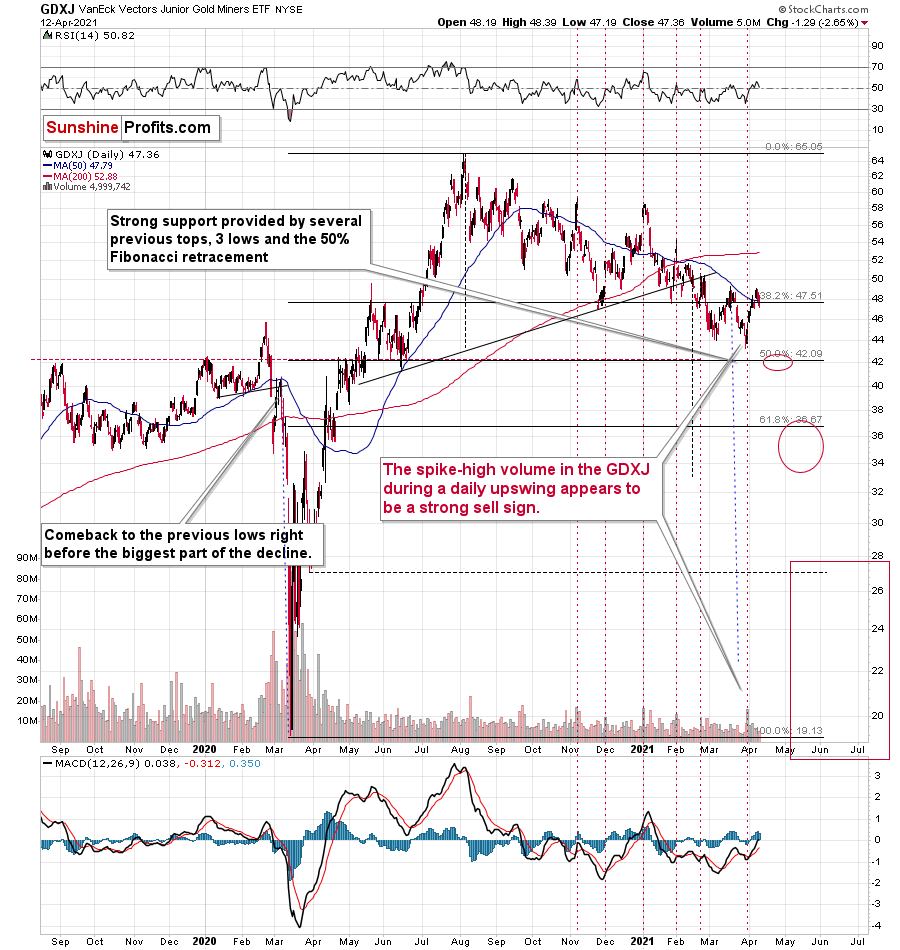
In this case, we even saw the invalidation of the breakout above the 50-day moving average.
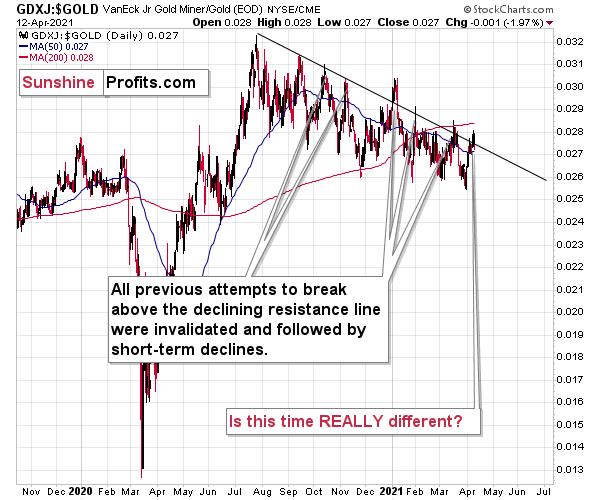
Even more interesting is that the GDXJ to gold ratio that I described previously, has just invalidated its small breakout above its declining resistance line.
Yesterday, I commented on the above in the following way:
The breakout in the GDXJ to gold ratio is only tiny and unconfirmed. These moves always (since Oct. 2020) provided sell signals – the small breakouts below the declining resistance line were always invalidated and they were then followed by visible short-term declines.
Five out of five previous attempts to break above the declining resistance line failed and were followed by short-term declines. Is this time really different?
It seems to me that the five out of five efficiency in the GDXJ to gold ratio is more important than a single breakout in the GDX to gold ratio, especially considering that the latter was preceded by a similar breakout in mid-March. That breakout failed and was followed by declines.
The implications of yesterday’s invalidation of the breakout in the ratio are clearly bearish.
Having said that, let’s take a look at the market from a more fundamental angle.
The Balancing Act
As a healthy debate unfolds surrounding the future direction of the PMs, the bulls and the bears have retreated to their respective corners. However, because forming an emotional attachment to one’s positions is more than suboptimal, we let the data speak for itself.
After setting an all-time high and ending the year on a relative high note, gold was one of 2020’s top-performing commodities. However, with material imbalances building in the spot market, it was only a matter of time before the futures market reflected the reality.
Please see below:
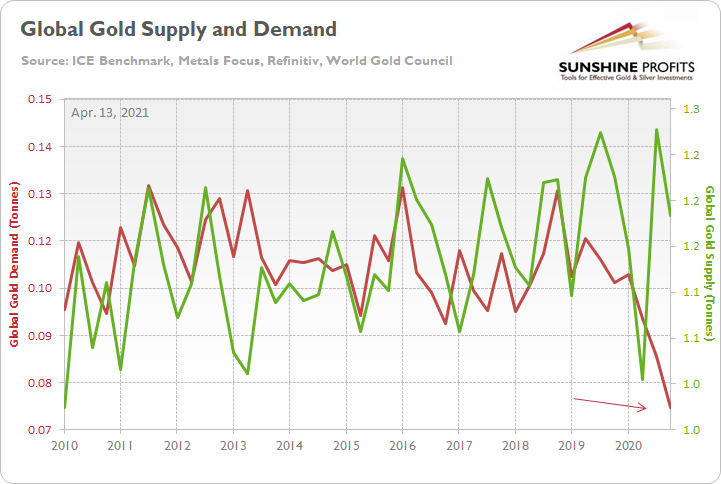
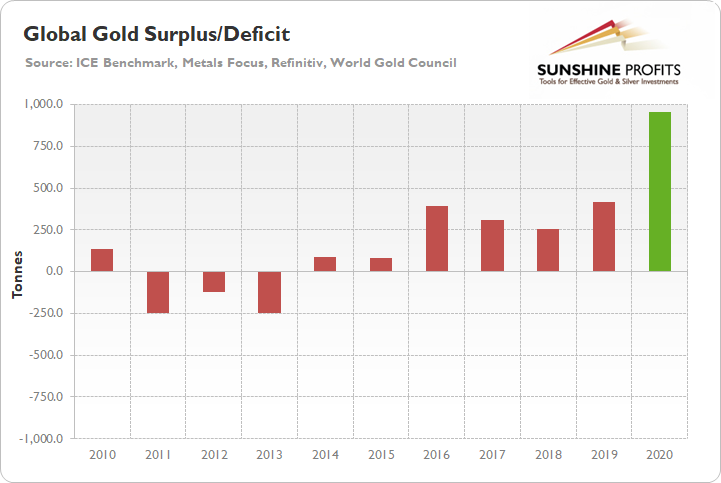
To explain, the green line above tracks global gold supply, while the red line above tracks global gold demand. If you analyze the right side of the chart, you can see that amid the 2020 rally, global demand for the yellow metal continued to move lower. Moreover, with the imbalance reaching 957.8 tonnes in the fourth quarter of 2020, oversupply is now at its highest level in 10 years.
Please see below:
More importantly though, investor demand was the primary driver of the yellow metal’s 2020 performance. However, in Q4:2020, global investment flows fell to their lowest level in 10 years.
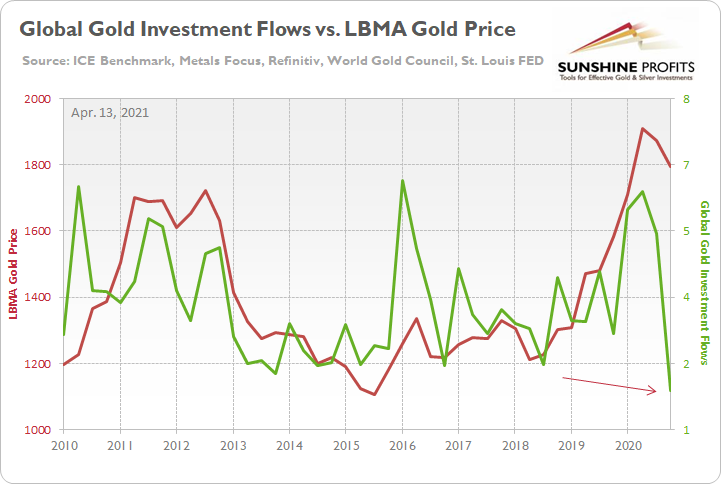
To explain, the green line above tracks global gold investment flows, while the red line above tracks the London Bullion Market Association (LBMA) gold price. If you analyze the right side of the chart, you can see that the quarterly gap between the LBMA gold price and investor demand has been blown wide open.
Furthermore, headlining the bearish about face, gold-backed ETF flows have suffered a sharp reversal. For context, flows are calculated by tracking the performance of gold-backed ETFs (and similar products) like the SPDR Gold Trust (GLD) and the iShares Gold Trust (IAU).
Please see below:
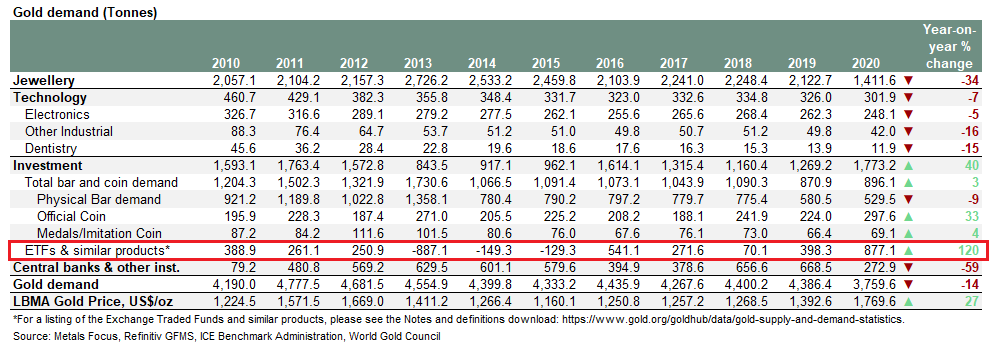
To explain, 2020 declines in jewelry demand (– 34%), technology demand (– 7%) and central bank demand (– 59%) were overshadowed by strong investment demand (+ 40%). And with ETFs and similar products (+ 120%) doing much of the heavy lifting, the yellow metal was able to sidestep the record supply/demand imbalance.
So, what’s the problem?
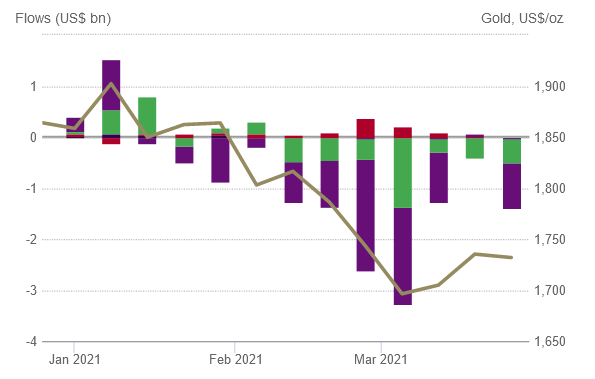
Well, with ETF flows rolling over since the New Year, investors have withdrawn a net $10.23 billion from gold-backed ETFs.
Please see below:
 Source: World Gold Council
For context, the purple bars above represent North American ETF flows, while the green and red bars represent European and Asian ETF flows. As you can see, North American investors have exacerbated gold’s YTD swoon.
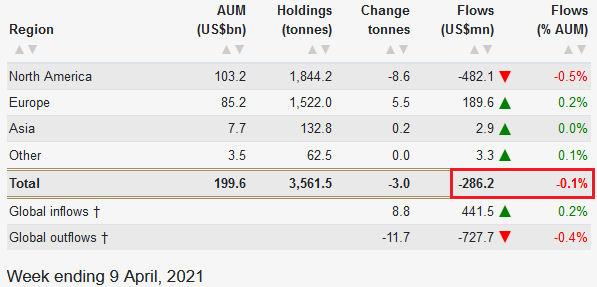
But even more ominous, as the yellow metal rallied by 0.97% last week, ETF investors actually reduced their gold exposure by a net $286.2 million. Thus, the yellow metal’s recent strength hasn’t instilled much confidence in the average investor.
 Source: World Gold Council
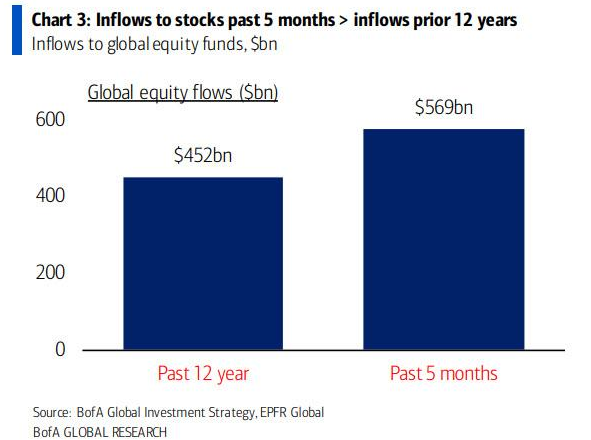
Unsurprisingly, gold’s recent pain has been equities’ gain. While the yellow metal has suffered mightily over the last three months, five-month inflows into global equities have actually exceeded the previous 12 years.
Please see below:
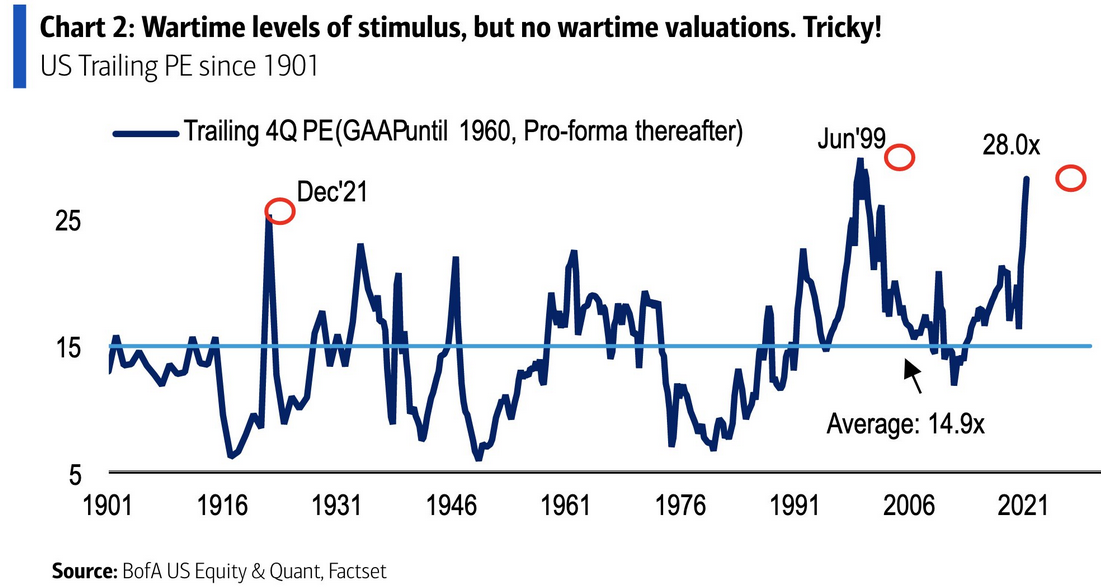
Likewise, U.S. equities entered April with the second-highest trailing adjusted P/E in more than 100 years. For context, the 1960-and-prior P/E is calculated by adhering to Generally Accepted Accounting Principles (GAAP), while post-1960, the pro-forma (adjusted) P/E is calculated by excluding companies’ non-recurring gains and losses. More importantly though, the current reading (28x) is also 88% higher than the long-term average (14.9x).
And why does the behavior of U.S. equity investors matter?
Because, their optimism, or lack thereof, is a double-edged sword for gold.
Case in point: with retail investors ditching gold-backed ETFs and rerouting those funds into global equities, the stock market’s upward inertia continues to yield positive results. Previously, I highlighted the importance of positive and negative convexity. In a nutshell: positive convexity allows you to make more money on the upside and lose less money on the downside (negative convexity is the opposite). And with equity investors’ ‘buy the dip’ mentality resulting in sharp upswings and small corrections, what motivation do they have to sell equities and buy gold?
On the flip side, when you combine record-high optimism and record-high leverage with a critically injured global economy, equities’ ‘come to Jesus’ moment will likely culminate with an epic unwind. As evidence, notice how extreme P/E dispersions often result in extreme reversions?
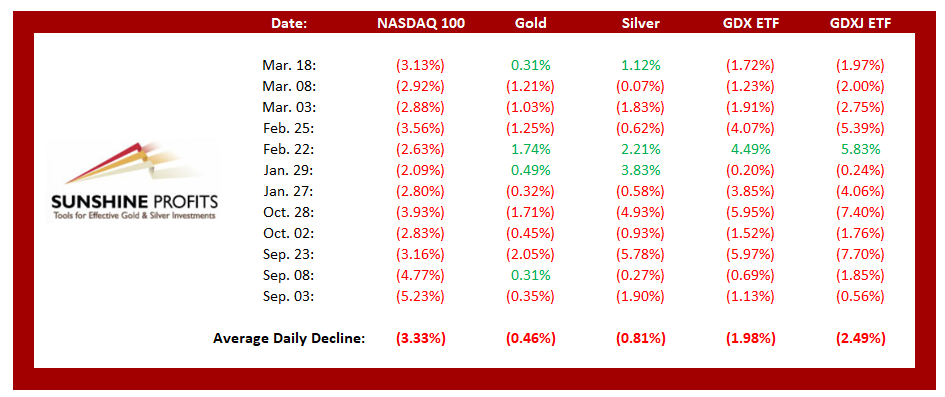
In spite of that, even if equities sail over the speculative waterfall, the negativity will likely cascade across the precious metals’ market. If you analyze the table below, you can see that NASDAQ 100 drawdowns of more than 2.00% tend to unnerve the PMs. Moreover, if you exclude silver’s short squeeze on Jan. 29 and the NASDAQ 100’s relatively ‘quiet’ 2.63% drawdown on Feb. 22, bouts of equity volatility significantly impact the PMs (especially the miners).
The bottom line?
The PMs remain in no man’s land.
Also troublesome, the U.S. 10-Year Treasury yield jumped by another 1.20% on Apr. 12 – stifling the PMs in the process. And while the former’s recent consolidation has helped uplift the latter, another bout of interest rate volatility could be on the horizon.
On Jan. 15, I warned that Jerome Powell, Chairman of the U.S. Federal Reserve (FED), was wrong when he claimed that he didn’t see any “unwelcome” inflation.
I wrote:
While the FED Chair doesn’t see any “unwelcome” inflation, commodities aren’t exactly supporting his vision. For goods and services that we use/need on a daily basis, inflation is abundant. And because higher inflation is a precursor to higher interest rates, Powell’s own polices (and their impact on real and financial assets) actually eliminate his ability to determine when interest rates rise.
Thus, while rising inflation is a long-term positive for gold, the short-term effect of higher interest rates should pressure the yellow metal in the near future.
And after finally acknowledging the obvious on Mar. 17, Powell said in a “60 Minutes” interview on Apr. 11 that “we want to see inflation move up to about 2%. And we mean that on a sustainable basis. We don’t mean just tap the base once.” For context, this is Powell’s way of admitting that he was wrong without actually admitting that he was wrong.
So, let’s examine:
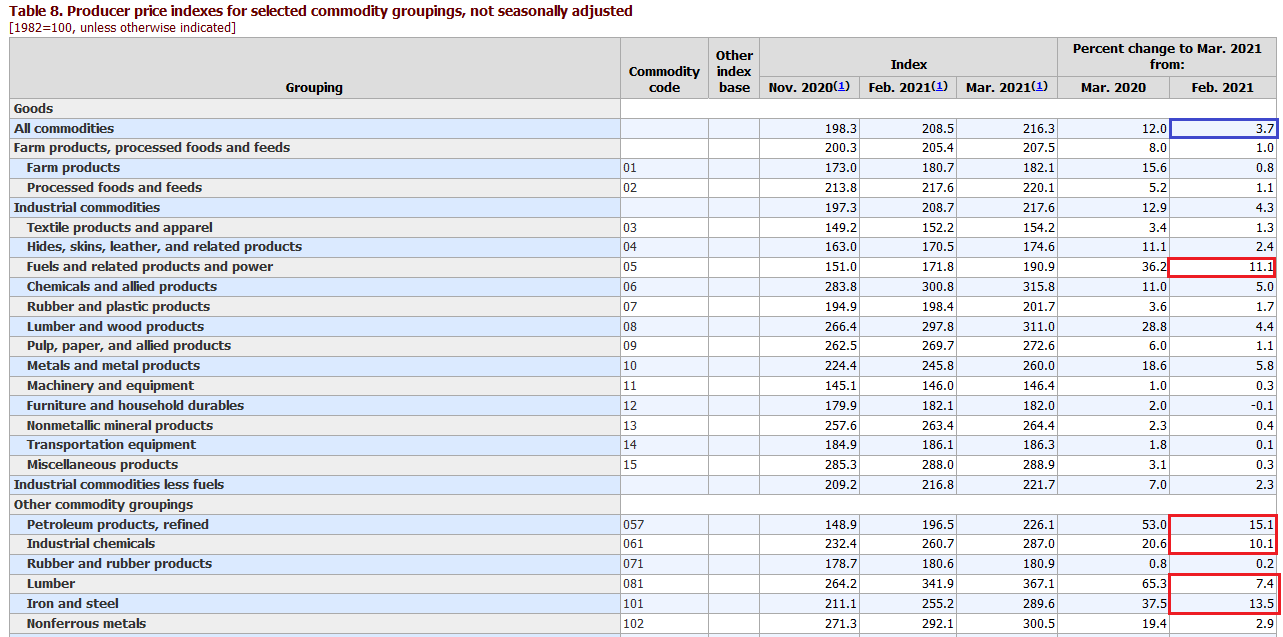
While investors eagerly await the Consumer Price Index (CPI) release on Apr. 13 – which measures inflationary pressures on consumer goods – prior prints by The U.S. Bureau of Labor Statistics (BLS) have failed to paint an accurate portrait. Case in point: while U.S. CPI has remained relatively dormant, all other measures of inflation continue to skyrocket. For example, the Commodity Producer Price Index (PPI) – which was released on Apr. 9 – surged by 3.7% in March, the largest month-over-month (MoM) percentage increase since July 1974.
Moreover, in only one month, the cost of fuel, power, petroleum, industrial chemicals, iron and steel increased by more than 10%, while the cost of lumber increased by more than 7%.
Please see below:
 Source: BLS
More importantly though, notice the close connection between commodity PPI and the U.S. 5-Year breakeven inflation rate?
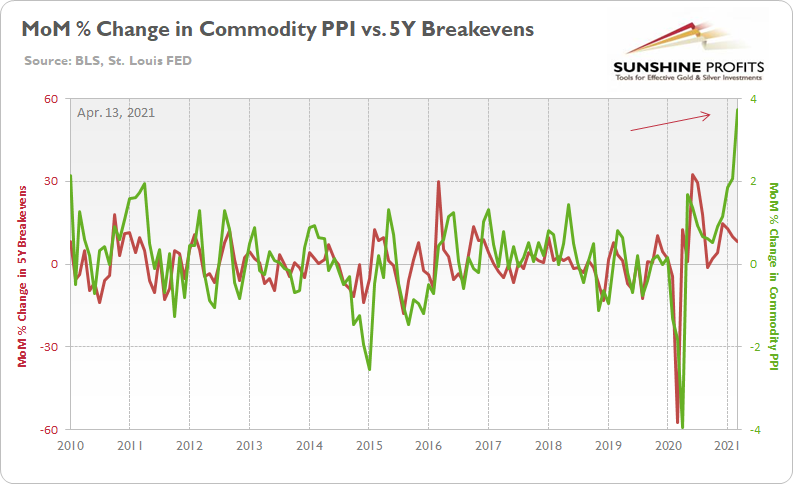
To explain, the green line above tracks the MoM percentage change in commodity PPI, while the red line above tracks the MoM percentage change in the U.S. 5-Year breakeven inflation rate. If you analyze the right side of the chart, you can see that commodity PPI has completely decoupled from the U.S. 5-Year breakeven inflation rate. As a result, where do you think the U.S. 5-Year breakeven inflation rate is headed next?
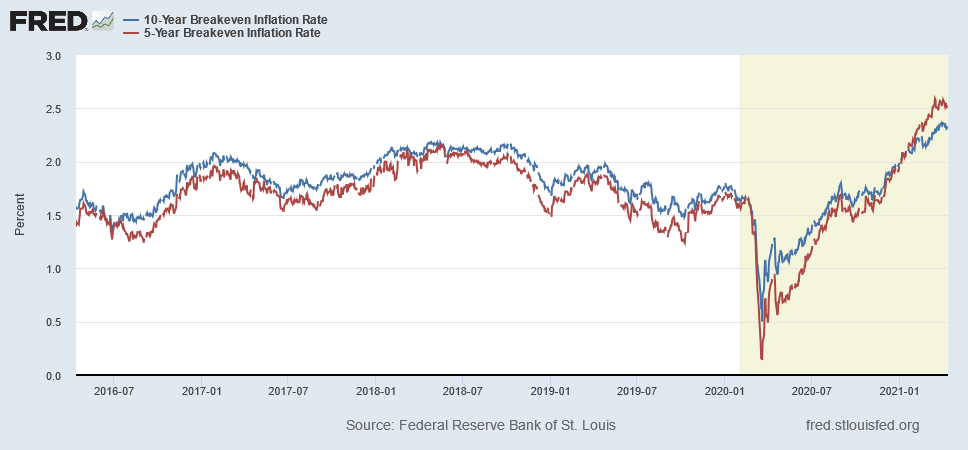
Furthermore, if the change in commodity PPI proves prescient, notice how the U.S. 10-Year breakeven inflation rate tends to track the U.S. 5-Year breakeven inflation rate?
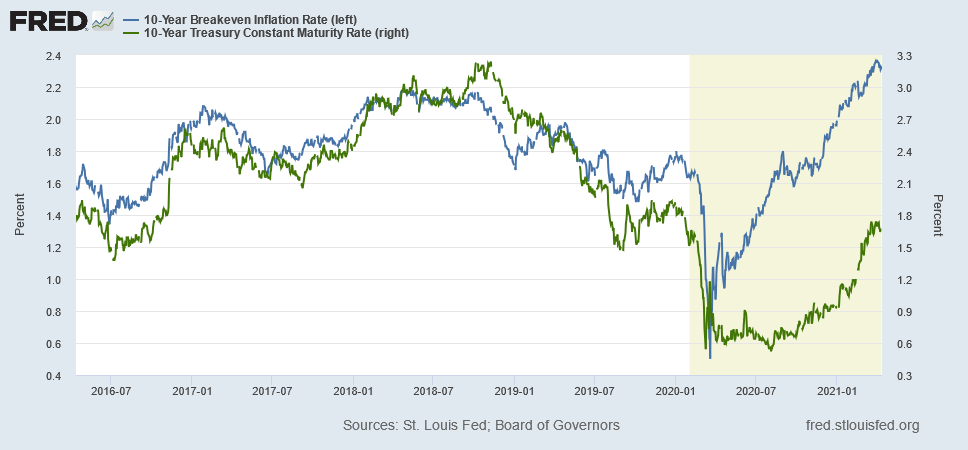
And because rising inflation is a precursor to higher interest rates, when the U.S. 10-Year breakeven inflation rate jumps, notice how the U.S. 10-Year Treasury yield isn’t far behind?
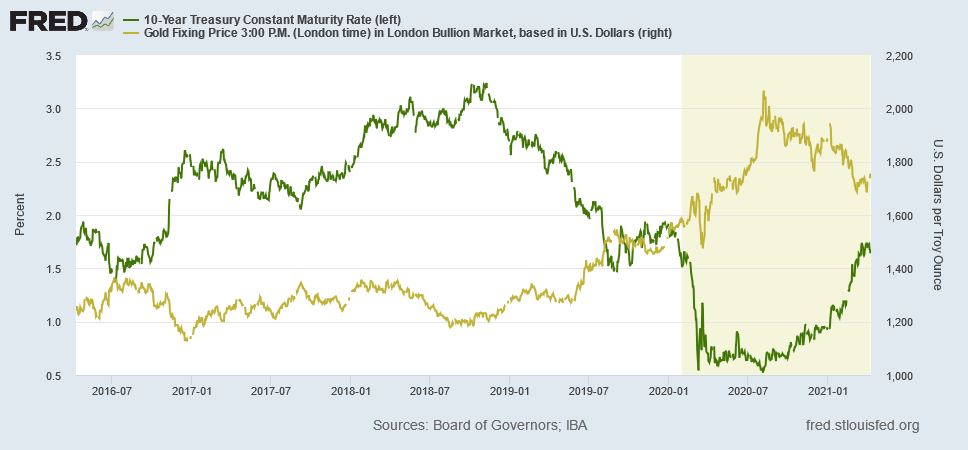
And piecing together the correlation puzzle, notice how gold responds negatively to a rising U.S. 10-Year Treasury yield?
All in all, gold is stuck between a rock and a hard place, as sentiment and medium-term fundamentals have abandoned the yellow metal. Moreover, with both the USD Index and the U.S. 10-Year Treasury yield consolidating recently, gold’s tepid rally cemented its relative underperformance. Furthermore, with investor outflows also coinciding with the upswing, the sentiment shift signals a lack of belief in the yellow metal. As a result, the medium-term outlook remains profoundly bearish. Conversely, once the PMs have a chance to rerate to a more appropriate level, their long-term bull market will likely continue.
Overview of the Upcoming Part of the Decline
- It seems likely to me that the corrective upswing was already completed last week. Consequently, it seems that the next big move lower is already underway.
- After miners slide once again in a meaningful and volatile way, but silver doesn’t (and it just declines moderately), I plan to switch from short positions in miners to short positions in silver (this could take another 1-2 weeks to materialize). I plan to exit those short positions when gold shows substantial strength relative to the USD Index, while the latter is still rallying. This might take place with gold close to $1,450 - $1,500 and the entire decline (from above $1,700 to about $1,475) would be likely to take place within 1-12 weeks and I would expect silver to fall hardest in the final part of the move. This moment (when gold performs very strongly against the rallying USD and miners are strong relative to gold – after gold has already declined substantially) is likely to be the best entry point for long-term investments in my view. This might happen with gold close to $1,475, but it’s too early to say with certainty at this time. In other words, the entire decline could take between 1 and 12 weeks, with silver declines occurring particularly fast in the final 1-2 weeks.
- If gold declines even below $1,500 (say, to ~$1350 or so), then it could take another 10 weeks or so for it to bottom, but this is not what I view as a very likely outcome.
- As a confirmation for the above, I will use the (upcoming or perhaps we have already seen it?) top in the general stock market as the starting point for the three-month countdown. The reason is that after the 1929 top, gold miners declined for about three months after the general stock market started to slide. We also saw some confirmations of this theory based on the analogy to 2008. All in all, the precious metals sector would be likely to bottom about three months after the general stock market tops . If the mid-February 2020 top was the final medium-term top (based on NASDAQ’s top, then it seems that we might expect the precious metals sector to bottom in mid-May or close to May’s end. If, however, the mid-March 2020 top was the final medium-term top (based on the S&P 500), then we might expect the precious metals sector to bottom in mid-June or close to June’s end.
- The above is based on the information available today and it might change in the following days/weeks.
Summary
To summarize, the PMs’ medium-term decline is well underway, and based on the recent performance of the USD Index, gold and mining stocks, it seems that the corrective upswing is already over or about to be over. Based on gold’s triangle-vertex-based reversal it seems that we saw the top on Thursday (Apr. 8). The next big move lower seems to be already underway or about to start.
In addition, because we’re likely entering the “winter” part of the Kondratiev cycle (just like in 1929 and then the 1930s), the outlook for the precious metals’ sector remains particularly bearish during the very first part of the cycle, when cash is king.
The confirmed breakout in the USD Index is yet another confirmation of the bearish outlook for the precious metals market.
After the sell-off (that takes gold to about $1,450 - $1,500), we expect the precious metals to rally significantly. The final part of the decline might take as little as 1-5 weeks, so it's important to stay alert to any changes.
Most importantly, please stay healthy and safe. We made a lot of money last March and it seems that we’re about to make much more on this March decline, but you have to be healthy to enjoy the results.
As always, we'll keep you - our subscribers - informed.
By the way, we’re currently providing you with a possibility to extend your subscription by a year, two years or even three years with a special 20% discount. This discount can be applied right away, without the need to wait for your next renewal – if you choose to secure your premium access and complete the payment upfront. The boring time in the PMs is definitely over and the time to pay close attention to the market is here. Naturally, it’s your capital, and the choice is up to you, but it seems that it might be a good idea to secure more premium access now, while saving 20% at the same time. Our support team will be happy to assist you in the above-described upgrade at preferential terms – if you’d like to proceed, please contact us.
To summarize:
Trading capital (supplementary part of the portfolio; our opinion): Full speculative short positions (300% of the full position) in mining stocks are justified from the risk to reward point of view with the following binding exit profit-take price levels:
Mining stocks (price levels for the GDXJ ETF): binding profit-take exit price: $24.12; stop-loss: none (the volatility is too big to justify a stop-loss order in case of this particular trade)
Alternatively, if one seeks leverage, we’re providing the binding profit-take levels for the JDST (2x leveraged) and GDXD (3x leveraged – which is not suggested for most traders/investors due to the significant leverage). The binding profit-take level for the JDST: $39.87; stop-loss for the JDST: none (the volatility is too big to justify a SL order in case of this particular trade); binding profit-take level for the GDXD: $94.87; stop-loss for the GDXD: none (the volatility is too big to justify a SL order in case of this particular trade).
For-your-information targets (our opinion; we continue to think that mining stocks are the preferred way of taking advantage of the upcoming price move, but if for whatever reason one wants / has to use silver or gold for this trade, we are providing the details anyway.):
Silver futures upside profit-take exit price: unclear at this time - initially, it might be a good idea to exit, when gold moves to $1,512.
Gold futures upside profit-take exit price: $1,512.
Long-term capital (core part of the portfolio; our opinion): No positions (in other words: cash
Insurance capital (core part of the portfolio; our opinion): Full position
Whether you already subscribed or not, we encourage you to find out how to make the most of our alerts and read our replies to the most common alert-and-gold-trading-related-questions.
Please note that we describe the situation for the day that the alert is posted in the trading section. In other words, if we are writing about a speculative position, it means that it is up-to-date on the day it was posted. We are also featuring the initial target prices to decide whether keeping a position on a given day is in tune with your approach (some moves are too small for medium-term traders, and some might appear too big for day-traders).
Additionally, you might want to read why our stop-loss orders are usually relatively far from the current price.
Please note that a full position doesn't mean using all of the capital for a given trade. You will find details on our thoughts on gold portfolio structuring in the Key Insights section on our website.
As a reminder - "initial target price" means exactly that - an "initial" one. It's not a price level at which we suggest closing positions. If this becomes the case (like it did in the previous trade), we will refer to these levels as levels of exit orders (exactly as we've done previously). Stop-loss levels, however, are naturally not "initial", but something that, in our opinion, might be entered as an order.
Since it is impossible to synchronize target prices and stop-loss levels for all the ETFs and ETNs with the main markets that we provide these levels for (gold, silver and mining stocks - the GDX ETF), the stop-loss levels and target prices for other ETNs and ETF (among other: UGL, GLL, AGQ, ZSL, NUGT, DUST, JNUG, JDST) are provided as supplementary, and not as "final". This means that if a stop-loss or a target level is reached for any of the "additional instruments" (GLL for instance), but not for the "main instrument" (gold in this case), we will view positions in both gold and GLL as still open and the stop-loss for GLL would have to be moved lower. On the other hand, if gold moves to a stop-loss level but GLL doesn't, then we will view both positions (in gold and GLL) as closed. In other words, since it's not possible to be 100% certain that each related instrument moves to a given level when the underlying instrument does, we can't provide levels that would be binding. The levels that we do provide are our best estimate of the levels that will correspond to the levels in the underlying assets, but it will be the underlying assets that one will need to focus on regarding the signs pointing to closing a given position or keeping it open. We might adjust the levels in the "additional instruments" without adjusting the levels in the "main instruments", which will simply mean that we have improved our estimation of these levels, not that we changed our outlook on the markets. We are already working on a tool that would update these levels daily for the most popular ETFs, ETNs and individual mining stocks.
Our preferred ways to invest in and to trade gold along with the reasoning can be found in the how to buy gold section. Furthermore, our preferred ETFs and ETNs can be found in our Gold & Silver ETF Ranking.
As a reminder, Gold & Silver Trading Alerts are posted before or on each trading day (we usually post them before the opening bell, but we don't promise doing that each day). If there's anything urgent, we will send you an additional small alert before posting the main one.
Thank you.
Przemyslaw Radomski, CFA
Founder, Editor-in-chief

