

Briefly: in our opinion, full (250% of the regular position size) speculative short positions in mining stocks are justified from the risk/reward point of view at the moment of publishing this Alert. We increased our position in the miners early during yesterday's session and since miners declined shortly thereafter, it was a profitable move.
In yesterday's Gold Trading Alert, we commented on gold's breakout above the previous highs and described the completion of the inverse head-and-shoulders pattern in the following way:
Q2: As you can see today, gold future formed inverse head and shoulder pattern with neckline 1700 and depth about 250.
This imply gold can go to 1950.
A2: Yes, it does imply that and that's probably why gold shot up so high once the previous highs were broken. Still... We have very little trust in this formation. One thing is that the breakout above it is not confirmed, and the other thing is that the recent rally was something that was very much in tune with the analogy to 2008. There was some strength, gold even broke to new highs, but... That's pretty much it. Neither silver, nor miners broke to new highs, or were close to doing so - that's exactly what we saw in 2008, before the final slide in gold.
Let's take a look at gold's breakout to new 2020 highs.
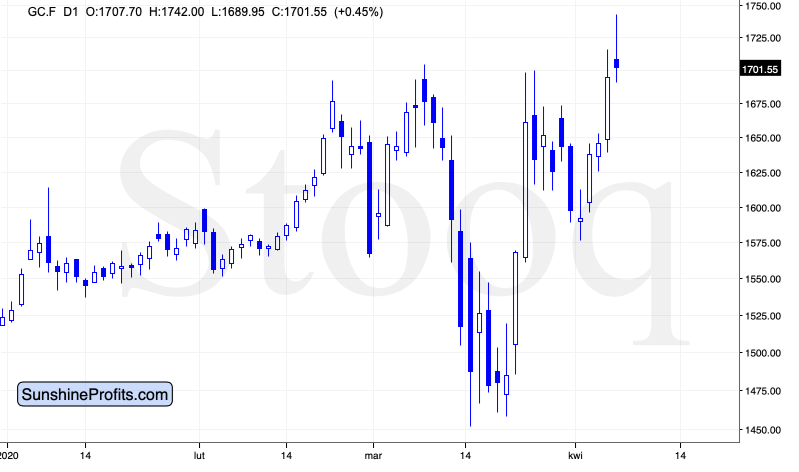
Gold has indeed moved sharply above the previous 2020 highs, but it also moved sharply back down. This could be viewed as a small pullback and a verification of the breakout... But only if the price of gold rallies and closes higher for the next two trading days. This seems doubtful due to the above-mentioned factors but also due to the short-term situation in the USD Index.
And what happened in the following hours? Did gold move as we had forecasted?
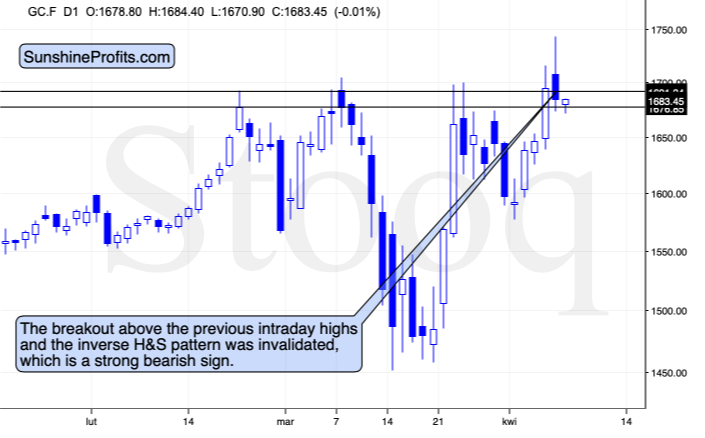
Gold declined (forming a huge reversal) and closed the day below the previous 2020 intraday highs, effectively invalidating the breakout above them. Gold still closed the session above the previous highs in terms of the daily closing prices, but the intraday invalidation is already significant. It's particularly significant given that the USD Index moved initially lower yesterday. Gold didn't use this move to rally - it only softened its intraday decline.
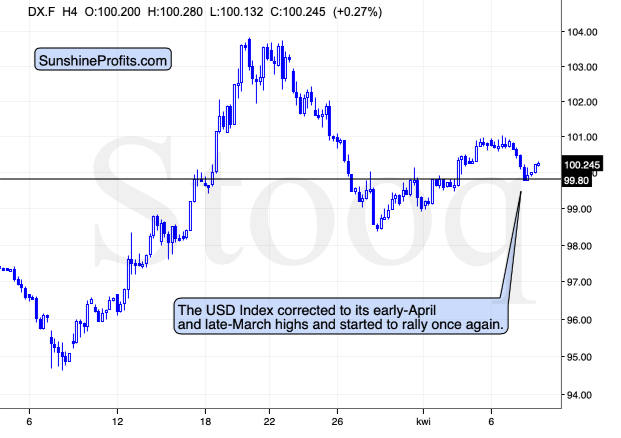
Since yesterday's decline in the USD Index seems to have already ended, its correction after bouncing from the support provided by the previous highs, it seems that the pressure on gold will now be negative.
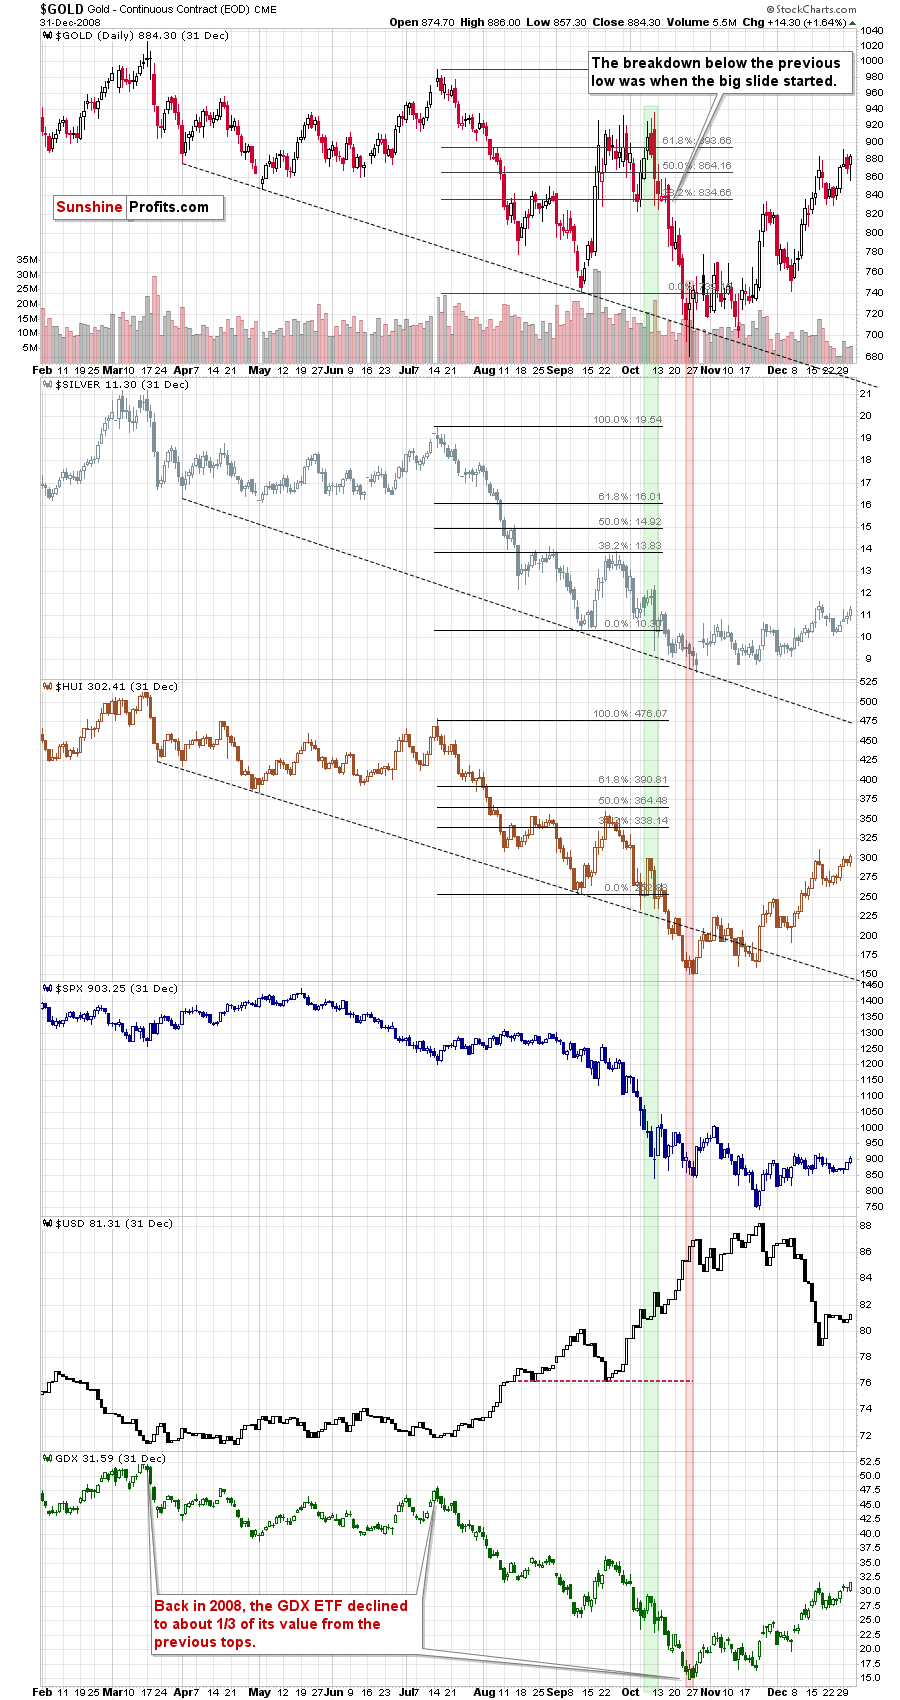
The 2008 - 2020 link remains intact, not only fundamentally, but also technically.
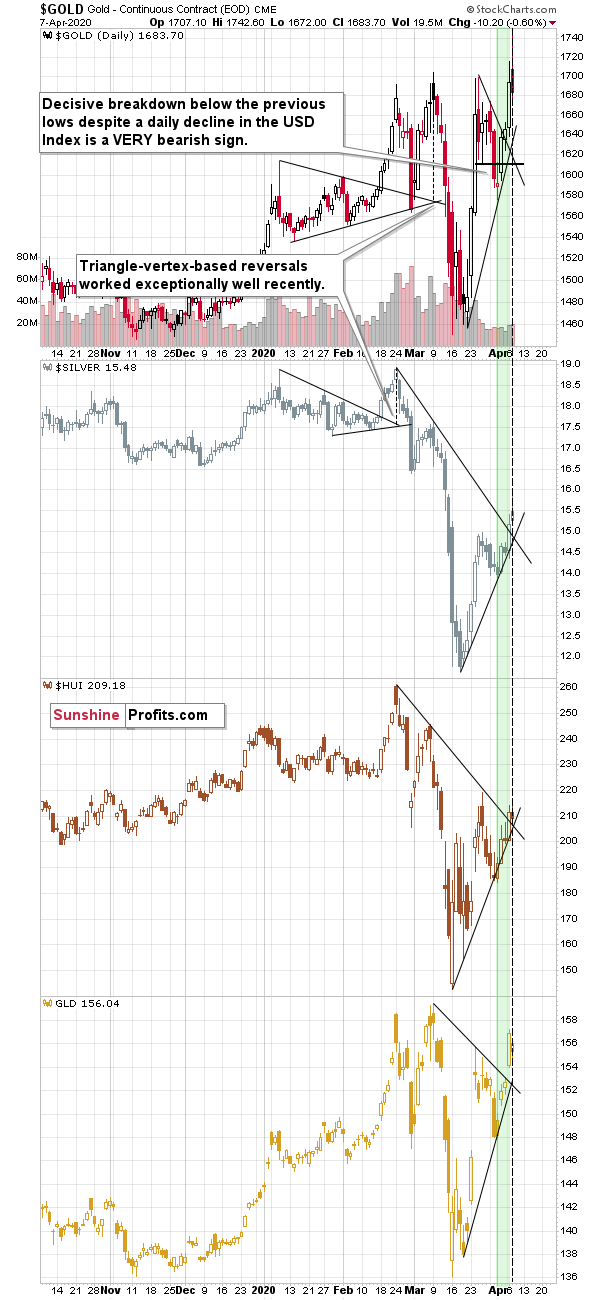
In Monday's Alert, we commented on the above chart in the following way:
Silver moved higher, but not above its recent high, and miners corrected about half of their most recent downswing. It seems that the two periods in 2008 and 2020 (both marked with green) are indeed very similar.
Note: silver might exceed its recent high temporarily as the market might focus on the industrial demand due to the upcoming infrastructure projects. That's unlikely to be anything more than a temporary development.
As you can see, there are there are triangle-vertex-based reversals early this week in all key parts of the precious metals sector: in gold, in silver, and the mining stocks. We also get the same indication based on the GLD ETF.
This means that - based on this trading technique - it's very likely that we'll see some kind of reversal today or tomorrow. Based on the analogy to 2008, it's likely to be a local top, even despite the rally in the USD Index.
That's exactly what happened. GLD seems to have topped on Monday, while gold futures and silver futures topped on Tuesday. Miners topped on Monday in terms of the daily closing prices, but they topped in intraday terms yesterday.
The triangle-vertex-based reversals seem to have worked once again - especially in case of gold, and it seems that we were closing the long positions in gold extremely near to the top and the same goes for the timing of increasing the short position in the miners (after temporarily limiting it).
Please note that the top is likely in also based on the analogy to how the situation developed in 2008. The next slide is likely to be particularly volatile.
The final note on the link to 2008 is that back then, gold made more than one attempt to break above previous highs, so while it is not inevitable this time, we shouldn't be surprised if we see something like that. Still, given the size of the rally that immediately followed the fake breakout to new 2020 highs, it seems that the rally is already over after all.
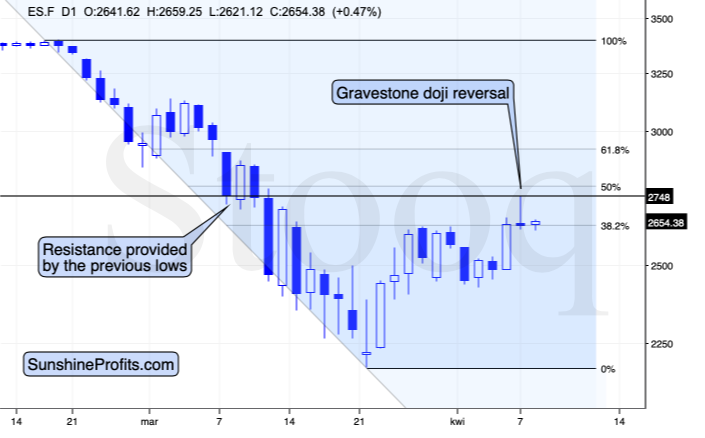
The stock market rallied yesterday... Up to a point. Then it reversed and ultimately created the gravestone doji reversal, which is a major bearish indication for the short term.
The S&P 500 seems to have topped between the 38.2% and 50% Fibonacci retracement levels.
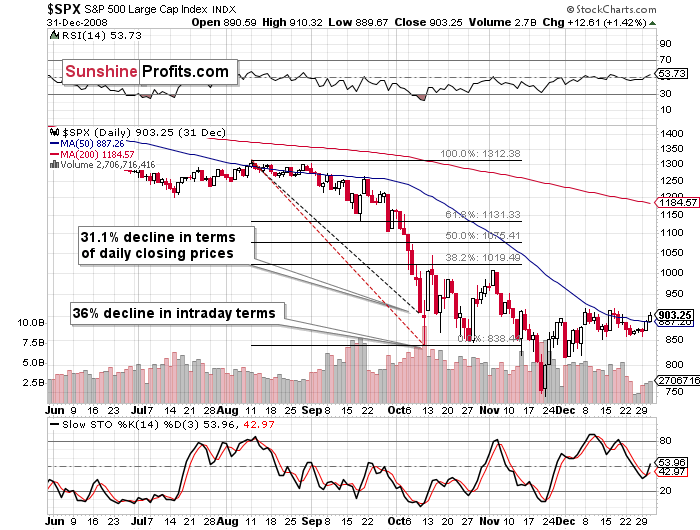
That's exactly where it topped after the most volatile decline of 2008. The mid-October 2008 top was also formed on an intraday basis, which makes these cases even more similar.
How is this likely to impact the mining stock prices?
In yesterday's analysis, we wrote the following:
Miners are likely to move higher today, but they may not be able to close higher despite the intraday rally. In fact, we expect to see another high in the mining stocks during today's session.
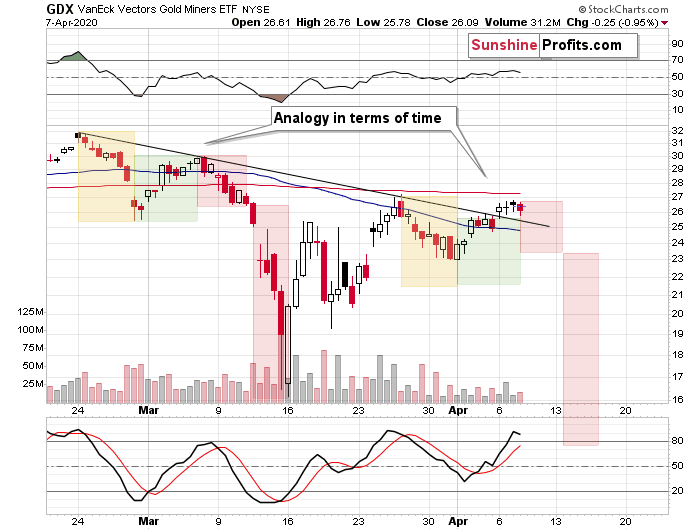
Given the positive boost from both: gold, and the general stock market, miners should move sharply higher... And yet, we don't expect their rally to be anything to call home about. They might move to their late-March highs or even a bit (a few percent) above them, but - unlike gold - they will most likely not move to, let alone above their previous 2020 high.
Please note that the situation between late-March high and today is very similar to what we saw between the February top and the early-March high. The colored rectangles are based on the former price moves and they are copied to the current case. The first decline (yellow rectangle) fits perfectly in terms of time. If we see a reversal today, the green rectangle will fit perfectly as well.
If the analogy holds, we can see a few days of decline at a moderate pace and then a few days of a dramatic slide.
Then again... Please keep in mind that the final decline in gold and mining stocks was more volatile in 2008 than the initial decline. In case of silver, it was similarly volatile. This means that miners could decline even faster than the above chart suggest.
The above remains up-to-date. That's exactly what happened. Miners formed an intraday high, topping in the first half of the session (first of the last two 4-hour candlesticks), and then they declined, closing below Monday's close.
As far as the GDXJ ETF chart is concerned, we commented on it in the following way:
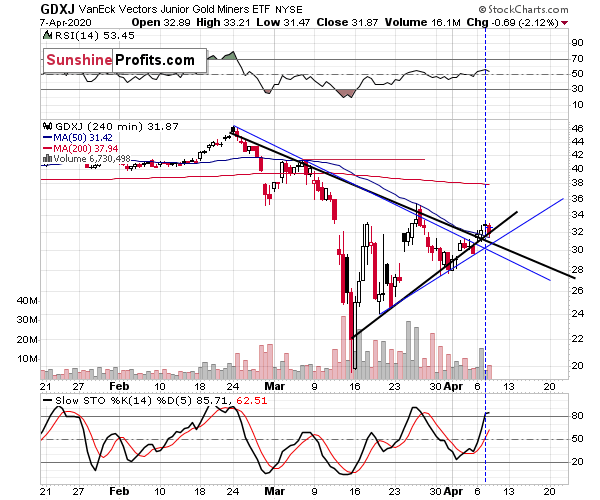
The GDXJ chart also confirms the likelihood of seeing a turnaround today.
Interestingly, the vertex of the triangle based on the closing prices (black) was yesterday, while the vertex of the triangle based on the intraday extremes (blue) is today. Perhaps yesterday was the high in terms of the closing prices, while today we'll see the high in terms of the intraday prices.
That's also exactly what happened. Please note the laser precision of the triangle-vertex-based reversal technique. The lines based on the closing prices pointed to the top in terms of the closing prices, while the ones based on intraday extremes, perfectly detected the intraday reversal.
From the Readers' Mailbag
Q: Hello PR, Thank you for your very detailed response, you've been very generous with your time. I wanted to let you know some details about this coronavirus that you may not be aware of since so much of your forecast appears to be based on its impact on our economy.
Most of the media is ignoring the recent studies that show that patients treated with Hydroxychloroquine/Azithromycin & Zinc are having very high recovery rates.
The 3rd study is showing that out of 1,000 patients hospitalized with the virus and receiving this treatment, only 20 went to the ICU and out of those they lost 7. In previous studies the rates were even better for recovery. In fact, most recover after 24 hours with full virus free status after 6.
These numbers are going to be formally release in a couple of days. It's my opinion ONLY that this treatment ends this pandemic and likely sparks a rally, although that isn't my reason for writing to you. I am noting that the media is still ignoring this story mainly because of their hatred for Trump. But, the story will come out sooner rather than later.
Since your Monday report had a very grim outlook because of the virus, I just wanted you to be aware of an alternative read on the situation. No need to take any time to respond to me. We'll both know the outcome of your analysis shortly, best of luck to all of us!
A: Thank you for the information. We certainly hope that this is a major step in dealing with the Covid-19 outbreak... However, it seems that this news is not that hidden. We recall watching a Youtube video (can't find the link, sorry) about Hydroxychloroquine/Azithromycin several days ago, and with regard to zinc, we even wrote about it ourselves a couple of days ago (Your Editor and his family have been supplementing with it for quite some time now). So, it's not very likely that the previously unknown news will hit the market. In fact, we were able to find the following on Reuters' Special Report that was published on Monday:
Dr Vladimir Zelenko, a general practitioner in upstate New York, has claimed that a three-drug cocktail of hydroxychloroquine, azithromycin and zinc sulfate has helped mitigate the infection in nearly 200 hundred of his patients before they became sick enough to require hospitalization. His recommendations have attracted the attention of Trump's supporters. Zelenko wasn't immediately available for comment.
Despite such encouraging reports, hard evidence that any of the therapies now under study will work is weeks and possibly months way.
If it's on Reuters, we'd say that the information is generally known, so when another report comes out confirming its validity it will... Not change that much as even more reports are needed. Reuters mentioned that hard evidence is weeks or months away. This could very well be the case - even is something does work better than anything else, it will take time before it can be universally accepted and applied.
The general mortality rate of Covid-19 patients on ICUs is about 50%. If the figures from the report are correct, then it means that the mortality rate in this case decreased to about 35% (7 out of 20). That's a notable decrease, but very far from being a game-changer.
20 out of 1000 patients had to go to ICU, which is 2%. On average, the ICU is required in case of 5% of patients. So, it significantly improved the rate, but was no miracle cure.
Assuming all the above is true, here's how it changes our calculations:
The US population is 327 million. If 40% of Americans get infected, that means about 130 million US Covid-19 cases.
If just 2% of them (assuming everyone would get the effective treatment) require ICU treatment, that's over 2.5 million Americans that would require them.
There are about 100k ICU. Let's say that it all doesn't happen at once, but that a given unit can be used 5 times. This effectively means 500k ICU treatments.
The mortality rate for those, who need the ICU treatment but can't make it there, is 90%. The new mortality rate (assuming the above research is correct) for those in the ICU treatment would be 35%.
US death toll - ICU patients: 35% x 500k = 175k
US death toll - ICU-required-but-not-available patients: 90% x 2M = 1.8M
As you can see, the insufficient number of ICUs is the critical factor.
The total is still about 2M Americans. And this doesn't even take into account the Americans that would die from Covid-19 that don't require ICU treatment (or those needing non-Covid-19 condition care that just want't available at that time because of the understandable healthcare system's focus on dealing with Covid-19.).
The official prediction of the US death toll right now is over 200k - based on the above, it might be understated at least 10x.
Also, please note that we expect the precious metals sector to rebound way before the general stock market bottoms. This likely also means that the precious metals market is likely to bottom before the Covid-19 pandemic is under control. This would be yet another similarity to 2008.
Q: Sir, if the US government is printing so much money to stimulate economy, why would you think the US dollar will continue to go up? Is this time different?
I am neutral, but always like to learn from different experts.
Your articles are very interesting as they provide different views.
A: This time is not different. Back in 2008, the first round of the quantitative easing was released. Then the second round, then the third, and now we have an open-ended QE. Did the US dollar's value decrease in the past 12 years? No, it moved from below 90 to above 100. How could this be the case? Because of three connected factors.
- There are other things that also need to be taken into account.
- The currency exchange rates are just relative valuations. If the Fed prints a gazillion dollars, but at the same time the ECB, BOJ, BOE, SNB print 2 gazillion each, the odds are that the value of the USD Index would soar. Other monetary authorities are also printing money fast.
- The US dollar is still the world's reserve currency and during uncertain times, investors flock to the safest assets with the deepest liquidity. Many people think about the US dollar as the safest asset. Gold is likely to benefit much more than the US dollar, but not initially. Exactly the same thing happened in 2008 and in the following years. Gold plunged sharply at first, but then recovered and kept on rallying in the following years, much more than the USD Index.
Q1: Below link has info which validates your forecast of a rapidly appreciating US$, at least for a while.
Seeking Alpha: The $40 Trillion Problem.
https://seekingalpha.com/article/4336136-40-trillion-problem
A1: It was not really a question, but it's a very good addition to our reply to the previous question.
Q2: Also, it appears there is manipulation happening with the Direxion 3X leveraged funds, especially JDST. For example, today GDXJ was down 2.12%, JNUG was down 2.57% (vs presummable target of -4.24%), & JDST was unchanged (vs presummable target of +4.24%). This has been happening often lately & generally with a higher detriment for JDST. Sometimes they do not even get the direction correct (ie JDST will be negative even when GDXJ is negative). That used to be rare & it has now become a common occurrence, FYI.
A2: We wouldn't call the very short-term discrepancies manipulation - at least not yet. With all the commotion around changing leverage of these funds, some people selling them, some people buying them precisely because of this change, it's not that odd to see rather chaotic price moves on a day-to-day basis. When the bigger moves start (likely shortly), we expect the (2X) leveraged funds to perform as they should. Please keep in mind that they are designed to multiply daily gains, not weekly or monthly ones.
Q: Dear PR,
It's an honor that you not only answer all my questions, but also put them in the Alert.
The market just unfold exactly as your analysis.
I hate to bother you, but I do have one question about USD index.
Since you are bullish on usd index, does that suggest euro/usd will go below 1.0 (once usd goes up to, for example ~110)?
Maybe in the second half of 2020?
Sincerely,
KC
A: Thank you, KC. Don't worry, you're not bothering me - I'm happy to explain as the odds are that many other are also wondering about something, but are not asking the questions. The questions are helpful, because they help me to better write the analyses. I've been tracking this market, investigating various intermarket and intramarket relationships for many years and what is obvious and familiar to me, may not be obvious and familiar to others. Thanks to questions, I'm always reminded to explain more.
In short, yes. I do expect the EUR/USD to go below 1. In fact, even the levels below 0.9 are not out of the question as far as the final bottom is concerned (with the USDX at about 120 or so).
Summary
Summing up, it seems that the precious metals sector just topped (possibly along with the general stock market) just as we had indicated previously. It also seems that we were able to close our previous long position in gold and increase the size of the short position in miners very close to the final highs.
This might be the beginning of a decline that takes the PMs to their final lows. The time target for the final lows in the precious metals sector is the second half of April.
This rally might have made one feel bullish - after all, the prices of miners seem to have recovered to a large extent. Please be sure to keep in mind that what we saw, was the first big wave down of a much bigger move lower, also in the stock market. The coronavirus stock-market decline has likely just begun and once it continues - and as the rally in the USD Index resumes - the precious metals market is likely to suffer. Silver and miners are likely to be hit particularly hard.
The real panic on the US stock market will begin when people start dying from Covid-19 in the US in thousands per day. It might peak when the death toll is in hundreds of thousands per day. We hate to be right on this prediction, but we expect the number of the total confirmed cases in the US to be multiple times greater than the analogous number in China. At the moment of writing these words, the number of total confirmed cases in the US is about 400k. The US death toll is about 13k today (increased by about 2k since yesterday, which means that the death count significantly accelerated).
It's 2008 on steroids.
Most importantly - stay healthy and safe. We're making a lot of money on these price moves (and we'll likely make much more in the following weeks and months), but you have to be healthy to really enjoy the results.
By the way, we recently opened a possibility to extend one's subscription for a year with a 10% discount in the yearly subscription fee (the profits that you took have probably covered decades of subscription fees...). It also applies to our All-Inclusive Package (if you didn't know - we just made huge gains shorting crude oil and are also making money on both the decline and temporary rebound in stocks). The boring time in the PMs is over and the time to pay close attention to the market is here - it might be a good idea to secure more access while saving 10% at the same time.
Important: If your subscription got renewed recently, but you'd like to secure more access at a discount - please let us know, we'll make sure that the discount applies right away, while it's still active. Moreover, please note that you can secure more access than a year - if you secured a yearly access, and add more years to your subscription, each following year will be rewarded with an additional 10% discount (20% discount total). We would apply this discount manually - please contact us for details.
Secure more access at a discount.
As always, we'll keep you - our subscribers - informed.
To summarize:
Trading capital (supplementary part of the portfolio; our opinion): Full speculative short positions (250% of the full position) in mining stocks is justified from the risk to reward point of view with the following binding exit profit-take price levels:
Senior mining stocks (price levels for the GDX ETF): binding profit-take exit price: $10.32; stop-loss: none (the volatility is too big to justify a SL order in case of this particular trade); binding profit-take level for the DUST ETF: $11.47; stop-loss for the DUST ETF: none (the volatility is too big to justify a SL order in case of this particular trade)
Junior mining stocks (price levels for the GDXJ ETF): binding profit-take exit price: $9.57; stop-loss: none (the volatility is too big to justify a SL order in case of this particular trade); binding profit-take level for the JDST ETF: $14.87; stop-loss for the JDST ETF: none (the volatility is too big to justify a SL order in case of this particular trade)
For-your-information targets (our opinion; we continue to think that mining stocks are the preferred way of taking advantage of the upcoming price move, but if for whatever reason one wants / has to use silver or gold for this trade, we are providing the details anyway. In our view, silver has greater potential than gold does):
Silver futures downside profit-take exit price: $8.58
Gold futures downside profit-take exit price: $1,312 (the target for gold is least clear; it might drop to even $1,170 or so)
Long-term capital (core part of the portfolio; our opinion): No positions (in other words: cash)
Insurance capital (core part of the portfolio; our opinion): Full position
Whether you already subscribed or not, we encourage you to find out how to make the most of our alerts and read our replies to the most common alert-and-gold-trading-related-questions.
Please note that the in the trading section we describe the situation for the day that the alert is posted. In other words, it we are writing about a speculative position, it means that it is up-to-date on the day it was posted. We are also featuring the initial target prices, so that you can decide whether keeping a position on a given day is something that is in tune with your approach (some moves are too small for medium-term traders and some might appear too big for day-traders).
Plus, you might want to read why our stop-loss orders are usually relatively far from the current price.
Please note that a full position doesn't mean using all of the capital for a given trade. You will find details on our thoughts on gold portfolio structuring in the Key Insights section on our website.
As a reminder - "initial target price" means exactly that - an "initial" one, it's not a price level at which we suggest closing positions. If this becomes the case (like it did in the previous trade) we will refer to these levels as levels of exit orders (exactly as we've done previously). Stop-loss levels, however, are naturally not "initial", but something that, in our opinion, might be entered as an order.
Since it is impossible to synchronize target prices and stop-loss levels for all the ETFs and ETNs with the main markets that we provide these levels for (gold, silver and mining stocks - the GDX ETF), the stop-loss levels and target prices for other ETNs and ETF (among other: UGLD, DGLD, USLV, DSLV, NUGT, DUST, JNUG, JDST) are provided as supplementary, and not as "final". This means that if a stop-loss or a target level is reached for any of the "additional instruments" (DGLD for instance), but not for the "main instrument" (gold in this case), we will view positions in both gold and DGLD as still open and the stop-loss for DGLD would have to be moved lower. On the other hand, if gold moves to a stop-loss level but DGLD doesn't, then we will view both positions (in gold and DGLD) as closed. In other words, since it's not possible to be 100% certain that each related instrument moves to a given level when the underlying instrument does, we can't provide levels that would be binding. The levels that we do provide are our best estimate of the levels that will correspond to the levels in the underlying assets, but it will be the underlying assets that one will need to focus on regarding the signs pointing to closing a given position or keeping it open. We might adjust the levels in the "additional instruments" without adjusting the levels in the "main instruments", which will simply mean that we have improved our estimation of these levels, not that we changed our outlook on the markets. We are already working on a tool that would update these levels on a daily basis for the most popular ETFs, ETNs and individual mining stocks.
Our preferred ways to invest in and to trade gold along with the reasoning can be found in the how to buy gold section. Additionally, our preferred ETFs and ETNs can be found in our Gold & Silver ETF Ranking.
As a reminder, Gold & Silver Trading Alerts are posted before or on each trading day (we usually post them before the opening bell, but we don't promise doing that each day). If there's anything urgent, we will send you an additional small alert before posting the main one.
Thank you.
Sincerely,
Przemyslaw Radomski, CFA
Editor-in-chief, Gold & Silver Fund Manager

