

Briefly: in our opinion, full (250% of the regular size of the position) speculative short position in gold, silver, and mining stocks is justified from the risk/reward perspective at the moment of publishing this Alert.
Some things change, and some things don’t. On the precious metals market and the related ones, we currently have both. There are trends that were unaffected by last week’s developments, but there are certain markets that made powerful moves and flashed important signals. And in order to correctly determine the next direction for gold, silver, and mining stocks, we will examine all of them.
Let’s start with action, leaving the stable trends for later. The key action took place in the currency market. The view is clearest in case of the euro.
The USD’s Strong Performance
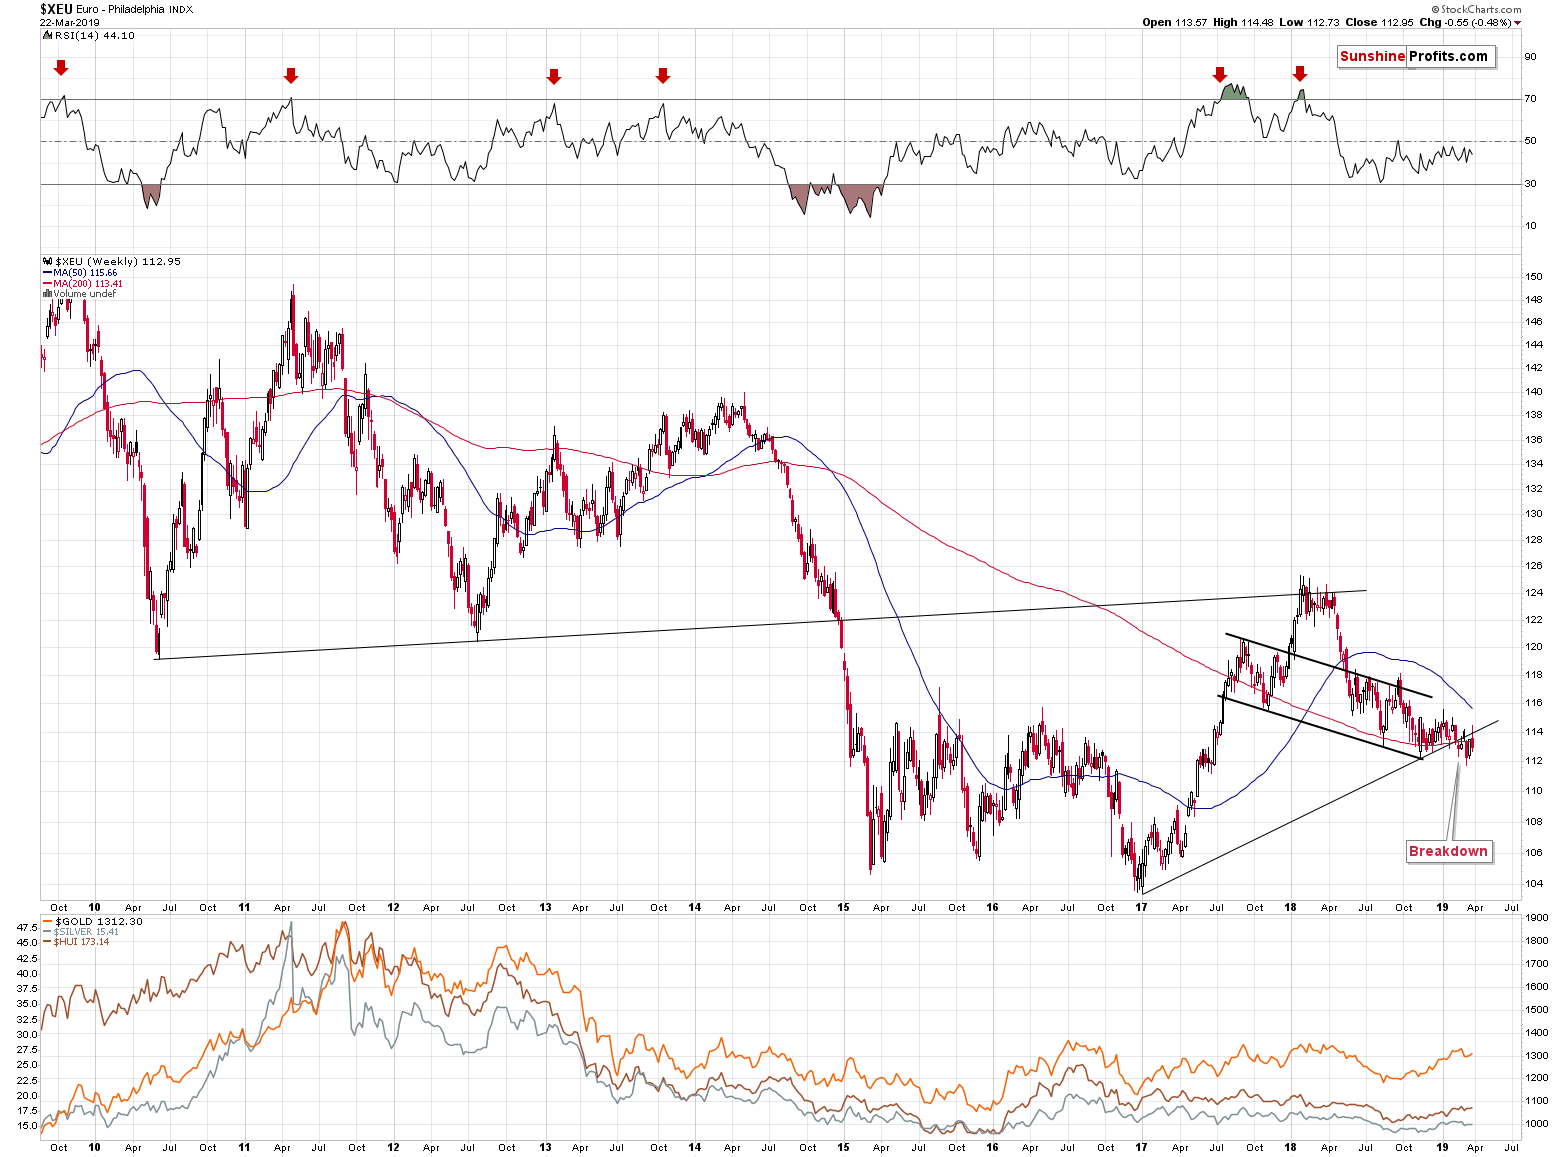
Last week, the European currency moved initially above the rising, medium-term resistance line and it ultimately failed in a profound way. Instead of a decisive comeback above the line, we saw a weekly reversal and an invalidation of the small breakout. This is practically as bearish as it gets and our short positions in the euro greatly benefited from the above.
The EUR/USD currency pair was not the only one that reversed last week.
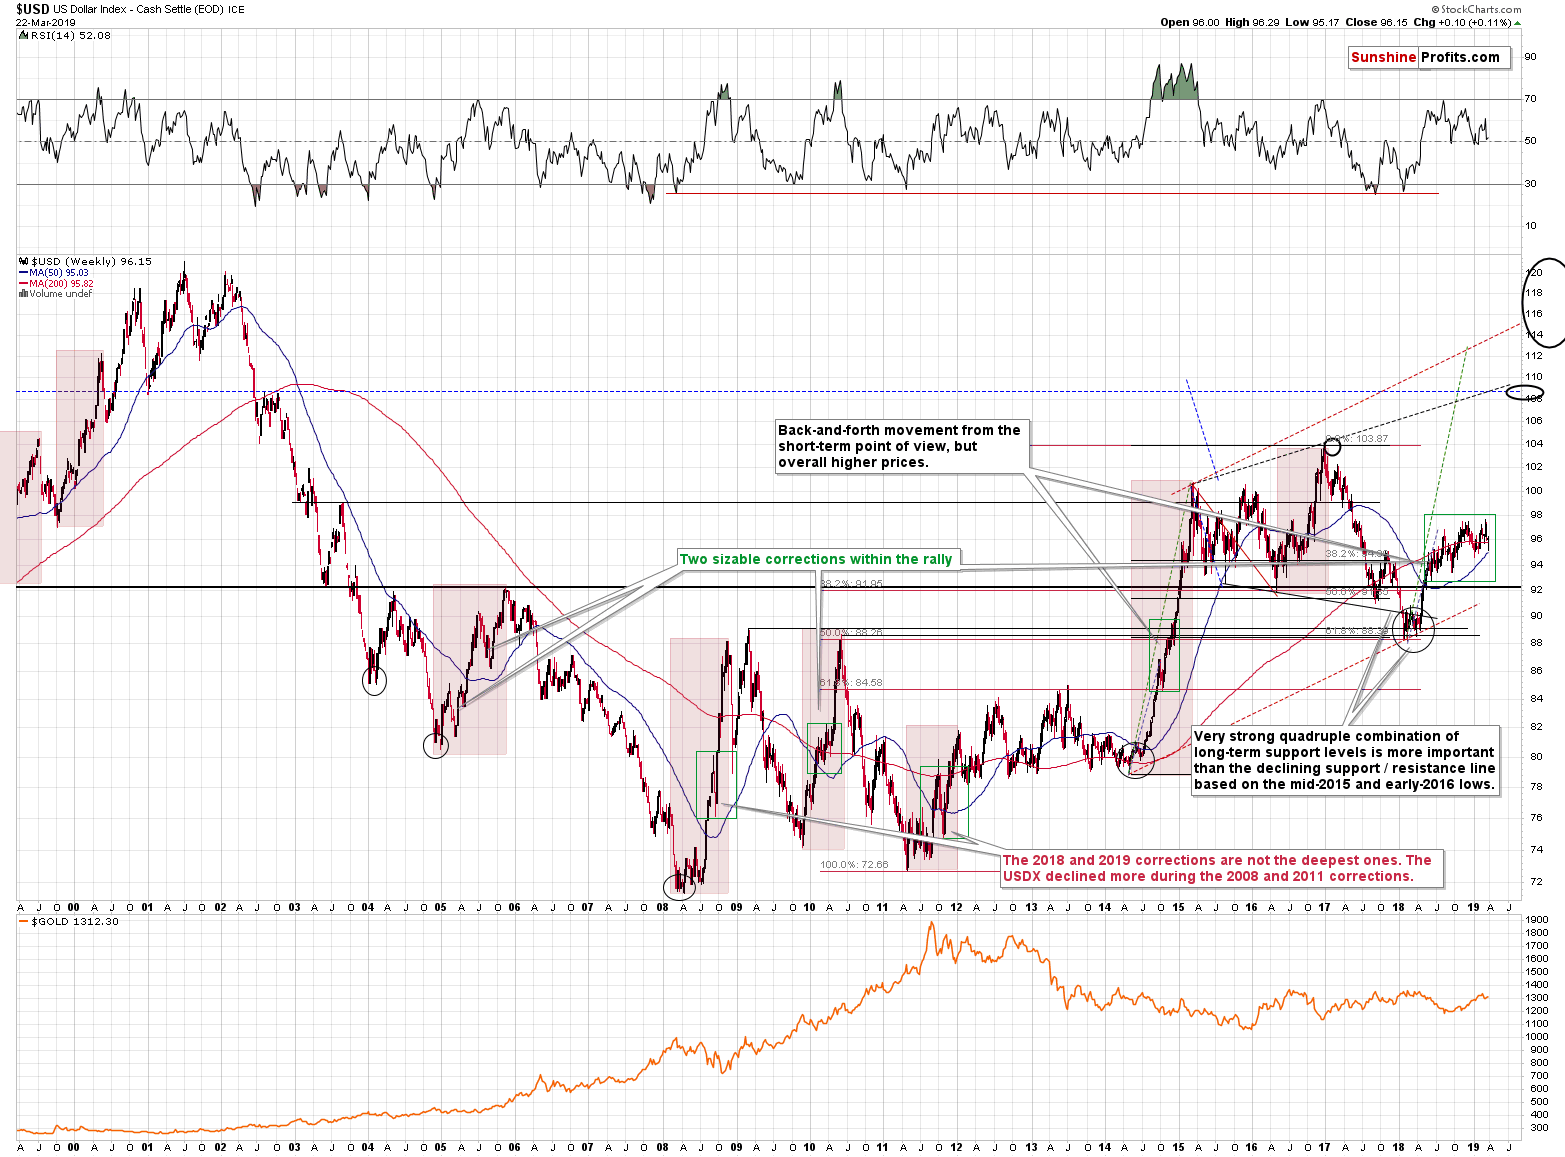
The USD Index formed a bullish reversal and despite the mid-week Fed-induced decline, it ended the week 0.10 higher. This may not seem like much, but the fact that the US currency managed to rally at all instead of sharply plunging is astonishing. The Fed changed its course from hawkish to almost neutral, which was critically bearish for the US dollar.
Lowering or increasing by fewer percentage points or increasing the interest rates later, means that the USD is less valuable as a currency. The interest rates are the benefit that one may gain by owning a given currency. If there’s less to gain, the currency itself should be less valuable. There’s more to the interest rate – currency valuation link than just that, but the above is enough to explain why the USDX should have declined last week. Investors were expecting more interest rate hikes in the near future and they were informed that the rates will not be increased this year. Also, Fed has made the decision to first taper and later to end its balance sheet normalization (aka quantitative tightening). This was a bearish surprise, so the USDX should have declined, and since the change was profound, it should have declined profoundly. And it ended the week on a positive note. This is an extremely bullish sign for the following weeks.
The action that we saw last week was the bullish sign for the US dollar. The implications for the precious metals market are bearish.
What about the things that didn’t really change? Let’s start with the big picture.
360-Degree Overview of Gold
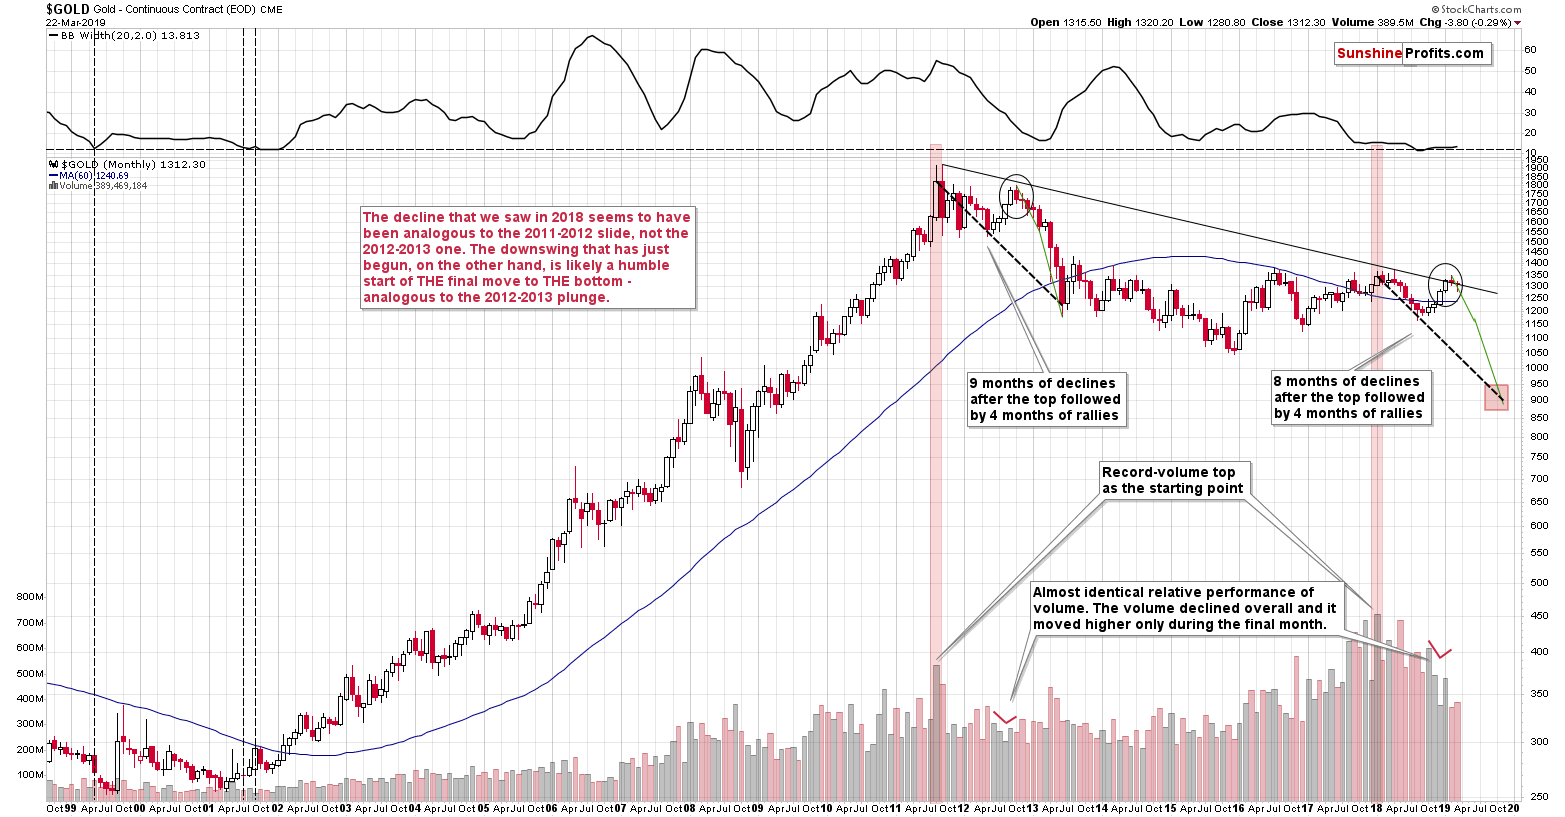
As we can see on the above monthly gold chart, last week’s action didn’t change much with regard to the 2012-2013 – now link. On the short-term note, it made the short-term stop at $1,260 less likely, but from the broad perspective, we see that nothing really changed. The move higher was not significant enough to change the link between now and late 2012.
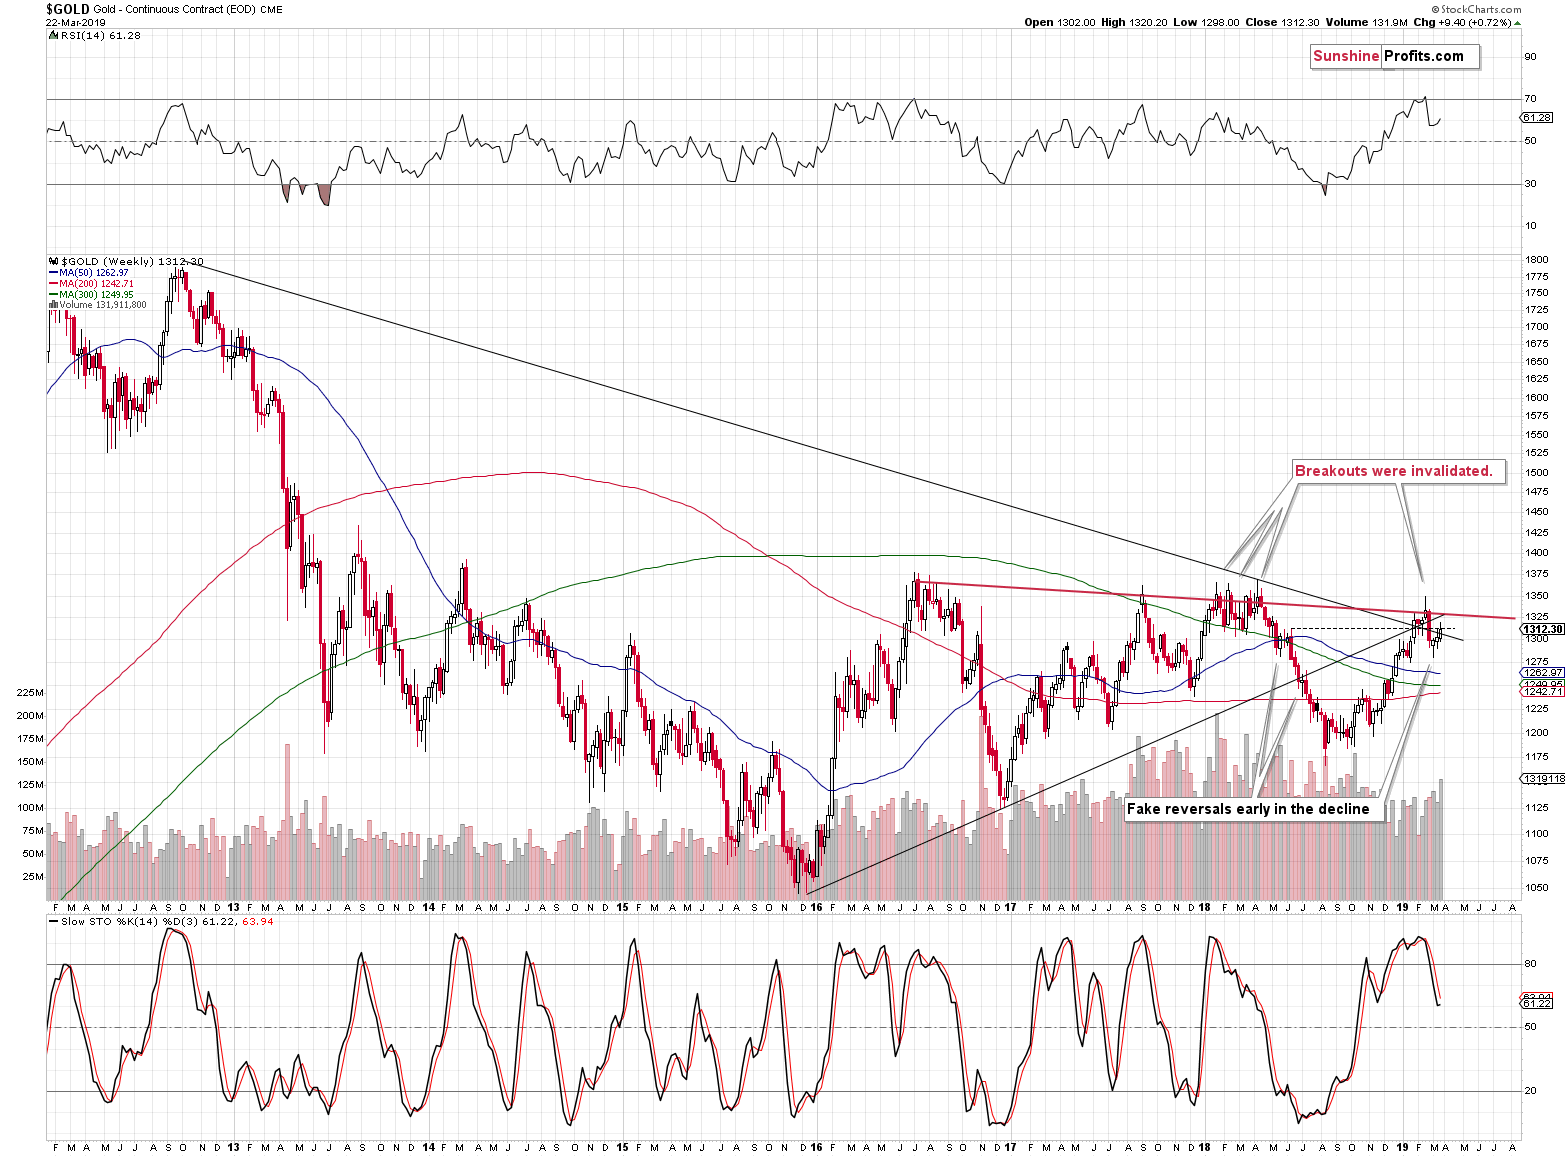
Remaining in the long-term realm but zooming in a bit and focusing on weekly price changes shows a bearish indication. While gold didn’t erase most of its weekly gains, we’ve seen a kind of reversal before the end of the week. Last week’s volume was very high – highest in months. When high volume accompanies a reversal, it confirms its nature and makes the signal much stronger. January 2018 shows that in practice. The weekly reversal in January 2018 was similar in terms of price changes to the one that we saw last week. This time the volume was not as big, but it was big on a relative basis, so we can say that both sessions were similar. The January 2018 reversal ended the preceding rally, so the implications of last week’s candlestick are bearish as well.
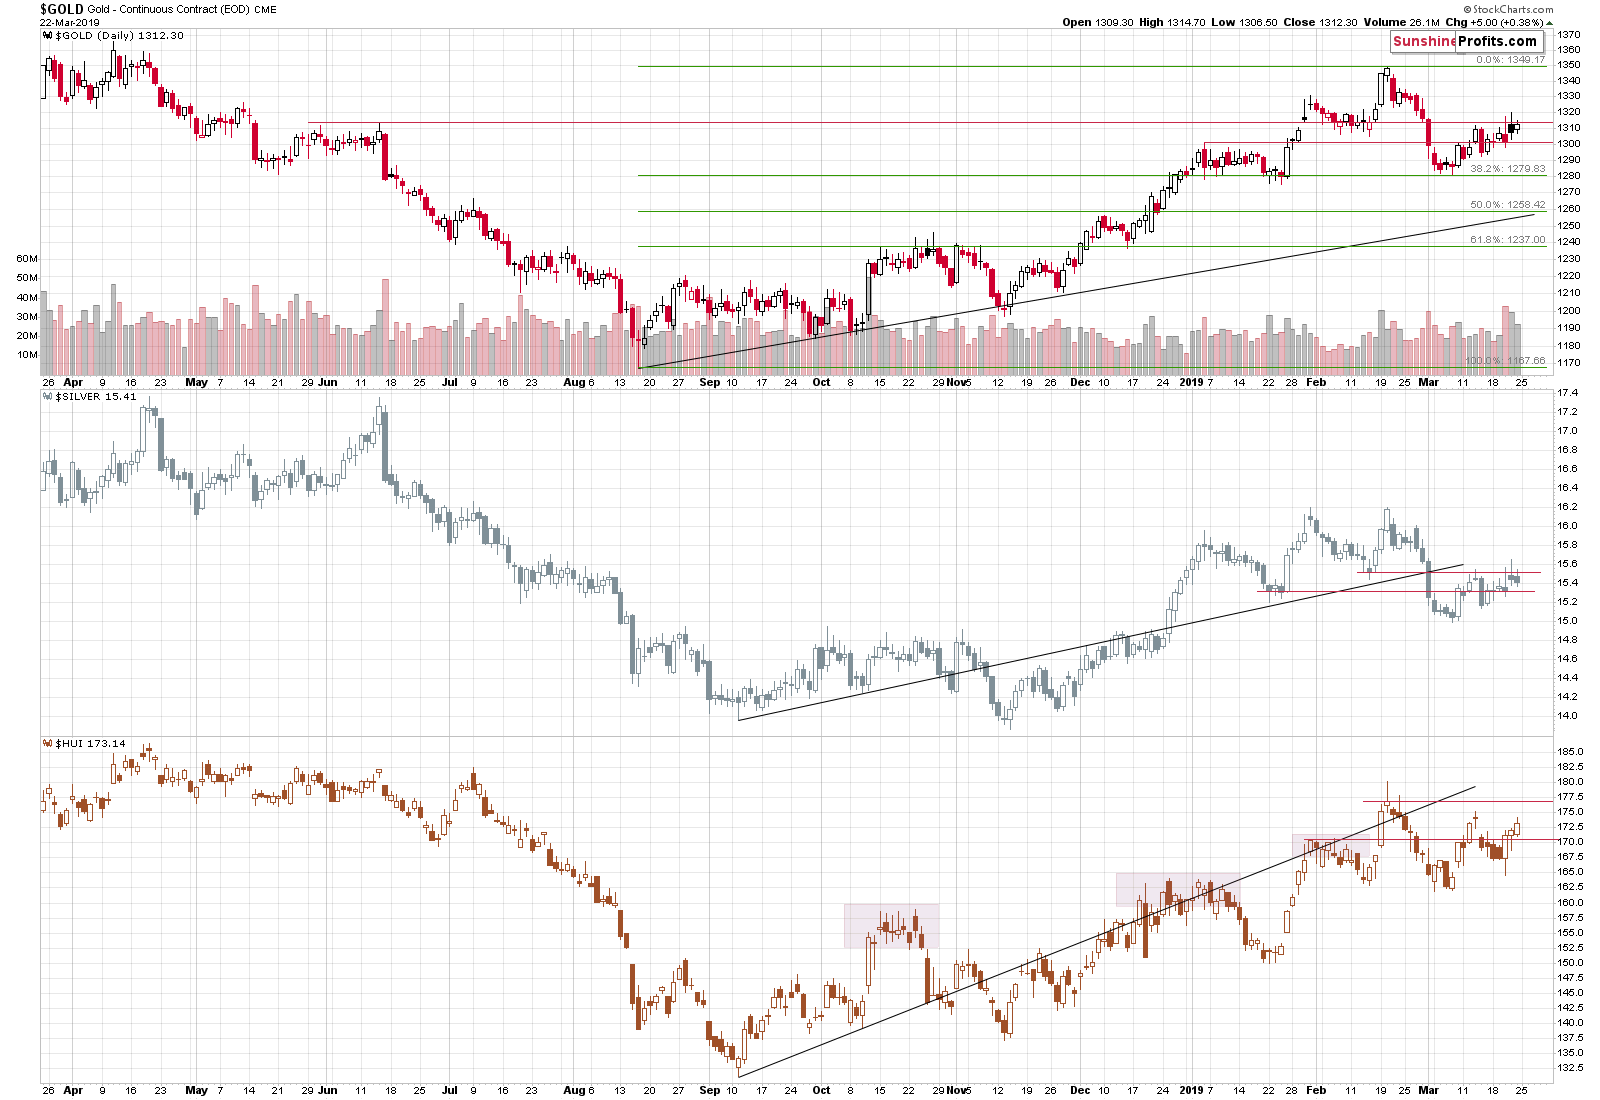
As far as the daily price moves are concerned, nothing really changed. Gold and gold miners moved a bit higher and silver moved a bit lower. None of them broke above or below any important support or resistance level, so technically nothing really happened.
There may be two questions regarding the relative performance here, so we will address them.
The first issue is why didn’t gold decline last week, even though USD moved higher, and the second issue is the last few days of gold miners’ outperformance of gold.
Gold’s Resilience Last Week & Miners’ Outperformance Explained
Beginning with the former, the gold-USD link doesn’t provide really meaningful signals if there is a clear factor that influences both: gold and the US dollar. The whole point of the gold-USD analysis is to check when gold reacts to one of its major drivers in the appropriate way. If it reacts less than it should, it tells us that gold may not really want to move in a certain way. But, if it wasn’t USD to which gold was actually reacting, but there was something else that drove its price, then the discussion of the gold-USD link becomes rather pointless. Instead, we should focus on the thing that was the true trigger of price moves and estimate gold’s reaction relative to it. It’s usually the case that the gold-USD link is disrupted by something related to the EU as the EUR/USD currency pair influences the USD Index to such a great extent. This time it was the Fed’s shocker that was the most likely reason for last week’s price moves. The key question, therefore, is not whether gold moved strongly relative to the US dollar, but whether it moved adequately with regard to the Fed announcement. And gold’s reaction was very weak, which means that the implications are bearish.
As far as miners’ outperformance is concerned, please note that it’s only a very short-term phenomenon that doesn’t change anything from the medium-term point of view.
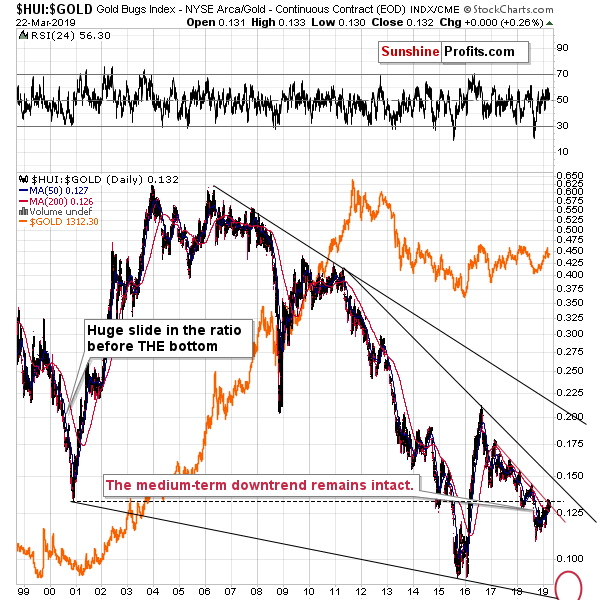
Looking at the last 20 years of the HUI to gold ratio performance, it’s clear that the trend has been down since about 2006. In particular, the stable downtrend started in 2011 after gold topped. The 2016 rally was an exception that was followed by decline’s continuation. The miners to gold ratio moved a bit higher this year, but it appears to be nothing more than just a counter-trend rally, just like several similar rallies in 2017 and 2018. The downtrend remains in place. This means that another short-term decline that takes the ratio below the 2018 low appears to be just around the corner.
And it may be starting right now.
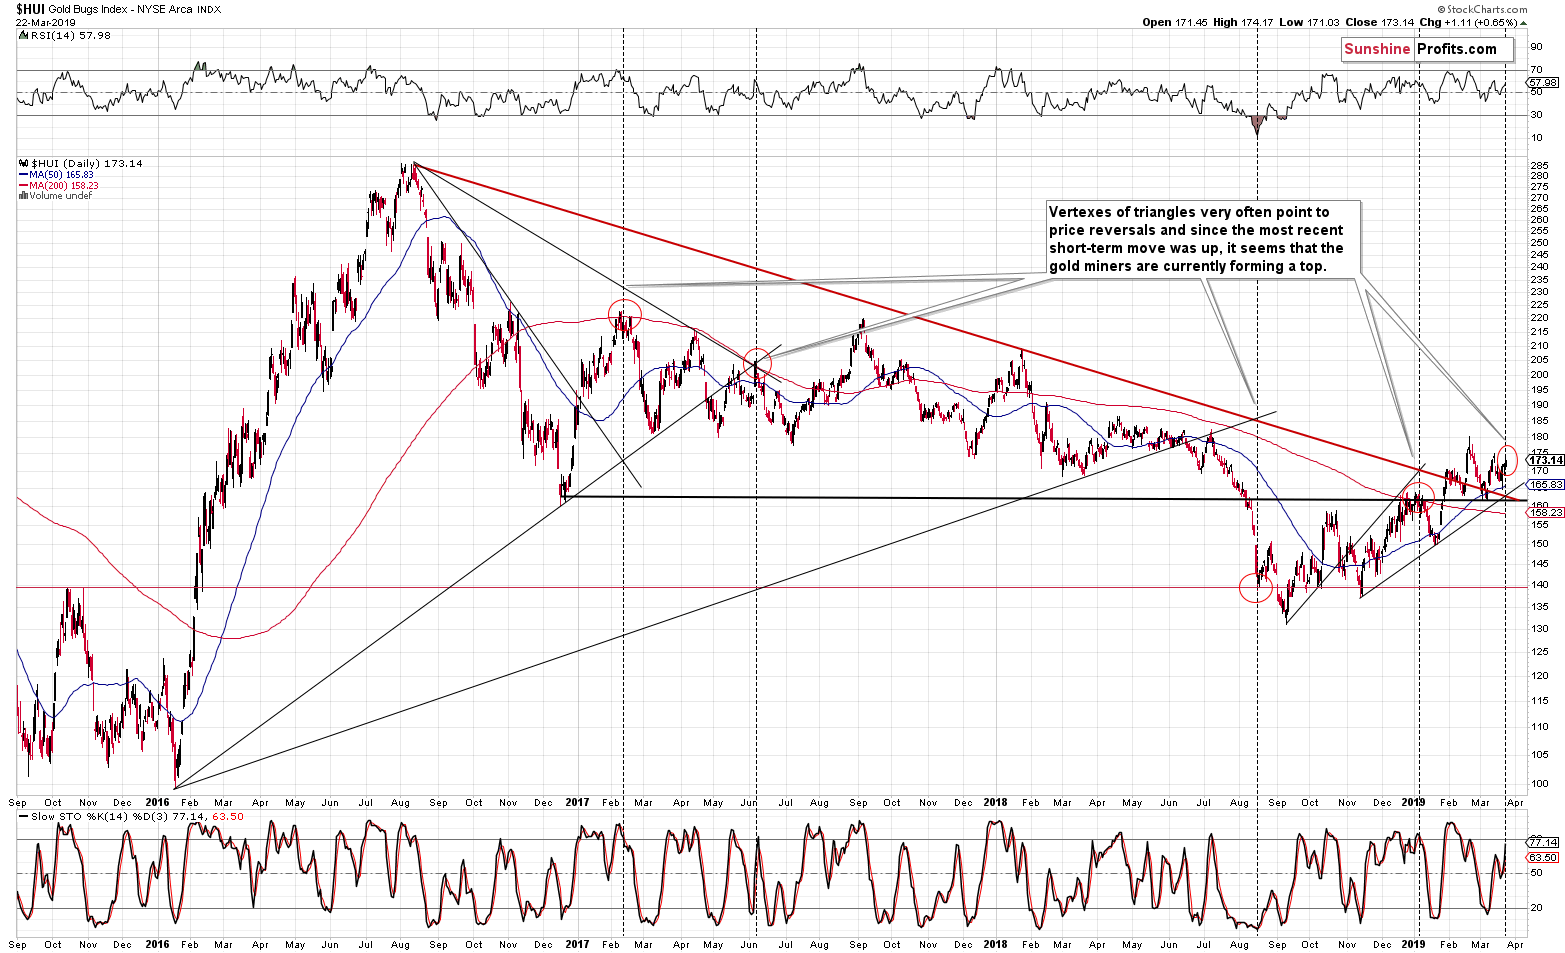
The above chart shows the triangle-vertex-based reversals that we applied to the HUI Index. The technique has been very useful in the previous months and years and we marked some of the reversals that were correctly indicated. Right now, we have yet another vertex that’s based on the rising support line based on the November 2018 and January 2019 bottoms and the declining red resistance line. The most recent short-term move was up, so the reversal implies a local top. The situation in the USD Index and gold’s very weak reaction to Fed’s announcement clearly confirm this bearish outlook for the mining stocks.
Before summarizing, there’s one more thing that absolutely didn’t change based on last week’s developments.
Updating the Gold-Silver Ratio
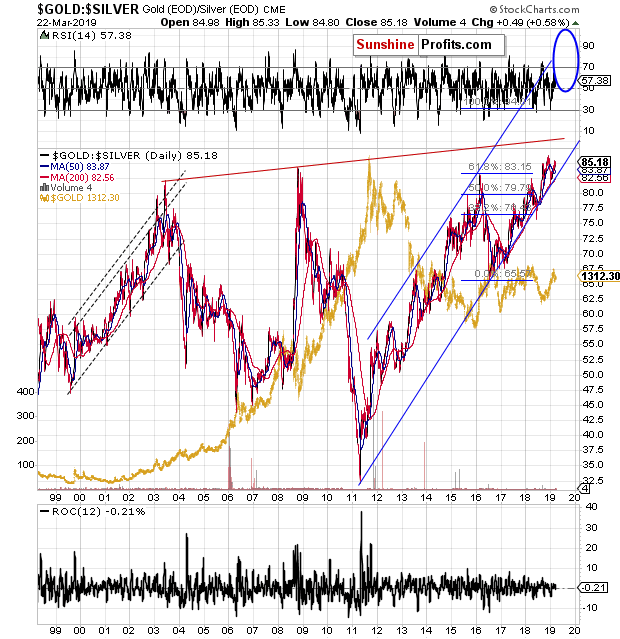
Gold ended last week as a metal that’s more than 85 times as expensive than silver, which means that the ratio confirmed the breakout above the previous long-term highs. The previous attempts of the ratio to move above the 85 level failed quickly and were followed by the move below 80. But not this time. After a quick pullback, the ratio rallied once again and now stays strongly above the previous highs. This is something that we have not seen in the past 20 years – a true breakout. The real long-term resistance level that’s extremely strong is 100. We expect the ratio to move to it when the precious metals market forms its true bottom.
Summary
Summing up, it’s almost certain that the next big move lower has already begun and that the 2013-like slide is in its early stage. Based on the updated version of the 2013-now link, the implications are even more bearish than we had initially assumed. The downside target for gold remains intact ($890), and the corrective upswing that we just saw seems to be rather natural part of the bigger move lower – not a beginning of an important move higher. And it seems that the corrective move higher in the PMs is either over or about to be over shortly. Gold’s very weak reaction to Fed’s surprisingly dovish remarks strongly confirms the bearish outlook for the following weeks.
As we explained on Friday, if gold declines to $1,240, this might be an opportunity to go long, but it’s too early to say for sure at this time.
To summarize:
Trading capital (supplementary part of the portfolio; our opinion): Full short position (250% of the full position) in gold, silver, and mining stocks is justified from the risk/reward perspective with the following stop-loss orders and exit profit-take price levels:
- Gold: profit-take exit price: $1,062; stop-loss: $1,357; initial target price for the DGLD ETN: $82.96; stop-loss for the DGLD ETN $39.87
- Silver: profit-take exit price: $12.32; stop-loss: $16.44; initial target price for the DSLV ETN: $47.67; stop-loss for the DSLV ETN $23.68
- Mining stocks (price levels for the GDX ETF): profit-take exit price: $13.12; stop-loss: $24.17; initial target price for the DUST ETF: $76.87; stop-loss for the DUST ETF $15.47
Note: the above is a specific preparation for a possible sudden price drop, it does not reflect the most likely outcome. You will find a more detailed explanation in our August 1st Alert. In case one wants to bet on junior mining stocks’ prices (we do not suggest doing so – we think senior mining stocks are more predictable in the case of short-term trades – if one wants to do it anyway, we provide the details), here are the stop-loss details and target prices:
- GDXJ ETF: profit-take exit price: $17.52; stop-loss: $35.67
- JDST ETF: initial target price: $143.87 stop-loss: $30.97
Long-term capital (core part of the portfolio; our opinion): No positions (in other words: cash)
Insurance capital (core part of the portfolio; our opinion): Full position
Important Details for New Subscribers
Whether you already subscribed or not, we encourage you to find out how to make the most of our alerts and read our replies to the most common alert-and-gold-trading-related-questions.
Please note that the in the trading section we describe the situation for the day that the alert is posted. In other words, it we are writing about a speculative position, it means that it is up-to-date on the day it was posted. We are also featuring the initial target prices, so that you can decide whether keeping a position on a given day is something that is in tune with your approach (some moves are too small for medium-term traders and some might appear too big for day-traders).
Plus, you might want to read why our stop-loss orders are usually relatively far from the current price.
Please note that a full position doesn’t mean using all of the capital for a given trade. You will find details on our thoughts on gold portfolio structuring in the Key Insights section on our website.
As a reminder – “initial target price” means exactly that – an “initial” one, it’s not a price level at which we suggest closing positions. If this becomes the case (like it did in the previous trade) we will refer to these levels as levels of exit orders (exactly as we’ve done previously). Stop-loss levels, however, are naturally not “initial”, but something that, in our opinion, might be entered as an order.
Since it is impossible to synchronize target prices and stop-loss levels for all the ETFs and ETNs with the main markets that we provide these levels for (gold, silver and mining stocks – the GDX ETF), the stop-loss levels and target prices for other ETNs and ETF (among other: UGLD, DGLD, USLV, DSLV, NUGT, DUST, JNUG, JDST) are provided as supplementary, and not as “final”. This means that if a stop-loss or a target level is reached for any of the “additional instruments” (DGLD for instance), but not for the “main instrument” (gold in this case), we will view positions in both gold and DGLD as still open and the stop-loss for DGLD would have to be moved lower. On the other hand, if gold moves to a stop-loss level but DGLD doesn’t, then we will view both positions (in gold and DGLD) as closed. In other words, since it’s not possible to be 100% certain that each related instrument moves to a given level when the underlying instrument does, we can’t provide levels that would be binding. The levels that we do provide are our best estimate of the levels that will correspond to the levels in the underlying assets, but it will be the underlying assets that one will need to focus on regarding the signs pointing to closing a given position or keeping it open. We might adjust the levels in the “additional instruments” without adjusting the levels in the “main instruments”, which will simply mean that we have improved our estimation of these levels, not that we changed our outlook on the markets. We are already working on a tool that would update these levels on a daily basis for the most popular ETFs, ETNs and individual mining stocks.
Our preferred ways to invest in and to trade gold along with the reasoning can be found in the how to buy gold section. Additionally, our preferred ETFs and ETNs can be found in our Gold & Silver ETF Ranking.
As a reminder, Gold & Silver Trading Alerts are posted before or on each trading day (we usually post them before the opening bell, but we don't promise doing that each day). If there's anything urgent, we will send you an additional small alert before posting the main one.
=====
Latest Free Trading Alerts:
Friday's trading session was bearish, as stocks retraced their Thursday's advance and continued lower ahead of the weekend. The S&P 500 index was the highest since the early October on Thursday. So was the Friday's sell-off a medium-term downward reversal or still just a correction?
Friday's Sell-Off - New Downtrend or Just Correction?
After the Fed’s surprise move, the dust is getting settled. We are seeing serious reprising across many currency pairs. Sharp movements practically anywhere you look today. Where to start? With the euro, the yen or the Canadian dollar? It’s hard to choose the winner among all the moves in our favor. Let’s shine more light into every pair covered so that you are as prepared for what lies ahead as we are. Our subscribers already are.
Risk Aversion Rules the Day: Which Currency Pairs Stand to Benefit?
=====
Thank you.
Sincerely,
Przemyslaw Radomski, CFA
Editor-in-chief, Gold & Silver Fund Manager

