

Briefly: in our opinion, full (250% of the regular size of the position) speculative short position in gold, silver, and mining stocks is justified from the risk/reward perspective at the moment of publishing this Alert.
Yesterday, we asked here the question how much gold could (should) have risen based on such bullish news as the Fed’s monetary policy turnaround. One day later, how far has gold progressed? If not rising sharply on account of this, can the gold bulls use any other ace up their sleeves? Provided that they have any actually. Let’s see in detail what the current situation most likely means for the precious metals going forward.
In yesterday’s Alert, we wrote that gold’s and silver’s reaction to the dramatic shift in Fed’s policy was actually very weak and it was a bearish signal on its own. What we saw yesterday only confirmed this. More than 24 hours after the Fed’s decision we know that the entire world had a good chance to react to this news. All the exchanges were opened in the meantime and people were able to place their trades. And what happened? Gold moved initially higher in yesterday’s pre-market trading only to slide lower during the session. At this time, gold is trading a bit below Wednesday’s closing price. The Fed-induced rally may be, and in fact likely is, over.
The Proper Perspective of the Fed Aftermath
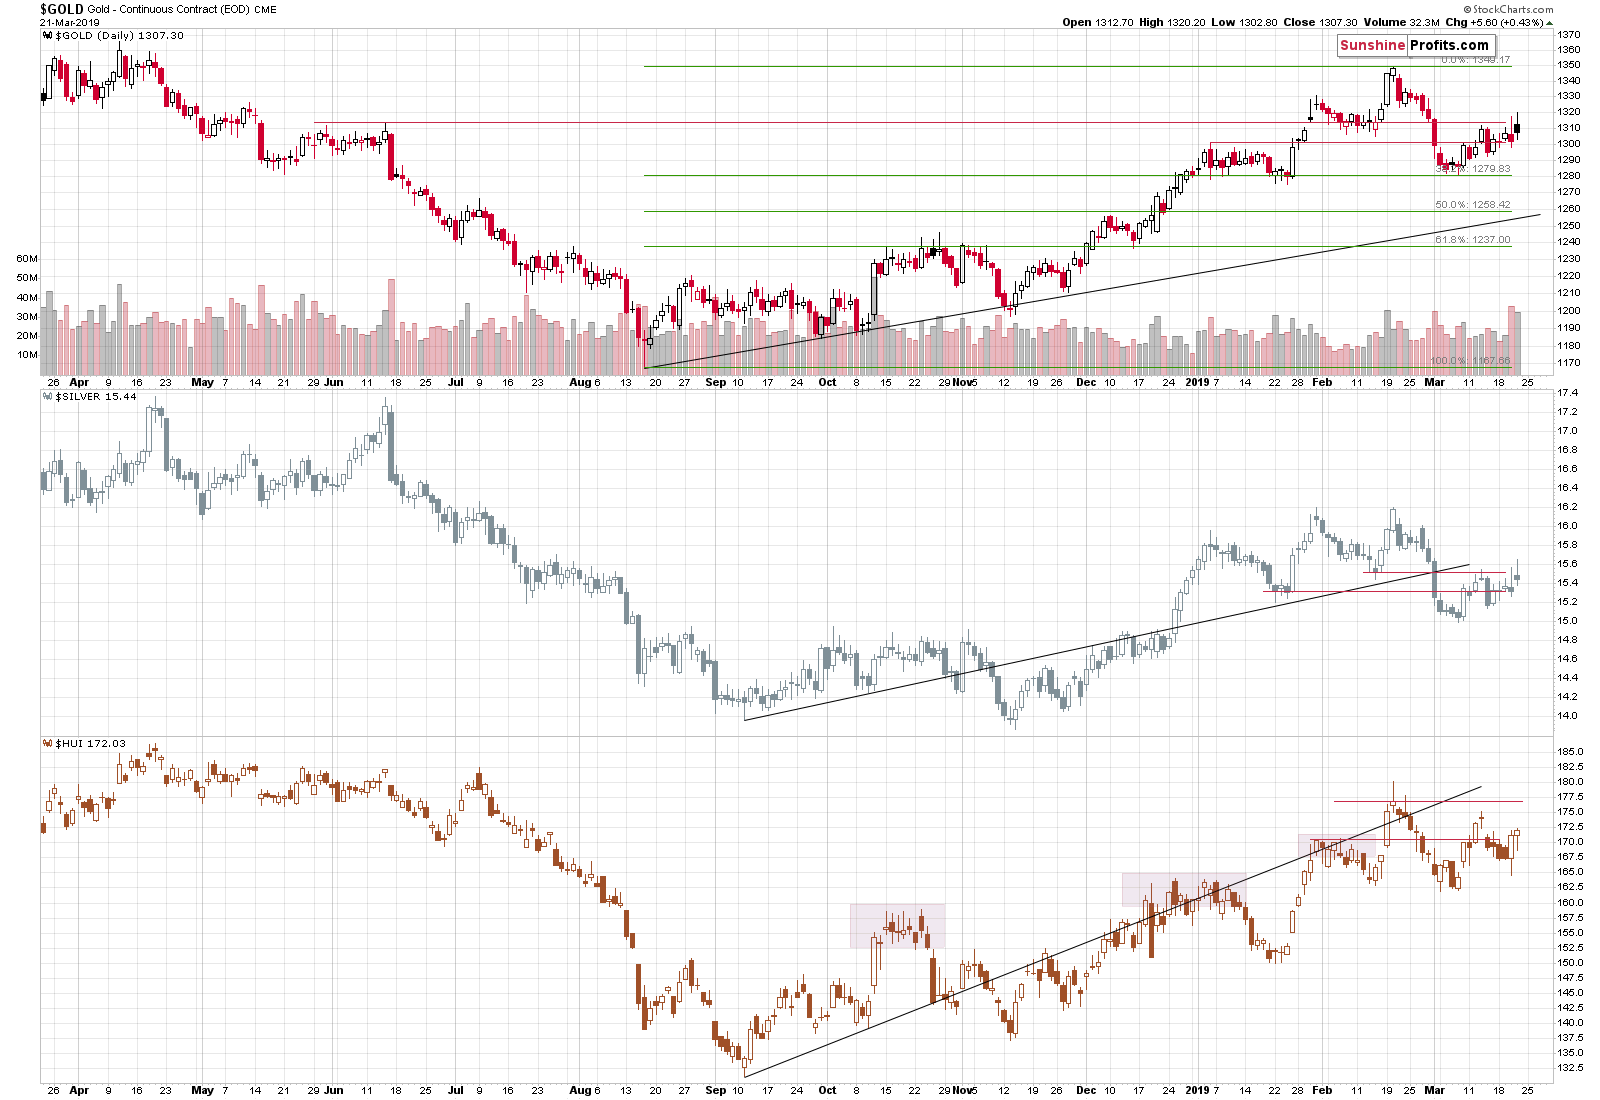
Gold and silver have both reversed yesterday, while the miners moved only insignificantly higher. The big-volume reversal in gold is a technical bearish sign, which perfectly confirms our initial assessment of the situation. The PMs were about to plunge, and they were practically forced to move higher after the Fed’s shocker. The outlook remains very bearish.
If it’s not apparent based on the daily chart, let’s also consider the weekly chart.
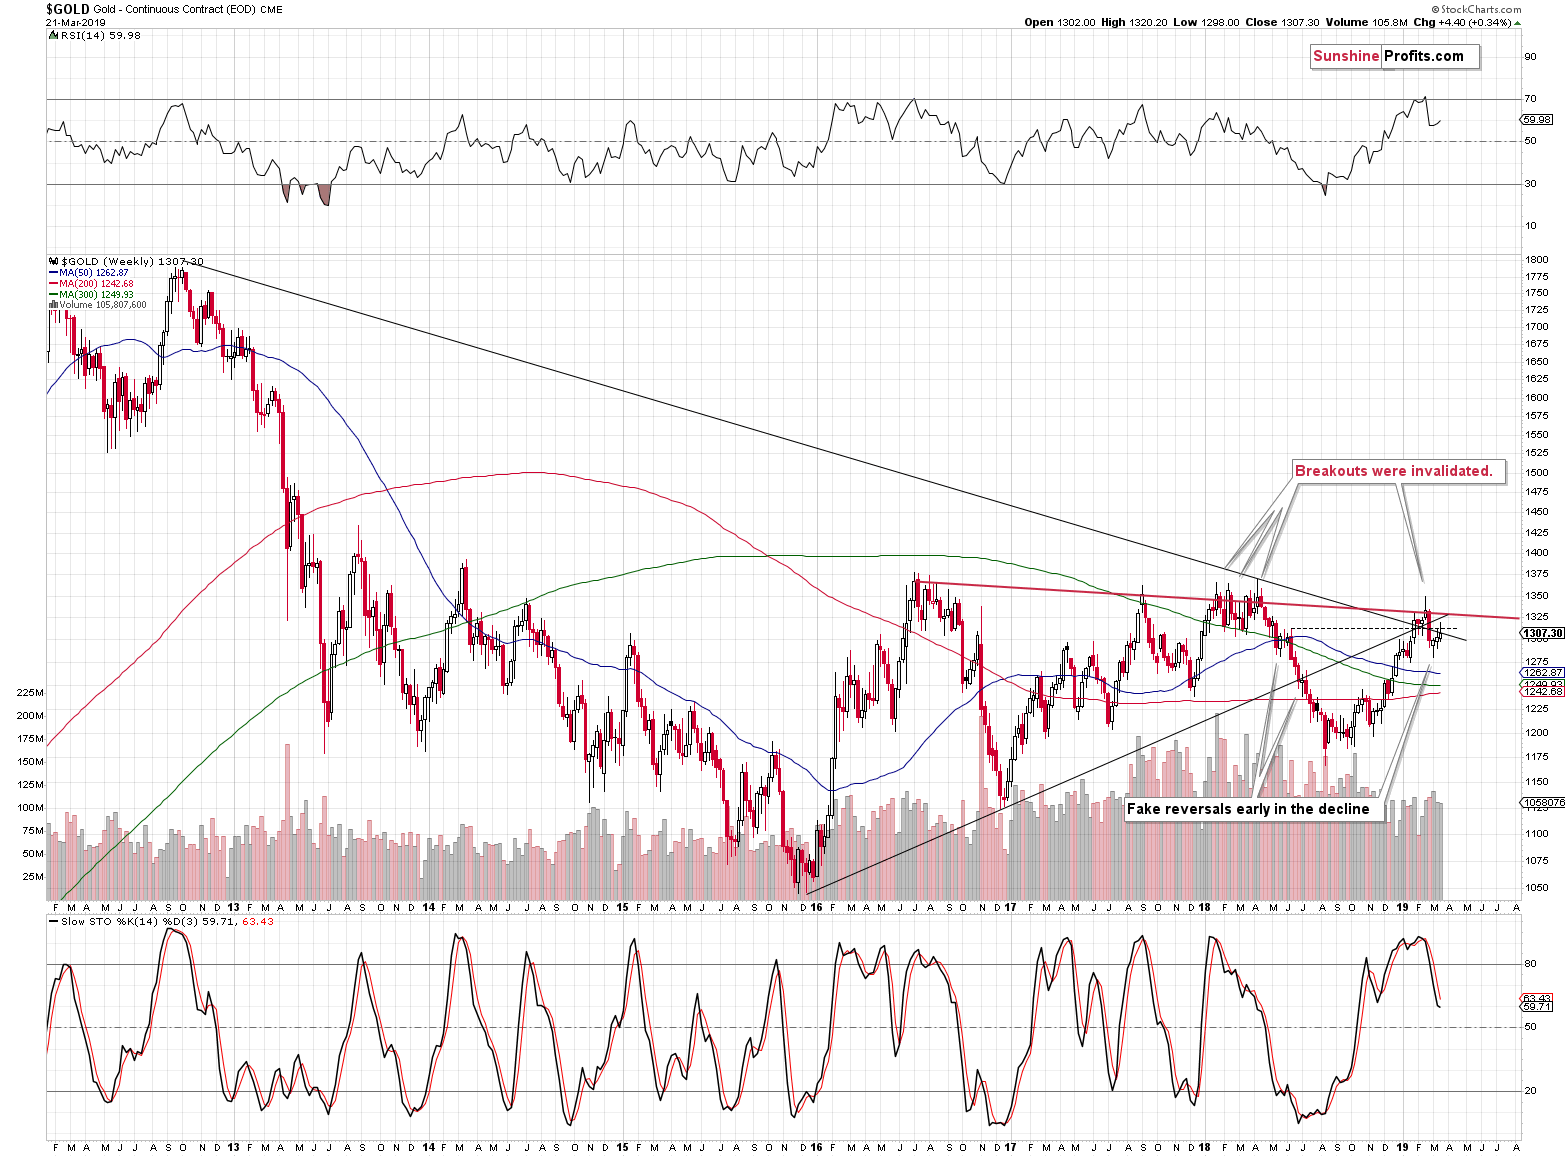
We just saw the most dovish turn on the Fed’s part this week, and gold is up by… $4.40. That looks more like a statistical error than any kind of reaction, let alone a meaningful one.
And this is all on top of the current Brexit-driven… rally? Gold soars on uncertainty and given that the Brexit deadline is just a few days away, gold should be making new highs. And gold didn’t even manage to move above the 2016, 2017, and 2018 highs earlier this year. As the deadline is approaching, gold should be rallying above the previous highs. It’s not.
And when a given market doesn’t react to news that should have caused it to rally, it’s a sign that this market wants and is about to move down. The stronger the discrepancy, the more meaningful and bearish the signal. There are two strong reasons for gold to be rallying right now, and gold’s reaction is very weak. The discrepancy is really extreme.
Before summarizing, we would like to take this opportunity to publicly reply to a question from one of our subscribers:
Do you expect there to be a precipitating factor to cause a collapse in the price of gold, or do you anticipate a gradual erosion in the price?
We think that something in between is the most likely scenario.
We don’t rule out that a sudden event could trigger or accelerate gold’s decline – for instance, if UK decides to stay in the EU after all, gold will likely either plunge or accelerate its decline.
But if we don’t get any trigger, gold is still likely to decline, initially at a slower pace, and finally in a volatile manner as investors panic. In particular, the slide below $1,000 is likely to be quick.
The reason we think something in between both scenarios is likely is that it’s impossible to tell when a market shocker might hit. And it’s also difficult to say what the market may actually regard as a shocker. Back in 2013, the gold price plunged after something as meaningless as Goldman’s bearish price forecasts. Is this really a major factor for the gold market? Opinion of one of the banks? Not really. The market really wanted to move lower and it used any trigger available to do so.
Something of only average or even little importance could be the final trigger for gold’s decline also this year. The key thing is that there are multiple technical confirmations for the decline and we just saw gold refuse to rally profoundly despite profoundly bullish fundamental news (Fed’s policy and Brexit tensions).
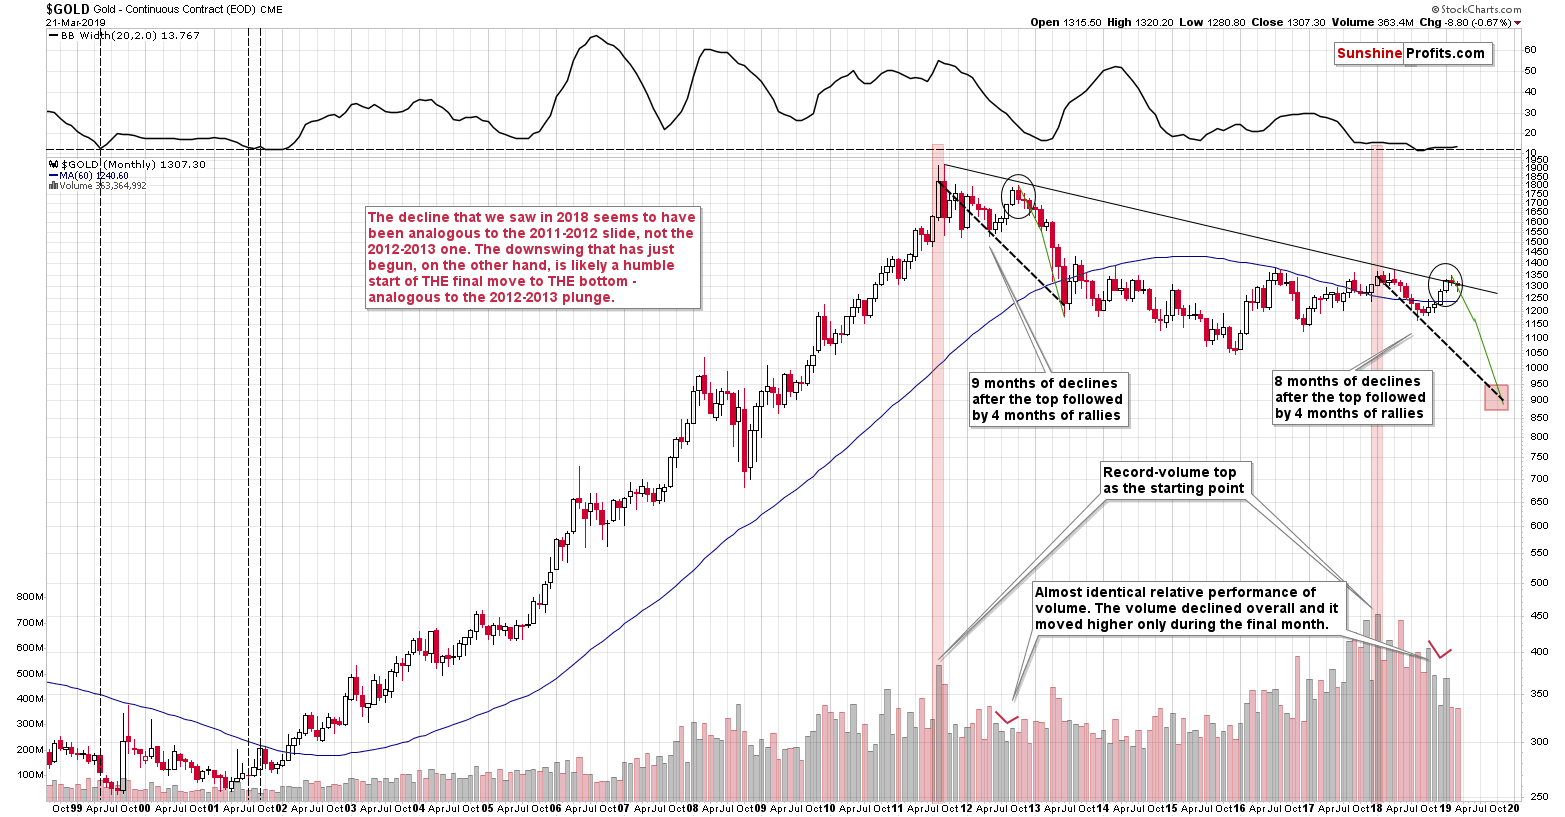
The history tends to repeat itself, so the best approximation of what have for this decline is what happened in 2012 and 2013. We discussed it in the previous Alerts, but since gold moved a bit higher since that time, it seems that an update would be welcome.
Updating the 2012-2013 – Now Link in Gold
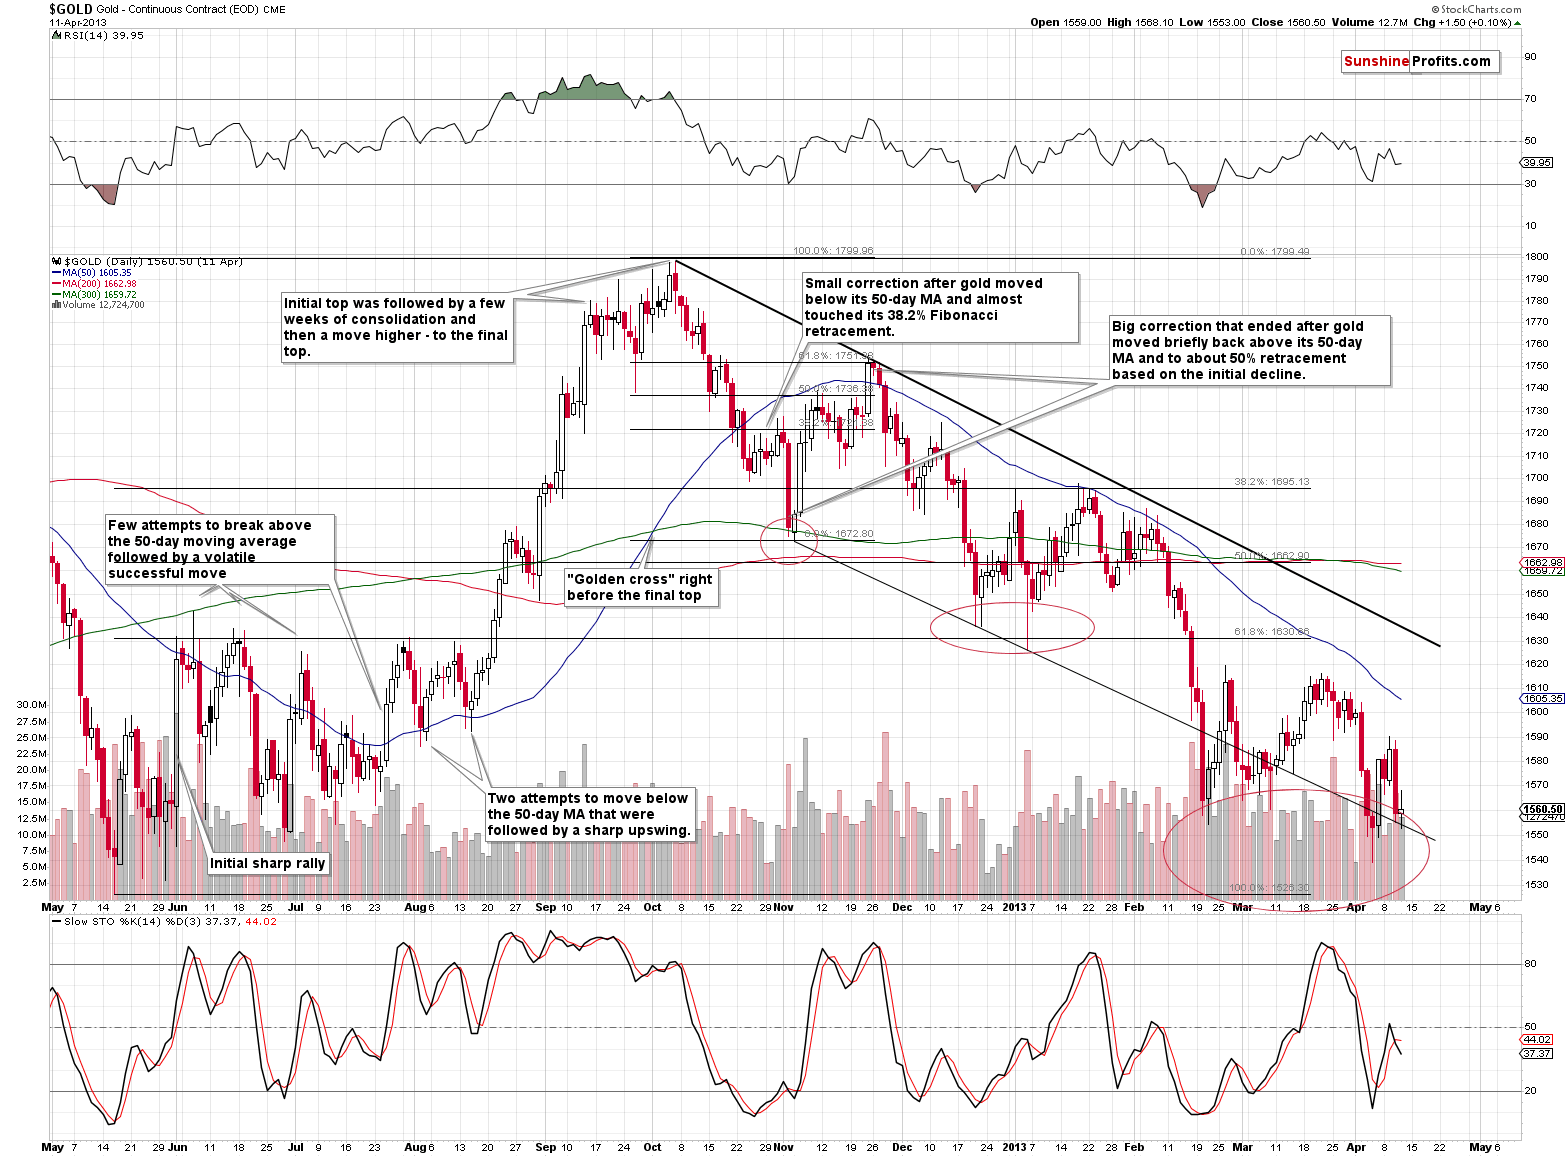
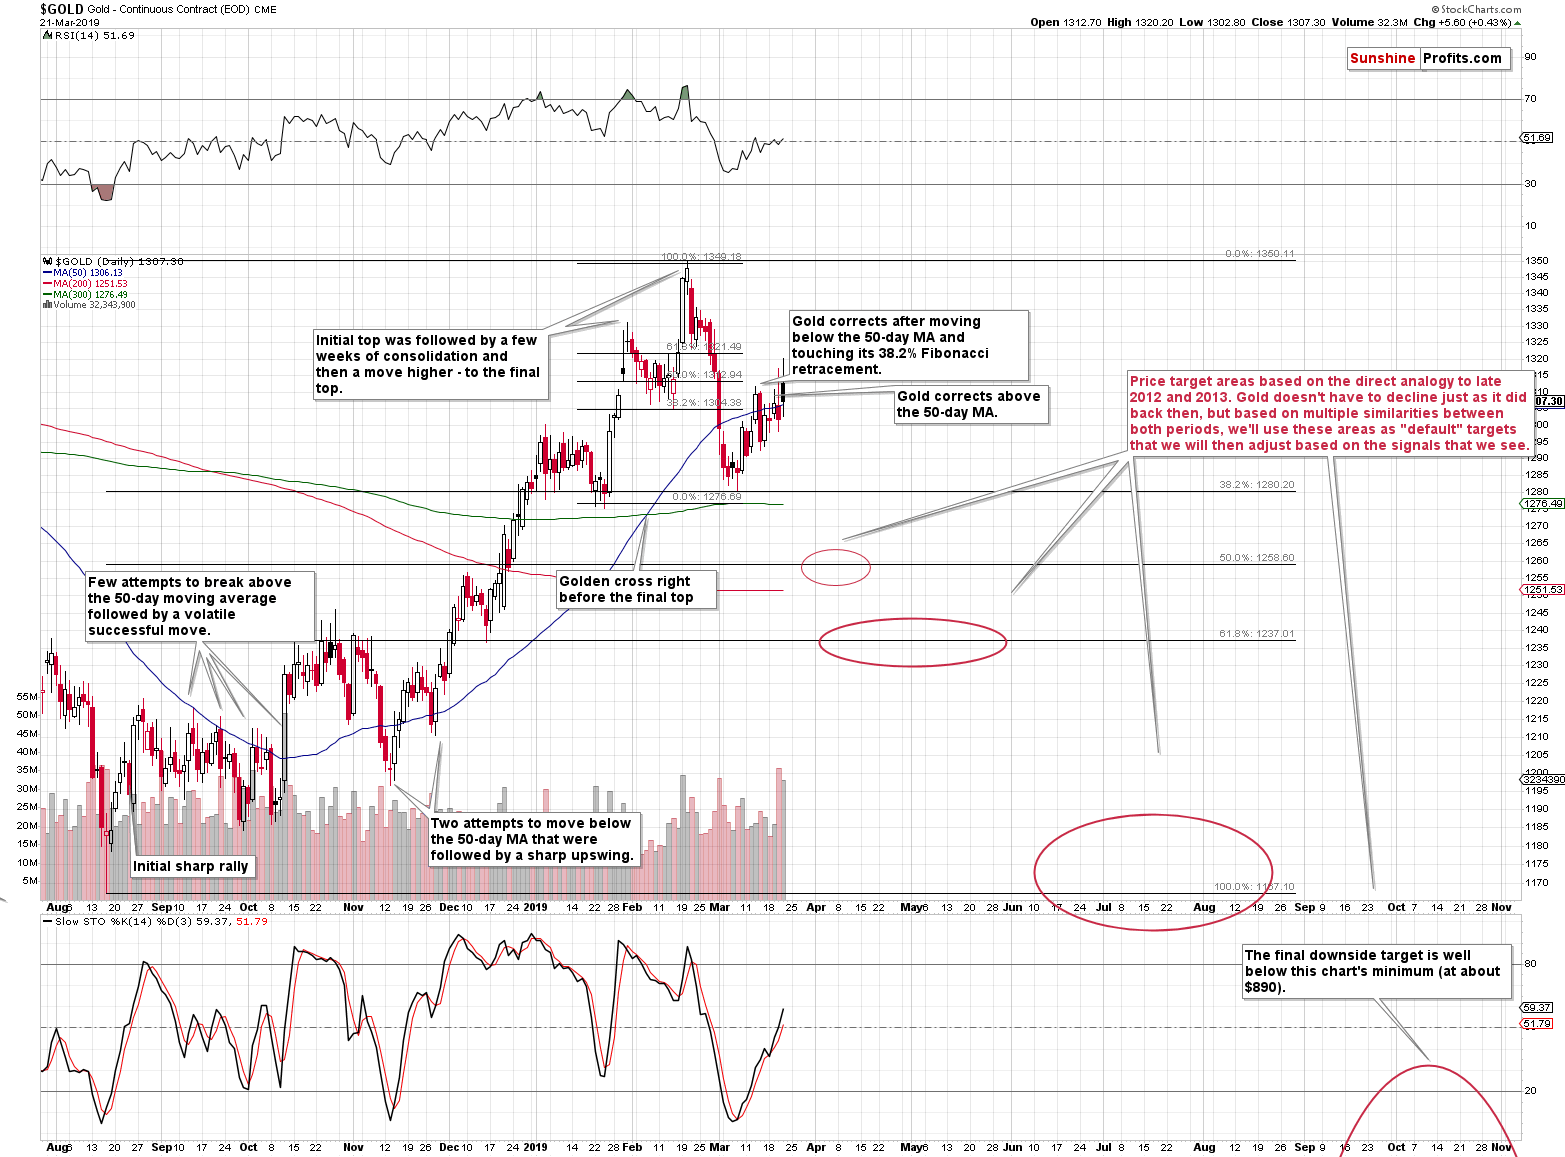
It had been previously rather unclear if the recent move higher in gold was more similar to the small late-October 2012 upswing, or to the November 2012 upswing. Based on what we saw in the recent days, it seems that the latter is the true analogy.
Gold recently moved to the 38.2% Fibonacci retracement based on the previous upswing, to the 300-day moving average (approximately; market with green) and then moved above the 50-day moving average (marked with blue) in a zigzag. Gold moved approximately to the 61.8% Fibonacci retracement based on its recent decline.
Exactly the same was the case in November 2012. The important thing is that back then the rally ended, and a sizable decline started when gold moved to the 61.8% Fibonacci retracement based on the preceding move lower. This means that if the direct analogy is to be upheld, we are likely seeing a top in gold right now.
The next local bottom is likely to take place when gold moves to approximately $1,240 – that’s the 61.8% Fibonacci retracement level based on the previous upswing and it also approximately corresponds to the previous local highs. The combination of analogous support levels triggered a corrective bounce also in December 2012 and January 2013. There is still a chance that the correction starts closer to $1,260, but the former seems more probable as more analogies point to it.
The above might provide us with an opportunity to close the short positions, temporarily limit them, or even switch to the long positions. Naturally, we’ll keep you – our subscribers – informed.
Summary
Summing up, it’s almost certain that the next big move lower has already begun and that the 2013-like slide is in its early stage. Based on the updated version of the 2013-now link, the implications are even more bearish than we had initially assumed. The downside target for gold remains intact ($890), and the corrective upswing that we just saw seems to be rather natural part of the bigger move lower – not a beginning of an important move higher. And it seems that the corrective move higher in the PMs is either over or about to be over shortly. Gold’s very weak reaction to Fed’s surprisingly dovish remarks strongly confirms the bearish outlook for the following weeks.
To summarize:
Trading capital (supplementary part of the portfolio; our opinion): Full short position (250% of the full position) in gold, silver, and mining stocks is justified from the risk/reward perspective with the following stop-loss orders and exit profit-take price levels:
- Gold: profit-take exit price: $1,062; stop-loss: $1,357; initial target price for the DGLD ETN: $82.96; stop-loss for the DGLD ETN $39.87
- Silver: profit-take exit price: $12.32; stop-loss: $16.44; initial target price for the DSLV ETN: $47.67; stop-loss for the DSLV ETN $23.68
- Mining stocks (price levels for the GDX ETF): profit-take exit price: $13.12; stop-loss: $24.17; initial target price for the DUST ETF: $76.87; stop-loss for the DUST ETF $15.47
Note: the above is a specific preparation for a possible sudden price drop, it does not reflect the most likely outcome. You will find a more detailed explanation in our August 1st Alert. In case one wants to bet on junior mining stocks’ prices (we do not suggest doing so – we think senior mining stocks are more predictable in the case of short-term trades – if one wants to do it anyway, we provide the details), here are the stop-loss details and target prices:
- GDXJ ETF: profit-take exit price: $17.52; stop-loss: $35.67
- JDST ETF: initial target price: $143.87 stop-loss: $30.97
Long-term capital (core part of the portfolio; our opinion): No positions (in other words: cash)
Insurance capital (core part of the portfolio; our opinion): Full position
Important Details for New Subscribers
Whether you already subscribed or not, we encourage you to find out how to make the most of our alerts and read our replies to the most common alert-and-gold-trading-related-questions.
Please note that the in the trading section we describe the situation for the day that the alert is posted. In other words, it we are writing about a speculative position, it means that it is up-to-date on the day it was posted. We are also featuring the initial target prices, so that you can decide whether keeping a position on a given day is something that is in tune with your approach (some moves are too small for medium-term traders and some might appear too big for day-traders).
Plus, you might want to read why our stop-loss orders are usually relatively far from the current price.
Please note that a full position doesn’t mean using all of the capital for a given trade. You will find details on our thoughts on gold portfolio structuring in the Key Insights section on our website.
As a reminder – “initial target price” means exactly that – an “initial” one, it’s not a price level at which we suggest closing positions. If this becomes the case (like it did in the previous trade) we will refer to these levels as levels of exit orders (exactly as we’ve done previously). Stop-loss levels, however, are naturally not “initial”, but something that, in our opinion, might be entered as an order.
Since it is impossible to synchronize target prices and stop-loss levels for all the ETFs and ETNs with the main markets that we provide these levels for (gold, silver and mining stocks – the GDX ETF), the stop-loss levels and target prices for other ETNs and ETF (among other: UGLD, DGLD, USLV, DSLV, NUGT, DUST, JNUG, JDST) are provided as supplementary, and not as “final”. This means that if a stop-loss or a target level is reached for any of the “additional instruments” (DGLD for instance), but not for the “main instrument” (gold in this case), we will view positions in both gold and DGLD as still open and the stop-loss for DGLD would have to be moved lower. On the other hand, if gold moves to a stop-loss level but DGLD doesn’t, then we will view both positions (in gold and DGLD) as closed. In other words, since it’s not possible to be 100% certain that each related instrument moves to a given level when the underlying instrument does, we can’t provide levels that would be binding. The levels that we do provide are our best estimate of the levels that will correspond to the levels in the underlying assets, but it will be the underlying assets that one will need to focus on regarding the signs pointing to closing a given position or keeping it open. We might adjust the levels in the “additional instruments” without adjusting the levels in the “main instruments”, which will simply mean that we have improved our estimation of these levels, not that we changed our outlook on the markets. We are already working on a tool that would update these levels on a daily basis for the most popular ETFs, ETNs and individual mining stocks.
Our preferred ways to invest in and to trade gold along with the reasoning can be found in the how to buy gold section. Additionally, our preferred ETFs and ETNs can be found in our Gold & Silver ETF Ranking.
As a reminder, Gold & Silver Trading Alerts are posted before or on each trading day (we usually post them before the opening bell, but we don't promise doing that each day). If there's anything urgent, we will send you an additional small alert before posting the main one.
=====
Latest Free Trading Alerts:
With everyone talking about recession, investors desperately need some clues to assess the state of the economy. This is what our today’s article provide you with. We invite you to read it and find out what are the two most important recession indicators – and what is the link between them and the gold prices.
Two Most Important Recession Indicators and Gold
=====
Thank you.
Sincerely,
Przemyslaw Radomski, CFA
Editor-in-chief, Gold & Silver Fund Manager

