

Briefly: in our opinion, full (300% of the regular position size) speculative short positions in mining stocks are justified from the risk/reward point of view at the moment of publishing this Alert.
Many investors are waiting for the Nonfarm Payrolls data today to guide them in their investment decisions, but it seems that precious metals have already told us where they want to move next. On Wednesday, they ignored the bullish indication from the ADP Nonfarm Employment Change, and they formed a profound reversal. The decline has continued since that time, while the USD Index has been on a rise. This is a good indication that the next big move lower in the PMs is already underway.
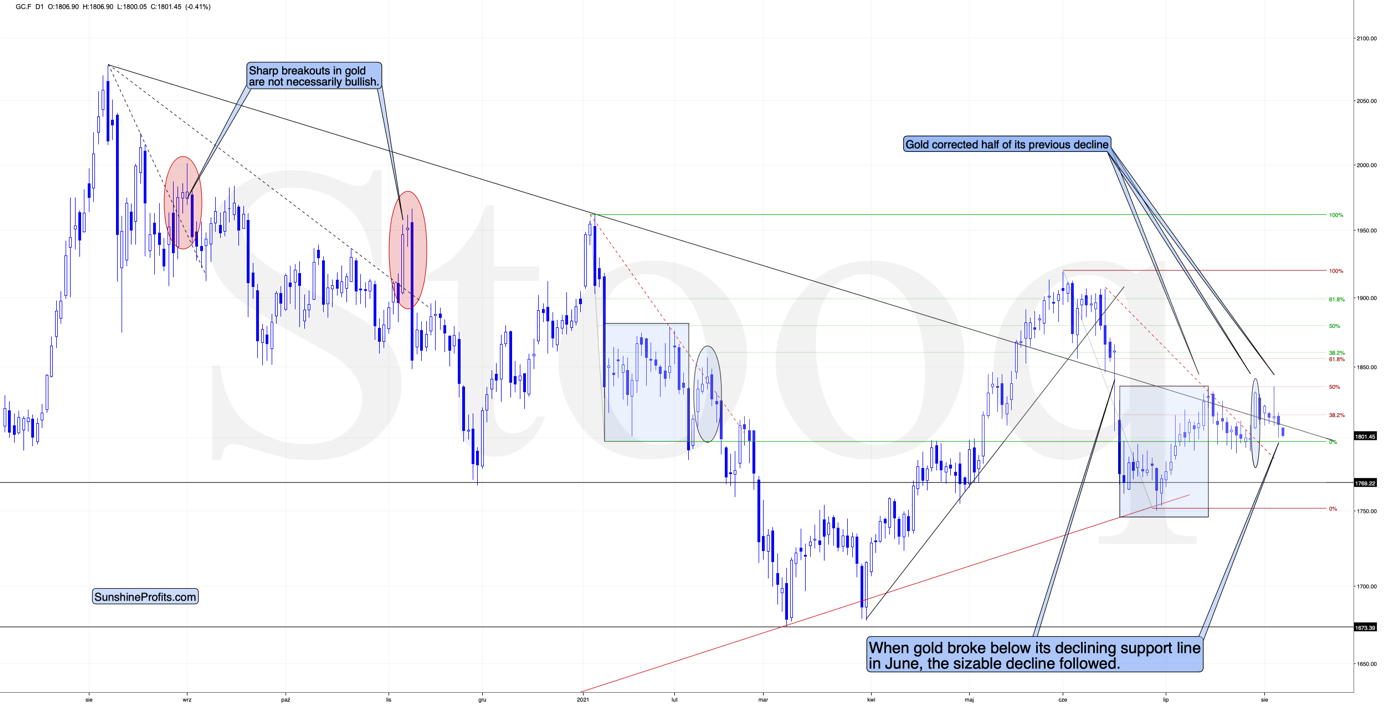
The interesting development that happened in today’s pre-market trading is that gold managed to decline below the rising support line based on two major tops: the August 2020 one and the January 2021 one. When gold broke back below this line in June, it was the start of a sharp decline. Since history tends to rhyme, the implications are bearish.
Still, this kind of confirmation is just a cherry on the top of the very bearish cake that all the other factors create. And the fact that gold simply refused to rally (despite many factors that should have made it rally) is the key short-term indication pointing to lower gold prices.
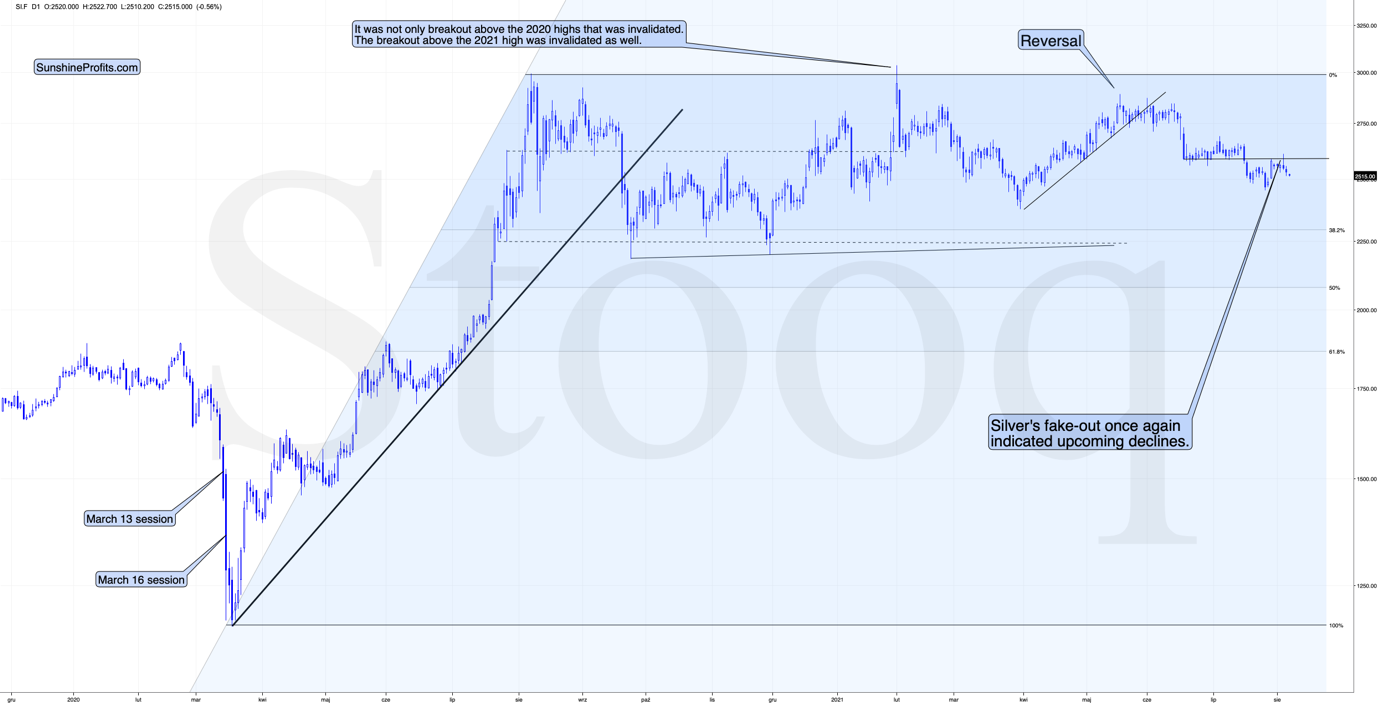
As far as silver is concerned, the situation is also developing just as I described previously:
(…)
Silver moved to its recent short-term high while gold is not even close to being halfway back up. This means that on a very short-term basis, silver is clearly outperforming gold.
This is also what tends to happen shortly before significant declines across the precious metals sector.
Now, the sizes of both moves were not that significant, so this performance could also be more or less random, and, if that was the case, the outperformance would be just accidental. Consequently, it’s not a game-changing signal in terms of its importance. It is something that’s on top of multiple other indications that we have, and the most important ones are not of a short-term nature at all. The long-term self-similarities in gold and the HUI Index (gold stocks) are the true key to understanding where the precious metals sector is likely to head next, and you already know about those, as I described them thoroughly on Monday.
(…) Not only did the early indications prove to be correct, but we actually saw a fresh sell signal in the form of silver’s “fakeout”.
The white metal appeared to be moving back above its June lows, but it was quickly hammered back down, and it ended the session a bit lower. Invalidations of breakouts are very bearish, and silver is known for breaking above certain resistance levels very briefly (without analogous action in gold and gold stocks) only to invalidate them shortly – and it usually happens right before significant moves to the downside.
The implications are clearly bearish, and, more importantly, it’s not the only confirmation that gold received.
The Gold Miners
In yesterday’s analysis, I wrote the following about the mining stocks:
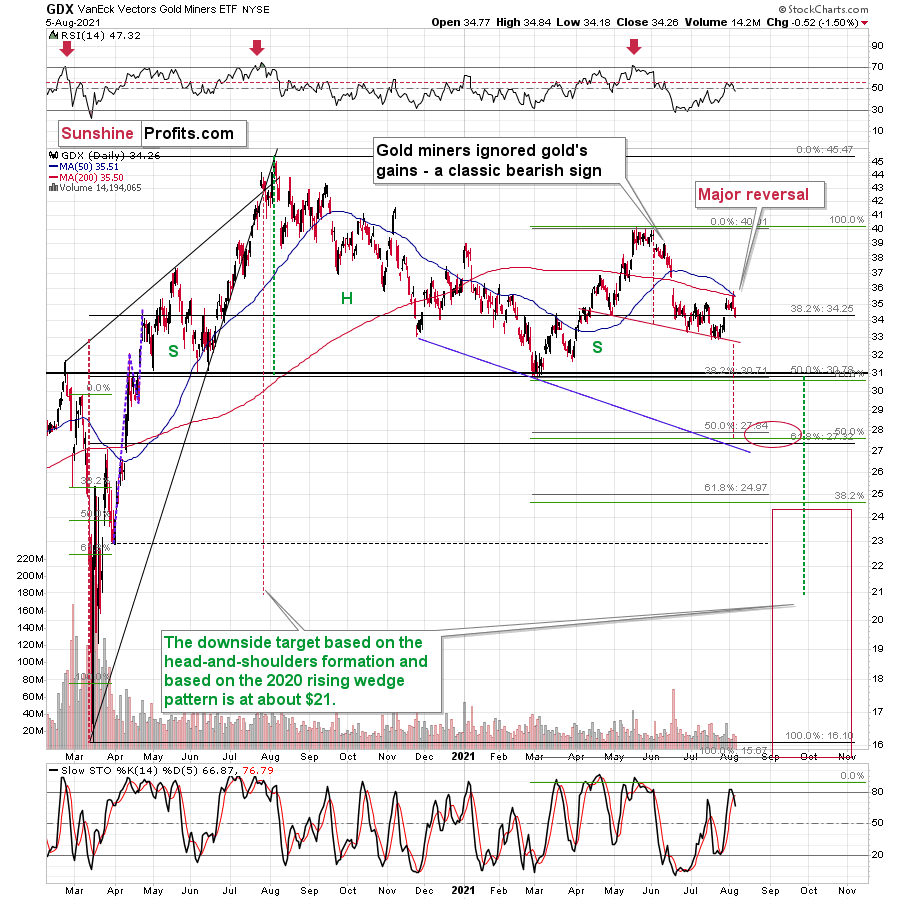
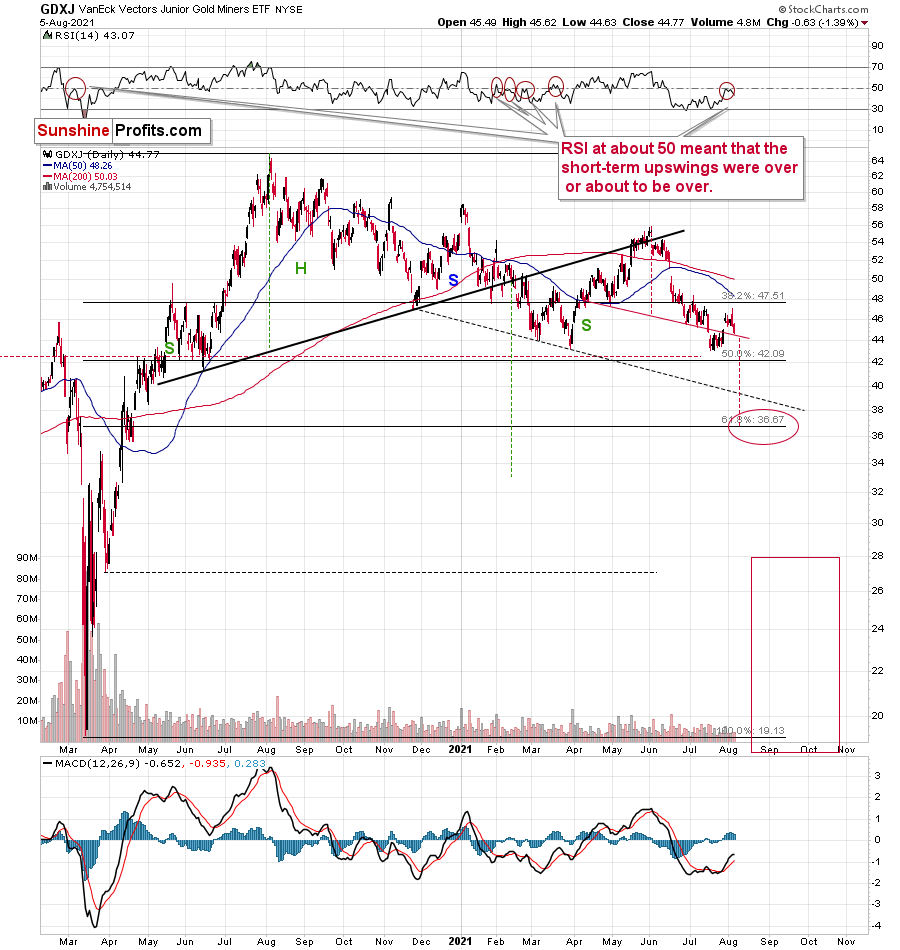
Despite the early move higher in the miners, their climb was invalidated. Both seniors (GDX) and juniors (GDXJ) ended yesterday’s session lower. This means that we saw sell signals from both ETFs based on their reversals, as well as one general sell signal based on the miners’ underperformance of gold (which ended yesterday’s session slightly higher).
Please note that both mining stock ETFs’ RSI indicators are at the levels that triggered short-term reversals in the past. In particular, please note that the RSI based on the GDXJ formed specific double tops before junior miners started their short-term declines (late February and March 2021). Based on yesterday’s reversal, we saw exactly the same thing once again. The implications are bearish.
Miners declined yesterday, just as they were likely to. Seniors declined a bit more than juniors, but this seems to have been an exception from the rule rather than a change of the rule. Juniors are still likely to underperform seniors in the following weeks and months.
And while the precious metals sector seems to have topped, the USD Index seems to have found its bottom at its 38.2% Fibonacci retracement.
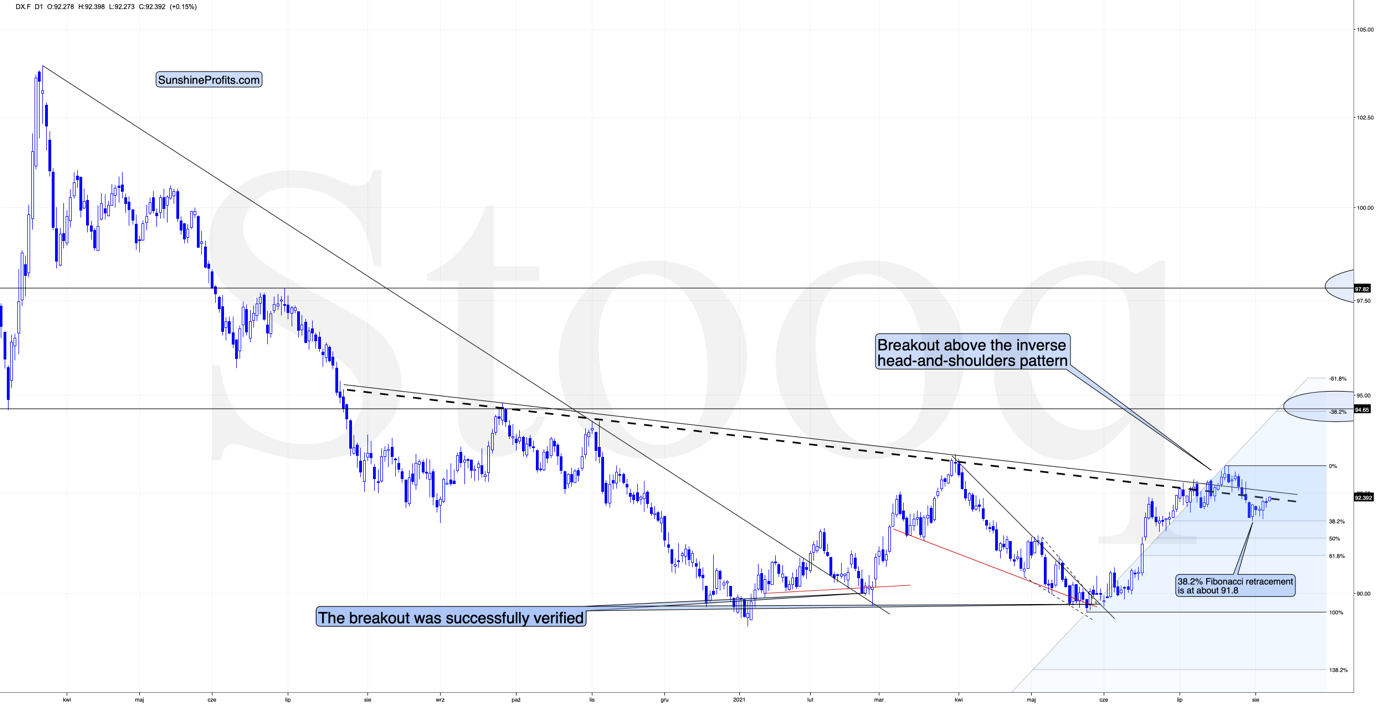
After another move lower on an intraday basis (on Wednesday, August 4), the USDX ended the day slightly higher. It consolidated yesterday, and it’s up once again today. It seems that the short-term bottom might already be in (I’m not ruling out a move to the 50% retracement though) and that the next attempt to break above the blue declining resistance line will be successful. That resistance line is particularly important, as it’s the neck level of the broad inverse head-and-shoulders pattern with the upside target close to 98. Naturally, such a move would be likely to have devastating consequences for the precious metals sector.
Having said that, let’s take a look at the markets from a more fundamental angle.
Contrary to Popular Opinion
With the U.S. 10-Year Treasury yield inching higher in recent days, the boom-or-bust economic narrative has the Treasury benchmark on the wrong side of optimism. However, it’s important to remember that the U.S. 10-Year Treasury yield still trades at an all-time low relative to realized inflation.
To explain, I wrote previously:
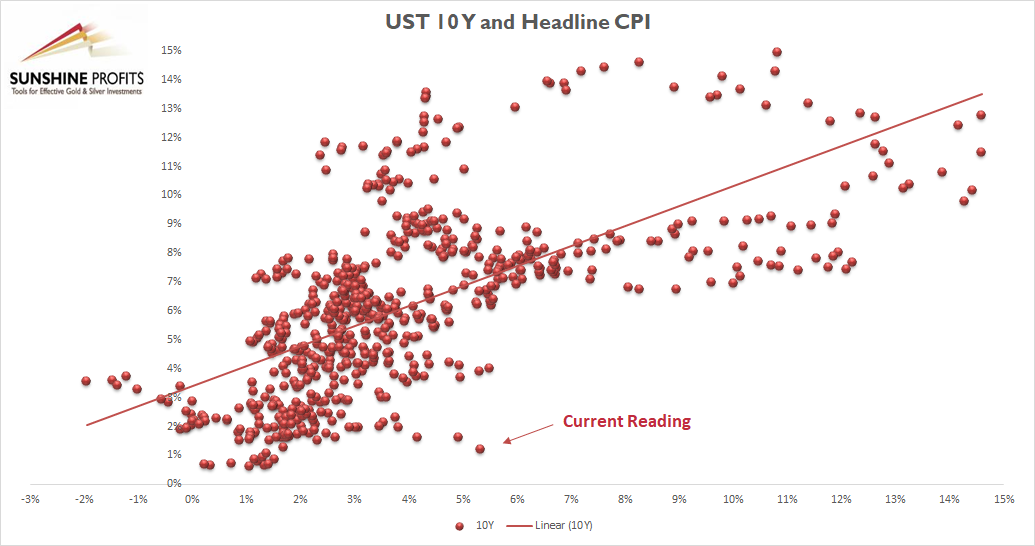
The scatterplot above depicts the relationship between the headline Consumer Price Index (CPI) and the U.S. 10-Year Treasury yield (available data dates back to 1967). For context, the headline CPI is plotted on the horizontal axis, while the U.S. 10-Year Treasury yield is plotted on the vertical axis. If you analyze the dot labelled “Current Reading,” you can see that the U.S. 10-Year Treasury yield has never been lower when the headline CPI has risen by 5% or more year-over-year (YoY). In fact, even if the headline CPI declined to the FED’s 2% YoY target, the U.S. 10-Year Treasury yield at 1.22% would still be the lowest relative reading of all time.
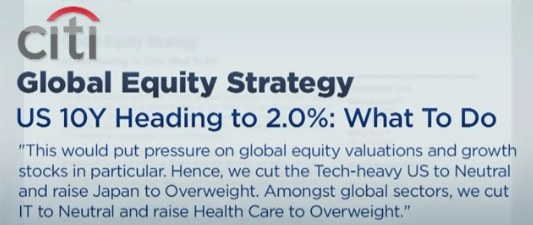
Thus, while investors have left the long end of the U.S. yield curve for dead, Citigroup forecasted a rebirth on Aug. 4. To explain, Citigroup’s rates strategists told clients that the U.S. 10-Year Treasury yield should reach 2% in the coming months.
Please see below:
Tilting the scale, Citigroup noted that Treasury tax collection in June left the federal government flush with cash and resulted in only $94 billion of new Treasury issuance. In the process, with the U.S. Federal Reserve (FED) buying $80 billion of the $94 billion in new notes, distortion prevailed across the Treasury market.
What’s more, Citigroup’s chief U.S. equity strategist Tobias Levkovich told Bloomberg on Aug. 4 that the bank expects interest rate sensitive assets to come under pressure in the coming months. For context, the PMs are highly allergic to rising interest rates. He said:
“Bond yields have had an enormous impact on how you think about growth versus value. Central banks globally have been keeping suppressed rates really since 2008. That suggests they don’t have confidence in long-term, sustainable, durable growth. The U.S. is a heavy growth market. If you believe bond yields are going to edge higher, then growth stocks are going to take it a little bit on the chin.”
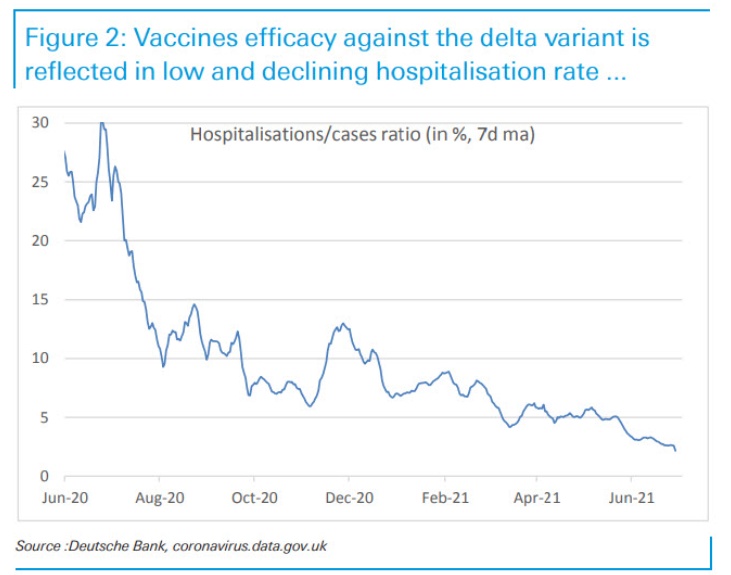
As another factor depressing U.S. Treasury yields, the spread of the Delta variant elicits fears of an economic slowdown. And with the FED’s prospective taper increasing the anxiety, the narrative has shifted to slower growth, lower inflation, and, eventually, a reenactment of the FED cutting interest rates. However, while cases surge and the panic intensifies, U.K. hospitalizations as a percentage of cases (the U.K. has been hard-hit by the Delta variant) have actually declined.
Please see below:
On top of that, IHS Markit also released its U.S. services PMI on Aug. 4. And while the headline index declined from 64.6 in June to 59.9 in July, the report revealed:
“New business continued to rise in July, and at one of the fastest rates since data collection began in October 2009. The upturn was supported by a pick-up in client demand following vaccinations and the relaxation of COVID-19 restrictions. The robust expansion was one of the quickest in over three years despite softening to the slowest since February.”
And while services have been a major laggard – due to coronavirus-related restrictions on social/in-person activity – inflation is still moving higher.
Please see below:
 Source: IHS Markit
Circling Back to Inflation
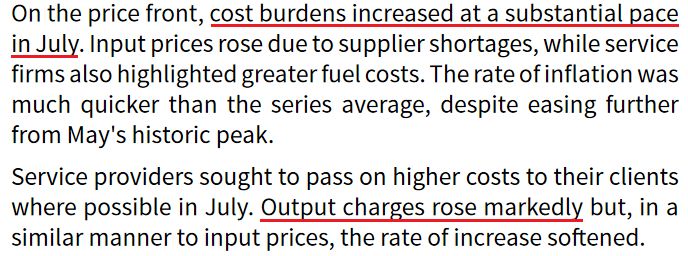
Furthermore, while I’ve warned about rampant inflation for months, Citigroup’s Inflation Surprise Index hit another all-time high in July. For context, a positive ‘surprise’ occurs when actual inflation exceeds economists’ consensus estimate.
Please see below:
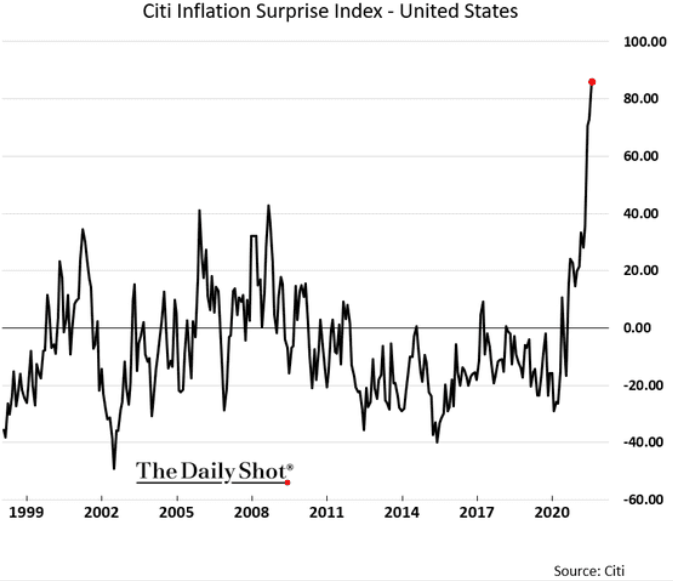
Likewise, while S&P 500 companies are in the midst of reporting their second-quarter earnings, conference calls have been riddled with mentions of inflation. Moreover, data from Bank of America highlights just how ‘inflationary’ executives’ rhetoric has been.
To explain, the light blue line above tracks the year-over-year (YoY) percentage change in S&P 500 companies’ mentions of “inflation” during earnings calls, while the dark blue line above tracks the YoY percentage change in the headline Consumer Price Index (CPI). And though the two lines aren’t fitted to perfection, the behavior of the former is clearly unprecedented.
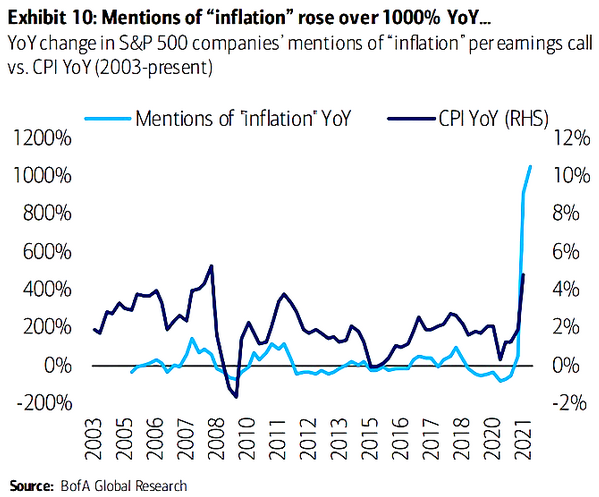
Adding to the inflationary pressures, S&P 500 companies’ mentions of supply chain inflation and wage inflation have also surged to new all-time highs.
Please see below:
To explain, the green and dark blue lines above track the YoY percentage change in S&P 500 companies’ mentions of supply chain and labor-related inflation. If you analyze the right side of the chart, you can see that the reality on the ground is much different than the one depicted by the U.S. 10-Year Treasury yield.
Supply Shock? Probably Not
Finally, while bond investors price in a doomsday scenario, the inflationary surge is far from a supply shock. For context, a supply shock occurs when depleted inventories are the sole reason for upward pressure on prices. However, if you analyze the chart below, you can see that the countries that are consuming the most finished goods are actually seeing the sharpest increases in output inflation.
Please see below:
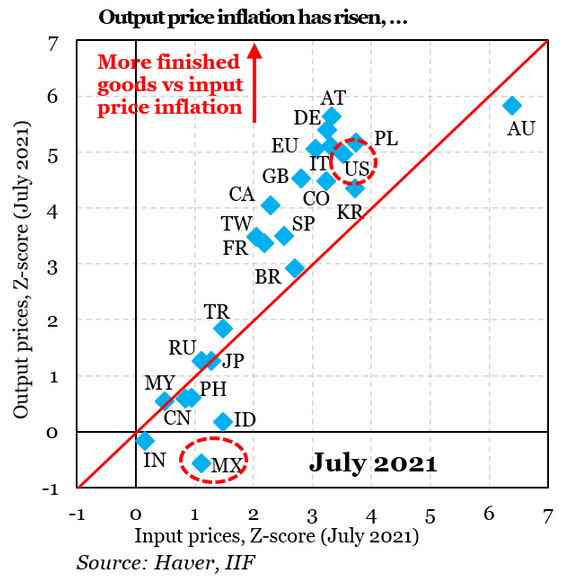
To explain, the blue diamonds above depict the output (and input) inflation experienced in various countries in relation to their consumption of finished goods (calculated as a z-score). If you analyze the trend, you can see that high demand is coinciding with high inflation. For example, if you focus on the U.S. (the red circle near the top), you can see that output inflation is roughly five standard deviations above its historical average, and the demand for finished goods continues to accelerate. Conversely, Mexico’s (the red circle at the bottom) output inflation is roughly 0.5 standard deviations below its historical average and demand remains relatively subdued.
The bottom line? If the inflationary surge was merely a supply shock, output inflation would be similar across all regions. However, with low-demand regions (like MX and IN) unable to pass through input inflation due to weak demand, the U.S. is confronted with a much different scenario. Thus, if Citigroup’s 2% forecast for the U.S. 10-Year Treasury yield proves prescient, the PMs will likely suffer amid the regime change.
In conclusion, gold mining stocks were drastic underperformers on Aug. 5, and rising U.S. equities still weren’t enough to elicit any optimism. And while today’s jobs report (if weak) could uplift their short-term performance, the medium-term forecasts for gold and silver remain clearly bearish. With FED officials ramping up their hawkish rhetoric and the U.S. 10-Year Treasury yield already staring at an all-time low (relative to realized inflation), a reversal of the imbalance could increase the PM’s selling pressure in the coming months. However, because their long-term outlooks remain extremely robust, the PMs’ next leg down will likely present us with a secular buying opportunity.
Overview of the Upcoming Part of the Decline
- The biggest corrective upswing in gold might already be over, and it seems that we won’t have to wait long for the current small correction to end either.
- After miners slide in a meaningful and volatile way, but silver doesn’t (and it just declines moderately), I plan to switch from short positions in miners to short positions in silver. At this time, it’s too early to say at what price levels this would take place – perhaps with gold close to $1,600. I plan to exit those short positions when gold shows substantial strength relative to the USD Index, while the latter is still rallying. This might take place with gold close to $1,350 - $1,500 and the entire decline (from above $1,900 to about $1,475) would be likely to take place within 6-20 weeks, and I would expect silver to fall the hardest in the final part of the move. This moment (when gold performs very strongly against the rallying USD and miners are strong relative to gold – after gold has already declined substantially) is likely to be the best entry point for long-term investments, in my view. This might also happen with gold close to $1,475, but it’s too early to say with certainty at this time.
- As a confirmation for the above, I will use the (upcoming or perhaps we have already seen it?) top in the general stock market as the starting point for the three-month countdown. The reason is that after the 1929 top, gold miners declined for about three months after the general stock market started to slide. We also saw some confirmations of this theory based on the analogy to 2008. All in all, the precious metals sector would be likely to bottom about three months after the general stock market tops.
- The above is based on the information available today, and it might change in the following days/weeks.
Please note that the above timing details are relatively broad and “for general overview only” – so that you know more or less what I think and how volatile I think the moves are likely to be – on an approximate basis. These time targets are not binding or clear enough for me to think that they should be used for purchasing options, warrants or similar instruments.
Letters to the Editor
Q: Based on your analysis, can I assume a short-to-medium-term bearishness in safe heaven currencies like CHF and JPY? I know that you don't provide research on currencies, I would just like to see your view, especially on CHF and JPY against USD, EUR, GBP.
A: That’s quite likely, but it seems to me that this can be attributed more to the relative strength of the U.S. dollar rather than due to the weakness of the Swiss franc or the Japanese yen.
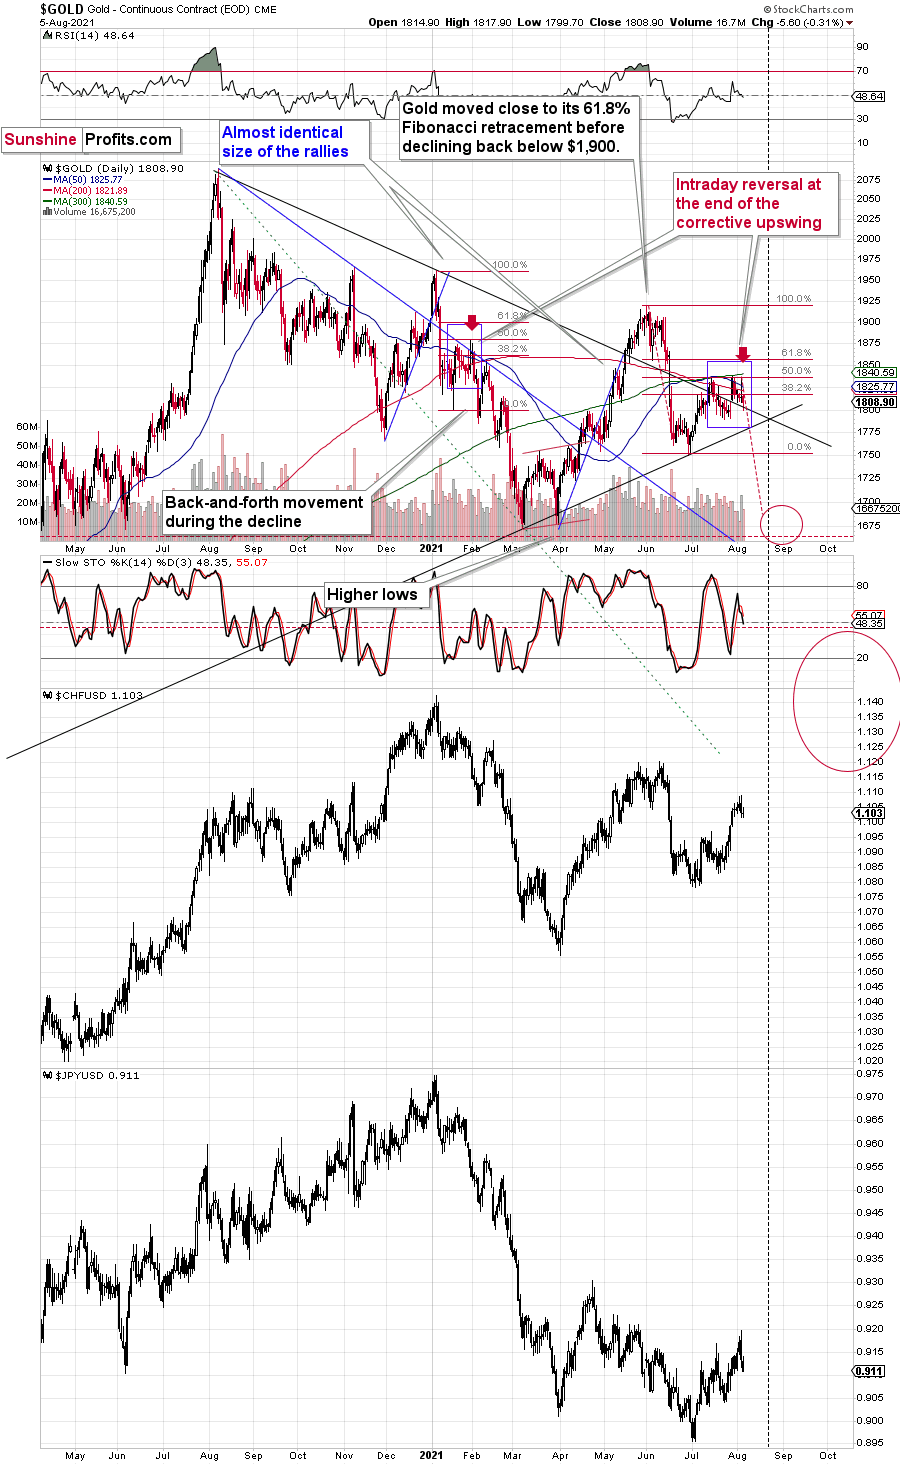
As you can see on the below chart, both currency exchange rates – the CHF/USD and JPY/USD – move more or less in tune with gold, at least as far as medium-term moves are concerned. This means that since I’m expecting a medium-term move lower in gold, moves lower in those currencies (against the U.S. dollar) would also be likely to move lower. Still, I don’t view it as likely as a move lower in gold – in the case of gold and the rest of the precious metals sector, I have more details to analyze.
Now, let’s take a look at both currencies against the euro and see how their performance can be compared to gold.
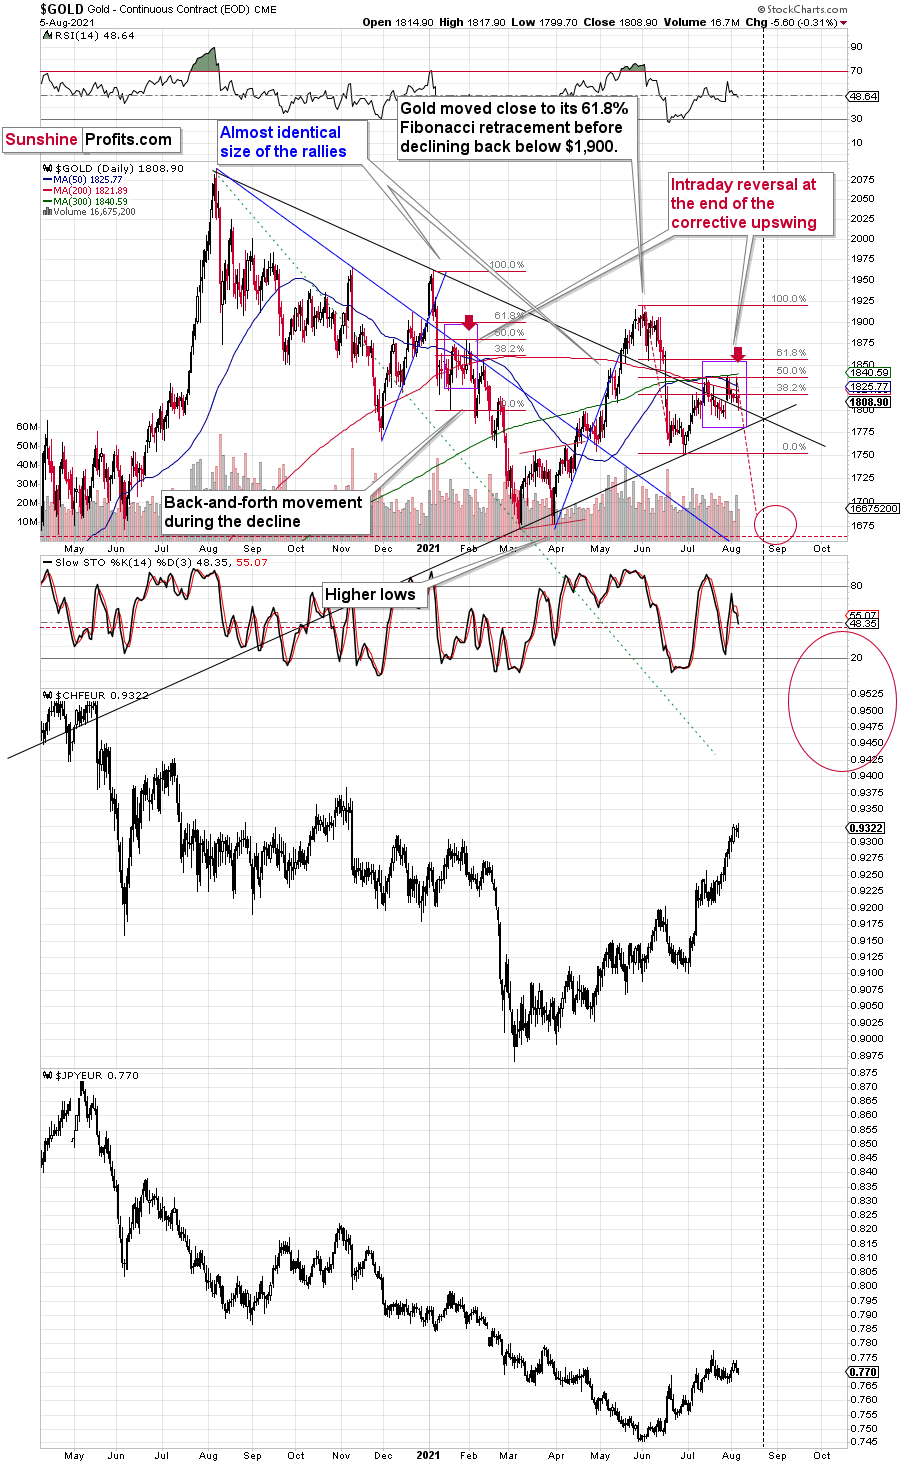
In short, there is no clear link. All three have been declining for about a year now, but please note that while gold rallied in Q2 2020, the CHF/EUR and JPY/EUR pairs declined.
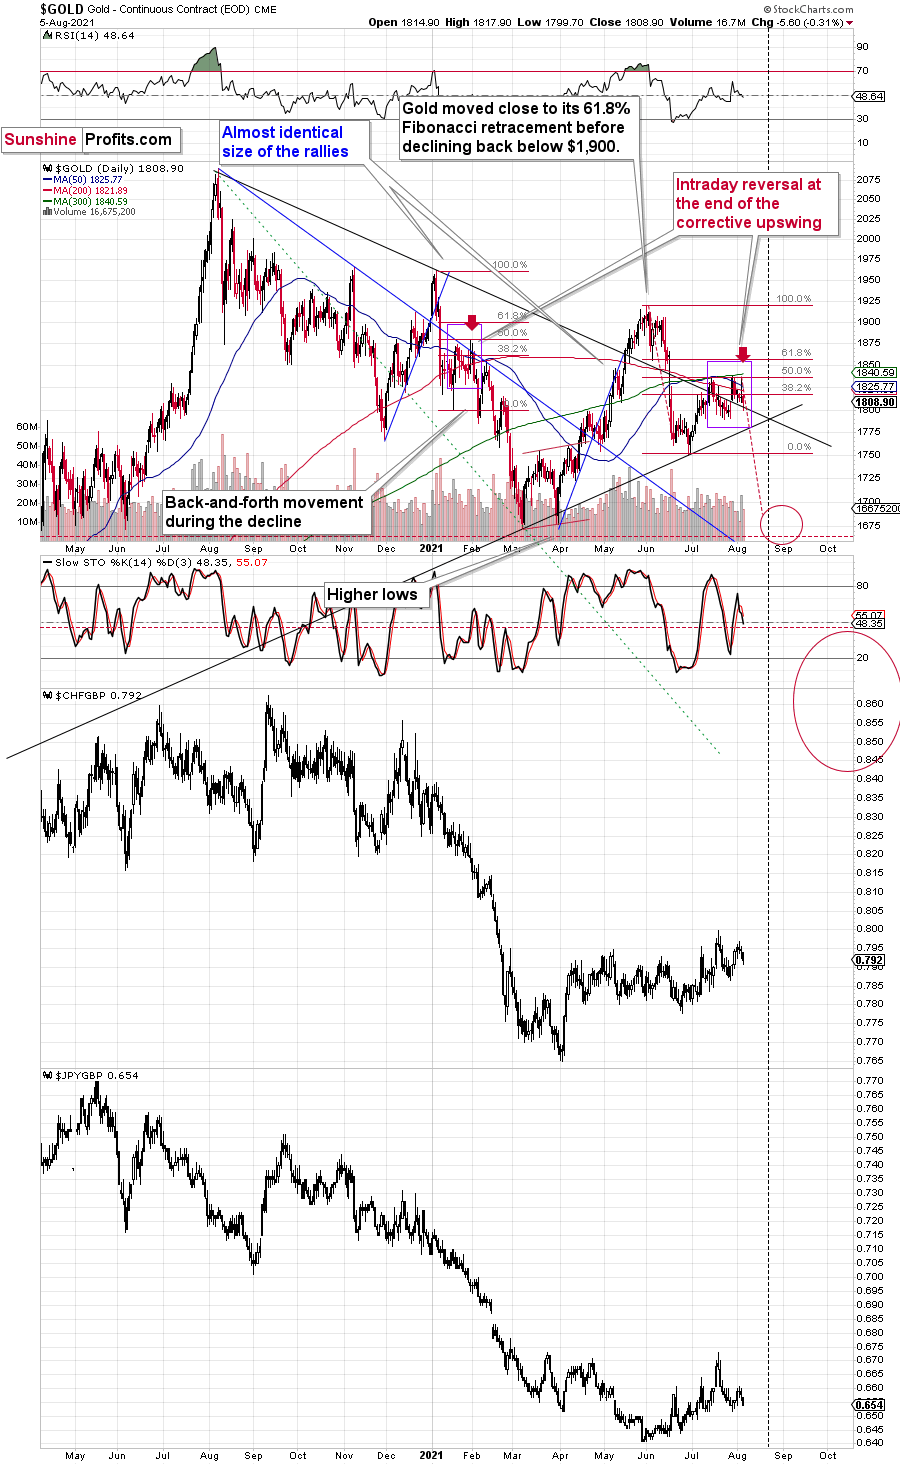
As far as the CHF/GBP and JPY/GBP currency pairs are concerned, we also see no clear link between them and gold. The Q2 2020 performance makes it clear that they don’t necessarily move in tune with each other, even in the case of very big moves.
So, like it is said above, anything that’s being priced in the USD is likely to move at least somewhat similarly in the future, as I see a big move higher on the horizon in the case of the U.S. currency. This also means the price of gold that is quoted in the USD. And before you ask, I expect gold to (for the most part of the decline) decline more than the USD Index, so I think that gold’s decline will also be visible in terms of other currencies.
Summary
To summarize, it seems that the bigger corrective upswing in gold might already be over and that we won’t have to wait for the current small correction to end either. While the next few days may (!) bring temporarily higher prices, it’s unlikely that they will hold. In particular, just as mining stocks had local corrections that didn’t change the nature of the huge medium-term declines in 2008 and 2012-2013, it’s unlikely that the current local correction will change anything.
It seems that our profits on the short position in the junior mining stocks are going to grow substantially in the following weeks.
After the sell-off (that takes gold to about $1,350 - $1,500), I expect the precious metals to rally significantly. The final part of the decline might take as little as 1-5 weeks, so it's important to stay alert to any changes.
Most importantly, please stay healthy and safe. We made a lot of money last March and this March, and it seems that we’re about to make much more on the upcoming decline, but you have to be healthy to enjoy the results.
As always, we'll keep you - our subscribers - informed.
To summarize:
Trading capital (supplementary part of the portfolio; our opinion): Full speculative short positions (300% of the full position) in mining stocks are justified from the risk to reward point of view with the following binding exit profit-take price levels:
Mining stocks (price levels for the GDXJ ETF): binding profit-take exit price: $37.12; stop-loss: none (the volatility is too big to justify a stop-loss order in case of this particular trade)
Alternatively, if one seeks leverage, we’re providing the binding profit-take levels for the JDST (2x leveraged) and GDXD (3x leveraged – which is not suggested for most traders/investors due to the significant leverage). The binding profit-take level for the JDST: $15.96; stop-loss for the JDST: none (the volatility is too big to justify a SL order in case of this particular trade); binding profit-take level for the GDXD: $37.02; stop-loss for the GDXD: none (the volatility is too big to justify a SL order in case of this particular trade).
For-your-information targets (our opinion; we continue to think that mining stocks are the preferred way of taking advantage of the upcoming price move, but if for whatever reason one wants / has to use silver or gold for this trade, we are providing the details anyway.):
Silver futures upside profit-take exit price: unclear at this time - initially, it might be a good idea to exit, when gold moves to $1,683
Gold futures upside profit-take exit price: $1,683
HGD.TO – alternative (Canadian) inverse 2x leveraged gold stocks ETF – the upside profit-take exit price: $12.88
Long-term capital (core part of the portfolio; our opinion): No positions (in other words: cash
Insurance capital (core part of the portfolio; our opinion): Full position
Whether you already subscribed or not, we encourage you to find out how to make the most of our alerts and read our replies to the most common alert-and-gold-trading-related-questions.
Please note that we describe the situation for the day that the alert is posted in the trading section. In other words, if we are writing about a speculative position, it means that it is up-to-date on the day it was posted. We are also featuring the initial target prices to decide whether keeping a position on a given day is in tune with your approach (some moves are too small for medium-term traders, and some might appear too big for day-traders).
Additionally, you might want to read why our stop-loss orders are usually relatively far from the current price.
Please note that a full position doesn't mean using all of the capital for a given trade. You will find details on our thoughts on gold portfolio structuring in the Key Insights section on our website.
As a reminder - "initial target price" means exactly that - an "initial" one. It's not a price level at which we suggest closing positions. If this becomes the case (like it did in the previous trade), we will refer to these levels as levels of exit orders (exactly as we've done previously). Stop-loss levels, however, are naturally not "initial", but something that, in our opinion, might be entered as an order.
Since it is impossible to synchronize target prices and stop-loss levels for all the ETFs and ETNs with the main markets that we provide these levels for (gold, silver and mining stocks - the GDX ETF), the stop-loss levels and target prices for other ETNs and ETF (among other: UGL, GLL, AGQ, ZSL, NUGT, DUST, JNUG, JDST) are provided as supplementary, and not as "final". This means that if a stop-loss or a target level is reached for any of the "additional instruments" (GLL for instance), but not for the "main instrument" (gold in this case), we will view positions in both gold and GLL as still open and the stop-loss for GLL would have to be moved lower. On the other hand, if gold moves to a stop-loss level but GLL doesn't, then we will view both positions (in gold and GLL) as closed. In other words, since it's not possible to be 100% certain that each related instrument moves to a given level when the underlying instrument does, we can't provide levels that would be binding. The levels that we do provide are our best estimate of the levels that will correspond to the levels in the underlying assets, but it will be the underlying assets that one will need to focus on regarding the signs pointing to closing a given position or keeping it open. We might adjust the levels in the "additional instruments" without adjusting the levels in the "main instruments", which will simply mean that we have improved our estimation of these levels, not that we changed our outlook on the markets. We are already working on a tool that would update these levels daily for the most popular ETFs, ETNs and individual mining stocks.
Our preferred ways to invest in and to trade gold along with the reasoning can be found in the how to buy gold section. Furthermore, our preferred ETFs and ETNs can be found in our Gold & Silver ETF Ranking.
As a reminder, Gold & Silver Trading Alerts are posted before or on each trading day (we usually post them before the opening bell, but we don't promise doing that each day). If there's anything urgent, we will send you an additional small alert before posting the main one.
Thank you.
Przemyslaw Radomski, CFA
Founder, Editor-in-chief

