

Briefly: in our opinion, full (300% of the regular position size) speculative short positions in junior mining stocks are justified from the risk/reward point of view at the moment of publishing this Alert.
In short, practically everything that I wrote in Monday’s analysis and yesterday’s analysis remains up-to-date. The profit-take levels in silver were hit, so those of you who chose to hold a short position in silver have likely reaped nice profits yesterday. Congratulations!
In yesterday’s analysis, I commented on silver in the following way:
The white metal moved lower, and its intraday low was just 2 cents above our profit-take price.
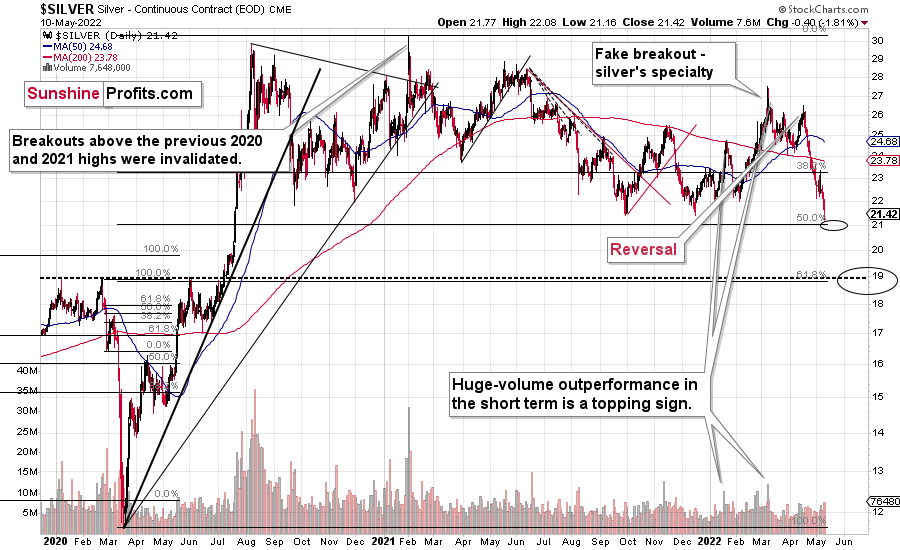
Since gold is likely to move lower, and the general stock market is likely to move lower, I’m moving the downside target lower – slightly above the 50% Fibonacci retracement level based on the entire 2020-2021 decline. That’s the next strong support that’s below the 2021 lows, and that would more or less correspond to the size of the above-mentioned short-term decline in gold (at least that seems realistic to me).
The downside target that I featured was $21.23 (for silver futures, which some might choose to call a form of “paper silver”, by the way), and it was reached yesterday – the intraday low was $21.16. The downside targets for related ETFs were reached too. Will silver soar immediately? This might or might not be the case, as the general stock market might decline some more in the near future. Since silver (and mining stocks) are quite correlated with the former, they could move even lower.
Still, it doesn’t mean that it’s worthwhile to stay in position at all times. Since silver moved so close to its 50% Fibonacci retracement level yesterday, it could be a situation where the downside is very limited and the upside (for the short term) is bigger. For now, I’m not suggesting going long (to profit not only on the decline but also on the rebound), but this might change very soon.
Please note that despite all the “peak silver”, “silver is manipulated so it has to rally”, and “silver shortage” theories, the white metal is now much lower than it was when it got really popular – in early 2021. Don’t get me wrong: I think that the silver price will move into the three digits, but I would like to emphasize that just because something is likely to happen eventually doesn’t mean that it has to happen right away. Silver’s purchasing power can decline before soaring, and that’s exactly what it's been doing for more than a year now. It doesn’t seem that the medium-term decline in silver is already over.
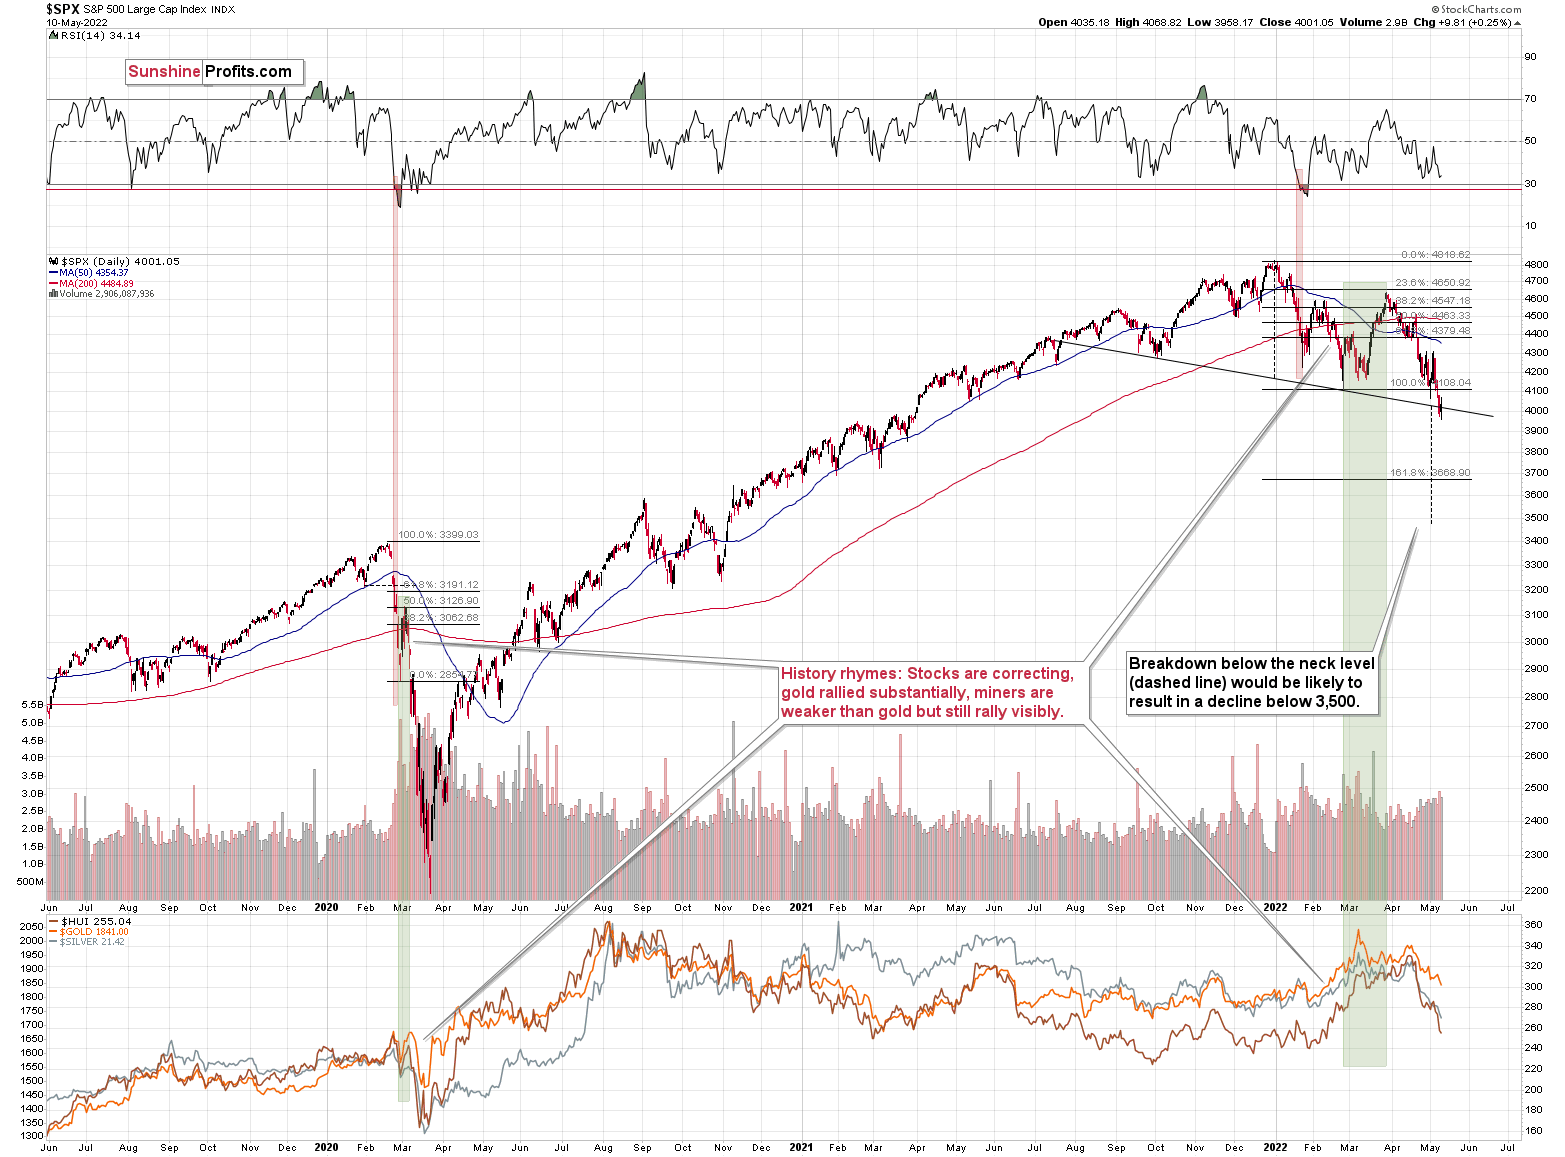
Speaking of the general stock market, it moved slightly higher yesterday (in terms of closing prices), but the move was not significant enough to invalidate the breakdown below the neck level of the head-and-shoulders formation. Therefore, the breakdown is now almost confirmed, and the situation is already more bearish than it was yesterday.
At the moment of writing these words, stocks are once again trying to rally, but so far the rally is not as big as yesterday’s pre-market rally that was just erased. Thus, I doubt that stocks will be able to avoid falling in the near term.
The S&P 500 is currently confirming a breakdown below its head and shoulders pattern. Once confirmed (just one more close below the neck level is required), the formation will be complete, and the next target will be below 3,500. So, yes, I expect the S&P 500 to decline below its 2021 lows in the near future.
On May 6, I wrote:
Still, it doesn’t mean that we can’t get another brief rally in the meantime. In fact, the head and shoulders formations are often immediately followed by a brief corrective upswing – one that takes the market close to or right back to the previously broken neck level of the H&S pattern. Seeing this kind of rally would perfectly correspond to the scenario in which S&P rallies when the RSI indicator reaches 30, and it would perfectly match other potential price moves that I mentioned earlier today.
In other words, if stocks decline somewhat and then correct, it could translate into the same thing in gold, silver, and mining stocks. Given the stronger link between stocks and silver and miners’ duo, the latter could correct more visibly.
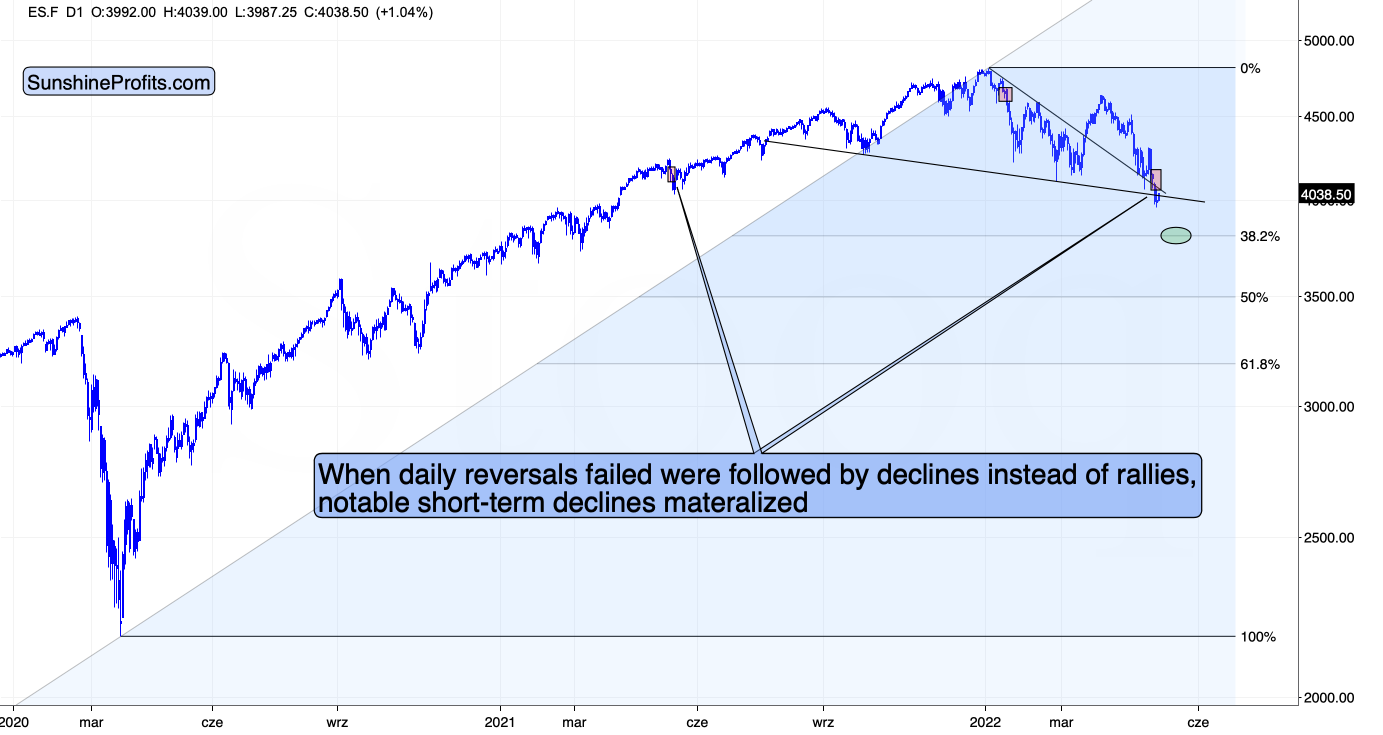
On Friday (May 6), the S&P 500 had its lowest daily close of the year. While investors might not see many technical patterns, they’ll definitely notice something like that. That’s bearish – it could trigger some panic selling among investors, and today’s pre-market decline indicates that it might already be taking place.
Interestingly, last Friday’s session was a daily reversal, so it seems that stocks should be rallying today, but… they are not. Technically, it’s the futures market that shows declines, not the index itself, but futures can be used as the index’s proxy here.
That’s where the situation gets really interesting. There were very few cases when a daily reversal was followed by a decline below the reversal’s low. In fact, in the recent past, there were just two such cases, and I marked them with red rectangles. In both cases, short-term declines followed. What’s notable is that this was the way in which the January decline started, and the decline that followed was sizable.
If stocks are about to decline (continuing their recent decline), then they would do so after a consolidation that took the form of a flag. Thus, the price would be likely to fall by about the same amount as it had fallen before the pattern. One could argue when the previous short-term decline started (at the recent top or at the very recent top before the decline accelerated), but overall, it seems that stocks would be likely to decline below the neck level of their head and shoulders formation, and then decline some more.
Is there any nearby support level that would be strong enough to stop this short-term decline? Yes: it’s the 38.2% Fibonacci retracement level based on the 2020-2022 rally.
Back in 2020, the very first decline erased 50% of the preceding rally, but back then the market was much more volatile than it is right now, so it’s understandable.
If we see a decline to the 38.2% Fibonacci retracement and then a comeback to the previously broken neck level of the head and shoulders pattern, it would fit practically everything that I wrote above and in the previous days / weeks.
It would trigger another immediate-term decline in silver and mining stocks in the near term that would be followed by a (quite likely tradable) rebound.
Speaking of junior mining stocks, my previous comments remain up-to-date:
In short, just like in the case of silver, I decided to move our exit prices lower – a bit below the previous lows.
Why? Because that’s where there’s the next really strong support – provided by the 61.8% Fibonacci retracement and because it seems that the general stock market will decline a bit more before correcting.
I mean, I expected juniors to decline along with the general stock market, but the huge size of juniors’ decline was more than I had expected to happen during just one session compared to what happened in the S&P 500.
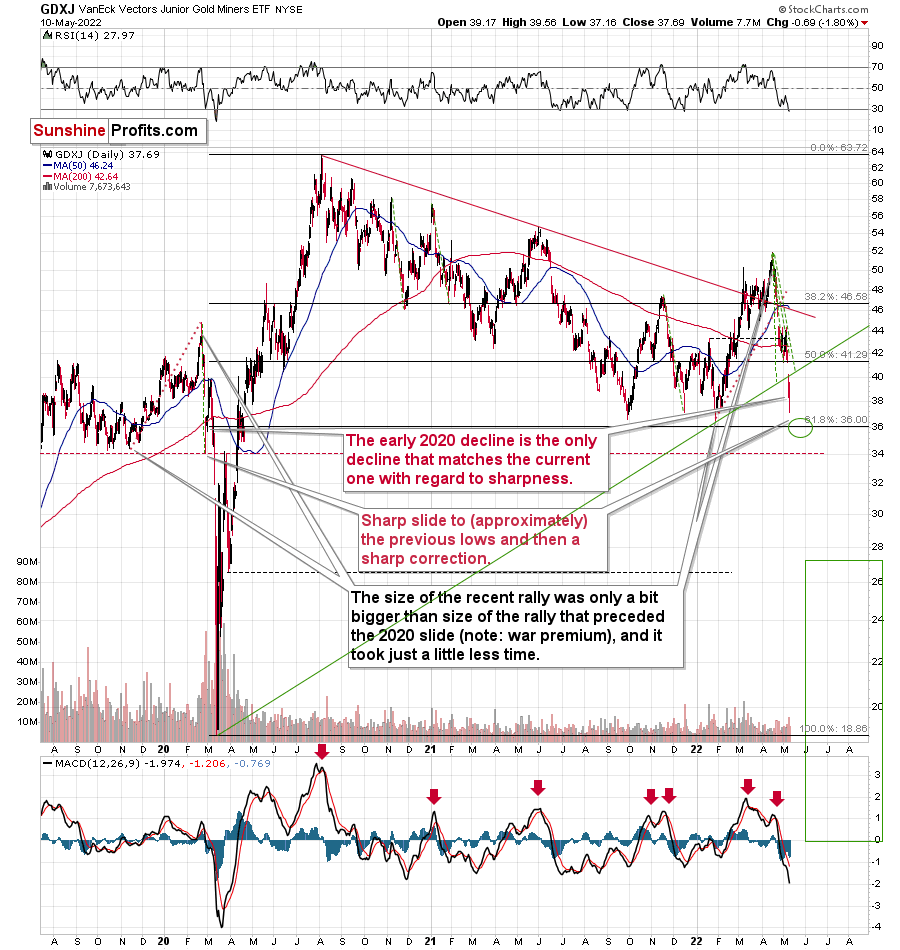
If stocks have more to fall (much more than just a repeat of yesterday’s decline) and gold could repeat its yesterday’s decline, it seems that junior miners could more than repeat their slide. Since they fell by over $3 yesterday, juniors can now decline by at least another $3. This would bring them below their previous lows and below the previous target of about $37.
In fact, given the strength of the momentum, I wouldn’t even rule out the scenario in which miners slide to ~$34. Then again, let’s not forget that miners tend to show some kind of strength before rallying, so the pace of their decline would be likely to diminish before the turnaround. Therefore, expecting the sharpness of the decline to continue all the way down is not realistic. Consequently, ~$36 seems more realistic as a short-term downside target than $34 is.
Besides, the GDXJ’s 4-hour chart also suggests a move to this area.
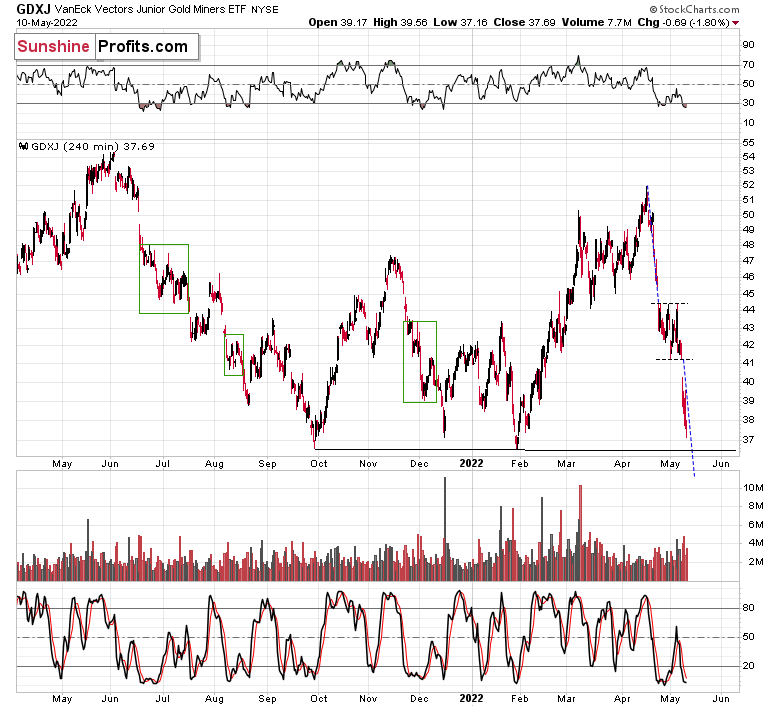
Consolidations tend to be followed by price moves that are similar to the moves that preceded them. Applying this to the letter provides us with a target that’s slightly below $36.
Also, in today’s pre-market trading, the S&P 500 futures have corrected about a third of yesterday’s decline, but the GDXJ (in London trading) corrected about 4% of yesterday’s decline (almost nothing). This suggests that junior miners really want to decline more.
During yesterday’s session, miners declined by almost 2%, and the GDXJ ETF moved very close to the $37 level, which was my previous target.
Was this the bottom? As I wrote earlier, it could be the case, but given the situation in the general stock market and the link between junior miners and stocks, it seems more likely that juniors will decline some more before correcting.
In today’s London trading, the GDXJ practically erased its yesterday’s decline, but didn’t erase any part of Monday’s decline. The S&P 500 futures were rather flat yesterday, so their pre-market rally by about 1% means that they erased about a third of Monday’s decline (in terms of closing prices).
My point here is that junior miners are not strong relative to other stocks – they are still very weak. Let’s not forget about gold. Gold futures are up by about $10 in today’s pre-market trading, which means that miners had a good reason to rally. Well, they’ve only very briefly corrected so far today.
As gold moved right to the middle of my target area, it seems that it might not want to move much lower before correcting. However, it’s still possible that the bottom would form over several days, and if the stock market declines during that time, junior miners could decline despite the lack of declines in gold.
If the above is the case, then once the stock market moves back up, juniors will likely soar back with vengeance, like a coiled spring that’s finally able to expand. For now, it seems that the general stock market will take juniors lower (in the very near term, that is).
Having said that, let’s take a look at the markets from a fundamental point of view.
Peak Problems?
With the Consumer Price Index (CPI) scheduled for release today, battered bulls are hoping that unrelenting inflation will cool, and therefore, allow the Fed to cool its hawkish rhetoric. However, whether or not inflation shows signs of deceleration on a year-over-year (YoY) basis is irrelevant. Yes, a weaker-than-expected print could afford the ‘buy the dip’ crowd some short-term optimism.
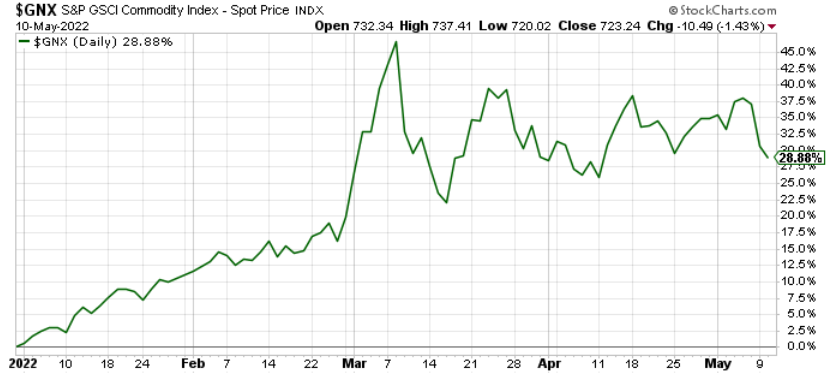
Conversely, with inflation still increasing month-over-month (MoM), the recent decline in the S&P Goldman Sachs Commodity Index (S&P GSCI) needs to intensify to alleviate the medium-term pricing pressures. For context, energy accounts for more than 50% of the S&P GSCI’s movement.
As a result, if the Fed can find a way to suppress oil prices without raising interest rates, then the bull may return to Wall Street (highly unlikely). If not, the central bank will need to do the heavy lifting and kill demand (highly likely).
Please see below:
To that point, with more Fed speakers making the rounds on May 10, the CPI will need to slow dramatically to allow for a dovish 180. Moreover, most of the April surveys and earnings reports cited increasing inflationary pressures. Therefore, it’s no wonder that Cleveland Fed President Loretta Mester said on May 10: “There’s no doubt that the challenge for the Fed is a large one. I think things will be bumpy.”
Please see below:
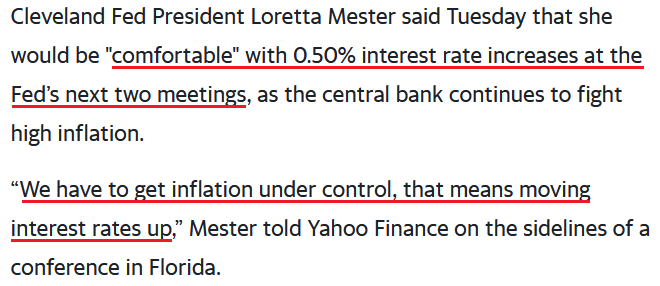 Source: Yahoo
Echoing that sentiment, Fed Governor Christopher Waller said on May 10: “The labor market is strong. The economy is doing so well. This is the time to hit it if you think there’s going to be any kind of negative reaction, because the economy can take it …).”
“We know what happened for the Fed not taking the job seriously on inflation in the 1970s, and we ain’t gonna let that happen.”
Please see below:
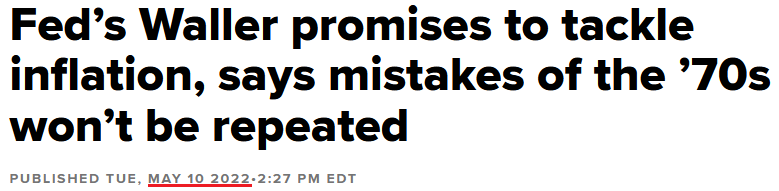 Source: CNBC
Likewise, Richmond Fed President Thomas Barkin said on May 10: “Once we get in the range of the neutral rate, we can then determine whether inflation remains at a level that requires us to put the brakes on the economy or not.”
For context, his response is pragmatic. The Fed isn’t tightening because it wants to. It’s tightening because it has to calm inflation before the long-term consequences push the U.S. into a deep recession. Therefore, when the objective is achieved, the rate hikes will end. However, in the meantime…
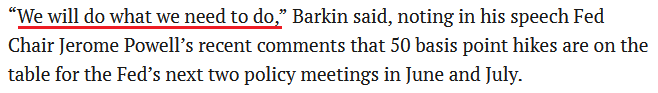 Source: Reuters
Even more revealing, New York Fed President John Williams (a major dove) said on May 10: “Our monetary policy actions will cool the demand side of the equation (…).”
“While the task is difficult, it is not insurmountable. We have the tools to return balance to the economy and restore price stability, and we are committed to using them.”
Moreover, while he took a glass-half-full approach to the prospect of a “soft landing,” the phrase “not insurmountable” doesn’t instill much confidence.
More importantly, though, the interesting fundamental development on May 10 was the subtle signals between the Fed and U.S. President Joe Biden. For example:
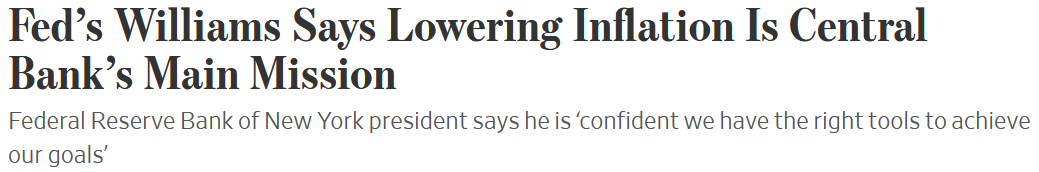 Source: The Wall Street Journal
And:
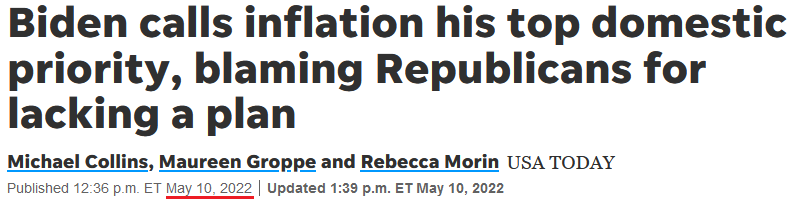 Source: USA Today
Likewise, Biden said on May 10 that curbing inflation “starts with the Federal Reserve” and that “The Fed should do its job, and it will do its job. I’m convinced of that in my mind.”
As a result, should we be surprised that the pair have upped the hawkish ante? Well, for the record, I wrote on Nov. 18:
The hyper-inflationists are missing the forest through the trees. In their argument, they assume that high U.S. debt levels makes raising interest rates impossible. As a result, the U.S. government will allow inflation to run rampant and the U.S. dollar will crash in the process. However, while it’s an interesting story, it’s unrealistic. Why is that?
Well, for one, not raising interest rates will likely do more harm to the U.S. economy than tightening monetary policy. And the reasons are outlined above: if prices keep rising and consumer confidence keeps falling, eventually demand destruction unfolds. As a result, if policymakers don’t solve their inflationary conundrum, failure to do so will likely push the U.S. economy into recession.
Second, the political component shouldn’t be ignored. Biden’s approval ratings keep hitting new lows along with consumer confidence. Thus, is it in his best interest to maintain the status quo? Of course not. That’s why he’s been so forceful on inflation over the last few weeks. Essentially, if he (and/or the Fed) does nothing, he’ll likely lose the next presidential election and the Democrats will likely lose control of Congress. However, if he tames inflation, then he’s a hero. Left with those two options, which one do you think he’ll choose?
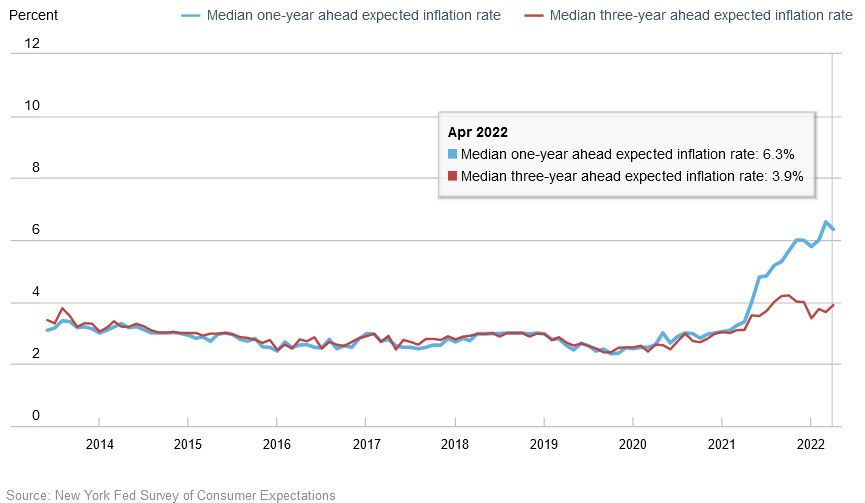
Also noteworthy, the New York Fed released its Survey of Consumer Expectations report on May 9. An excerpt read:
“Median inflation expectations decreased in April at the one-year horizon to 6.3% from 6.6% in March. In contrast, median three-year-ahead inflation expectations rose by 0.2 percentage point to 3.9%.”
Thus, while the net result was largely a wash, both metrics are still materially elevated relative to their historical norms.
Please see below:
However:
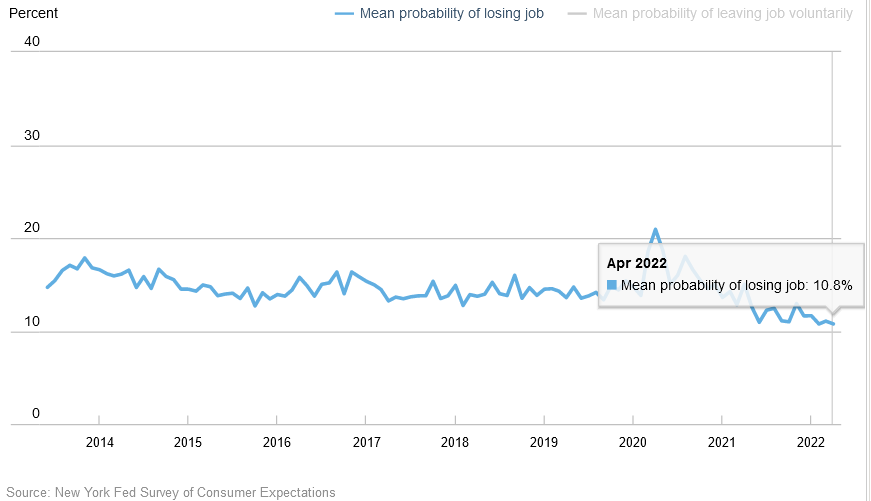
“The mean perceived probability of losing one’s job in the next 12 months decreased by 0.3 percentage point to 10.8%. This matches the series low that was recorded in February 2022 and is well below its 2021 average of 12.5%.”
Please see below:
In addition:
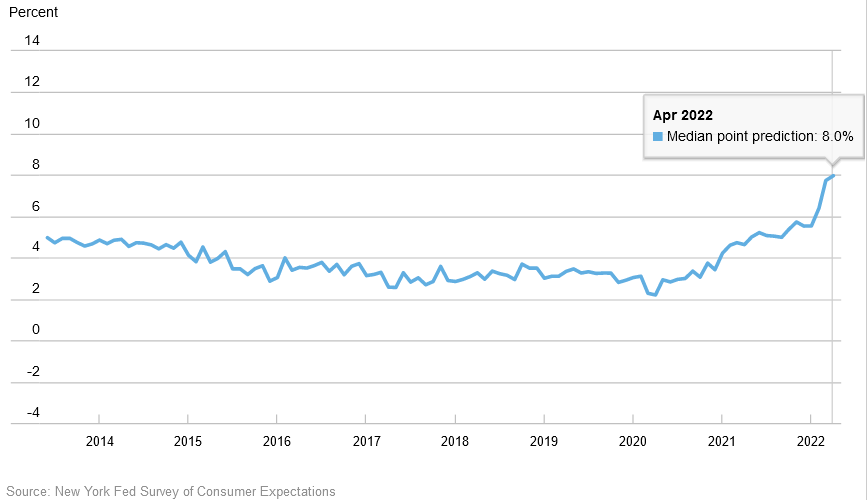
“Median household nominal spending growth expectations increased by 0.3 percentage point to 8.0%, marking a new series high.”
Therefore, all of this data is extremely hawkish for Fed policy. Americans’ inflation expectations are abnormally high, their fear of losing their jobs is abnormally low, and their spending forecasts scream of inflationary overconsumption. Furthermore, the data supports the spending spree that Mastercard highlighted on May 5. I wrote on May 10:
Steve Sadove, senior advisor for Mastercard, added: “Whether for a family barbeque, returning to the office or senior prom, it seems like everyone is out shopping for something.”
Please see below:
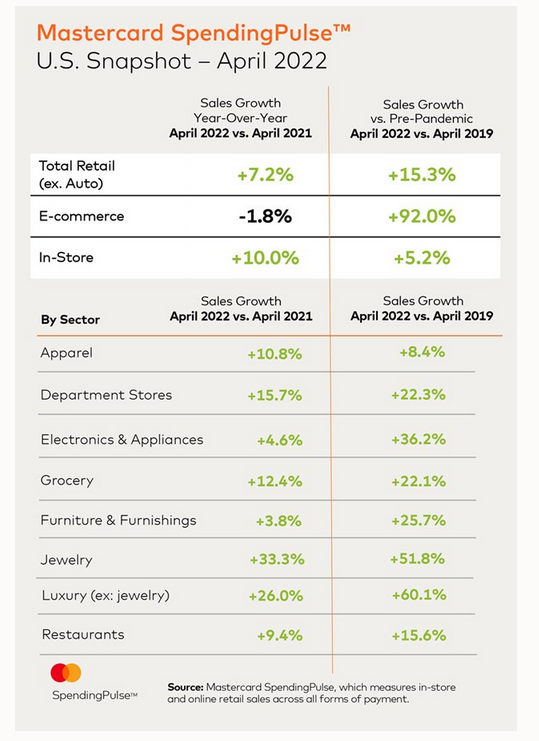
Likewise, if you analyze the YoY percentage changes in the second column above (April 2022 vs. April 2019), you can see just how much consumer spending has increased relative to its pre-pandemic level. As a result, plenty of liquidity needs to unwind for consumers’ habits and medium-term inflation to normalize.
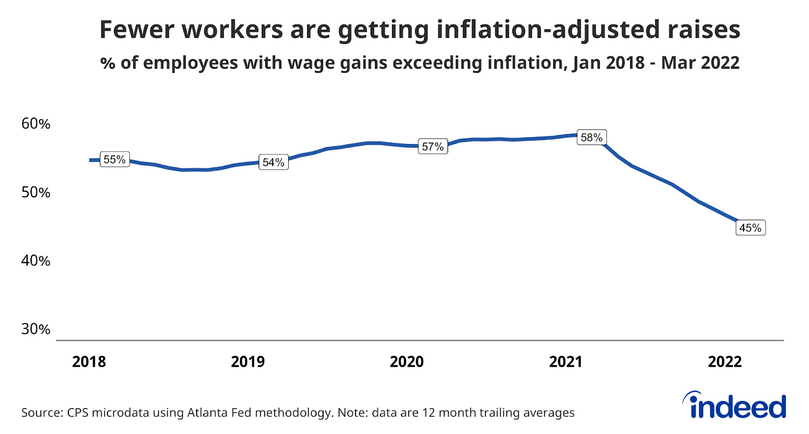
To that point, Indeed released its U.S. labor market update on Apr. 28. An excerpt read:
“In March, about 45% of workers saw their wages grow over the past year after adjusting for inflation. But that’s down from the roughly 58% whose wages were growing faster than inflation in March 2021 (…).”
“But let’s keep things in perspective: It is remarkable that more than 40% of workers are getting inflation-adjusted raises despite consumer prices jumping over 8% on an annual basis. That speaks to how strongly the imbalance between labor supply and demand is driving up wages.”
For context, Indeed's findings are fascinating. With roughly 45% of U.S. employees receiving wage increases that outpace 8%+ annualized inflation, nearly half of the U.S. workforce has increased their real purchasing power. As such, it's no wonder that consumer spending and expectations remain so elevated.
Please see below:
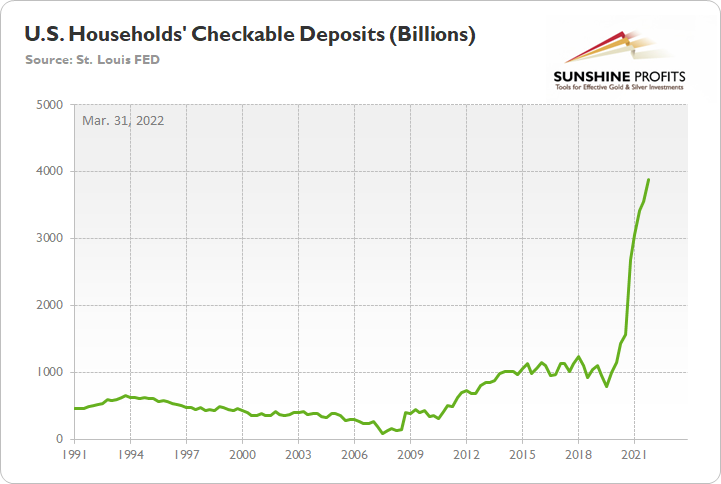
In addition, when you combine the wage outperformance with the fact that U.S. households’ checkable deposits (quarterly data that I’ve shown before) have gone to the moon due to unprecedented stimulus, the reality is this: even if the CPI peaks YoY, the battle is far from over, and the Fed will have to fire plenty of hawkish bullets to win this war.
The bottom line? While optimism should be easy to come by given the bloodbath that’s unfolded in recent days, the Fed’s war against inflation means that the medium-term fundamentals are bearish, not bullish. Furthermore, with Biden suffering politically and the U.S. labor market still red hot, I’ve warned for months that the Fed has been given the green light to hike interest rates. However, since old habits die hard, what I wrote on Apr. 27 should prove prescient over the medium term.
The PMs were mixed on Apr. 26, as mining stocks continued their material underperformance. Moreover, while investors will likely remain in ‘buy the dip’ mode until the very end, lower highs and lower lows should confront the S&P 500 and the PMs over the next few months. As a result, the medium-term outlook for the GDXJ ETF is profoundly bearish.
In conclusion, the PMs declined on May 10, as the GDXJ ETF flirts with its 2022 lows. Moreover, with silver also taken to the woodshed, the riskiest corners of the precious metals market have started to crack. Thus, while financial assets don’t move in a straight line and a bullish short-term trading opportunity may emerge, the PMs’ lower-for-longer trends should continue.
Naturally, as always, I’ll keep you – my subscribers – informed.
Overview of the Upcoming Part of the Decline
- It seems to me that the post-decline consolidation is now over, and that gold, silver, and mining stocks are now likely to continue their medium-term decline. A brief, short-term rally could materialize soon, anyway.
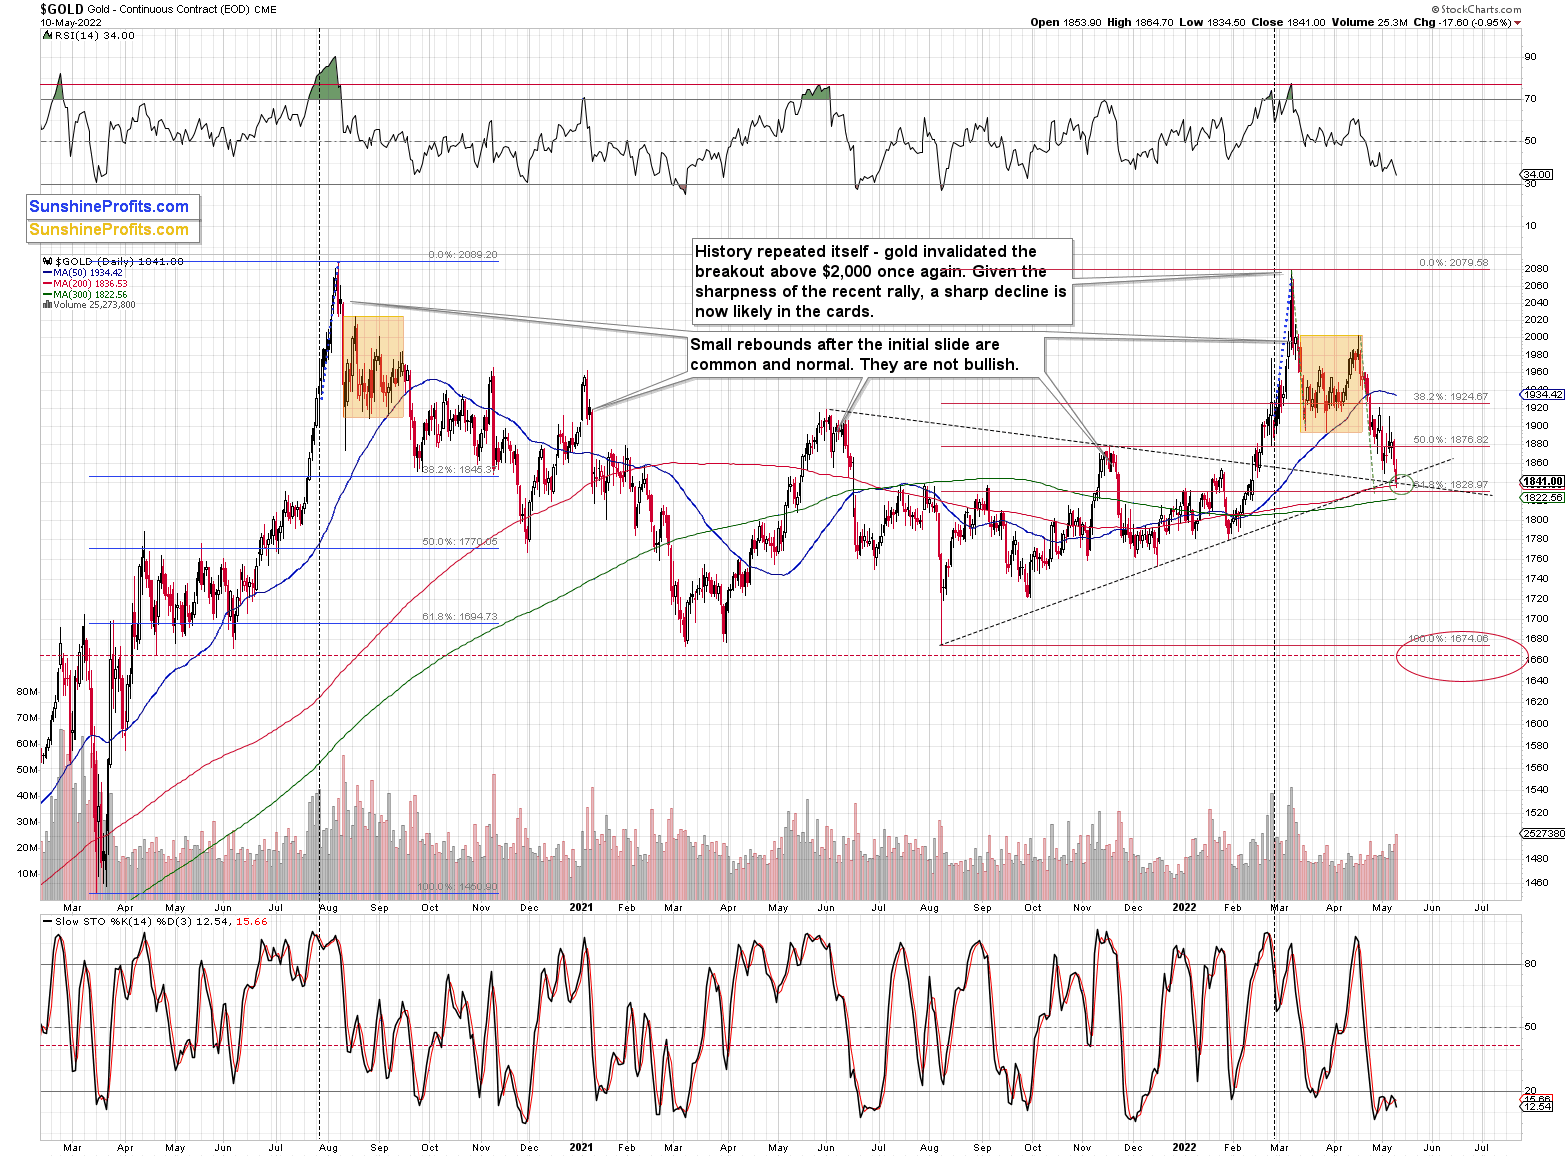
- It seems that the first ( bigger ) stop for gold will be close to its previous 2021 lows, slightly below $1,800 . Then it will likely correct a bit, but it’s unclear if I want to exit or reverse the current short position based on that – it depends on the number and the nature of the bullish indications that we get at that time.
- After the above-mentioned correction, we’re likely to see a powerful slide, perhaps close to the 2020 low ($1,450 - $1,500).
- If we see a situation where miners slide in a meaningful and volatile way while silver doesn’t (it just declines moderately), I plan to – once again – switch from short positions in miners to short positions in silver. At this time, it’s too early to say at what price levels this could take place, and if we get this kind of opportunity at all – perhaps with gold close to $1,600.
- I plan to exit all remaining short positions once gold shows substantial strength relative to the USD Index while the latter is still rallying. This may be the case with gold close to $1,350 - $1,400. I expect silver to fall the hardest in the final part of the move. This moment (when gold performs very strongly against the rallying USD and miners are strong relative to gold after its substantial decline) is likely to be the best entry point for long-term investments, in my view. This can also happen with gold close to $1,375, but at the moment it’s too early to say with certainty.
- As a confirmation for the above, I will use the (upcoming or perhaps we have already seen it?) top in the general stock market as the starting point for the three-month countdown. The reason is that after the 1929 top, gold miners declined for about three months after the general stock market started to slide. We also saw some confirmations of this theory based on the analogy to 2008. All in all, the precious metals sector is likely to bottom about three months after the general stock market tops.
- The above is based on the information available today, and it might change in the following days/weeks.
You will find my general overview of the outlook for gold on the chart below:
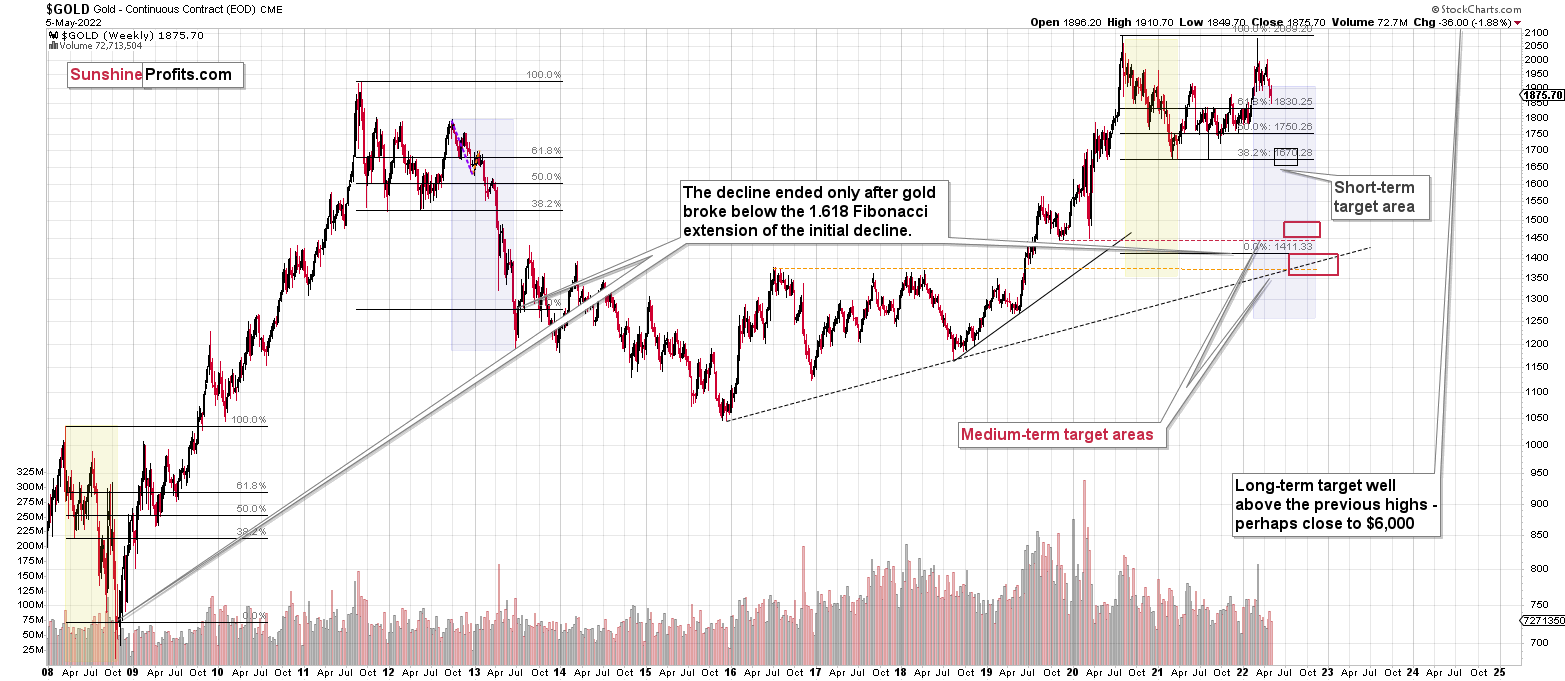
Please note that the above timing details are relatively broad and “for general overview only” – so that you know more or less what I think and how volatile I think the moves are likely to be – on an approximate basis. These time targets are not binding or clear enough for me to think that they should be used for purchasing options, warrants or similar instruments.
Letters to the Editor
Q: I am in DUST and JDST now. Would you buy any more short positions today?
A: I am not increasing my short position today and I don’t expect to increase it soon. I expect to exit it and go long junior miners soon, and then to return to the short position after the rebound.
Please note that I’m not saying what you should do, only what my approach is. I can’t tell anyone what they should do with their money, because: a) I don’t know your investment goals, risk tolerance/preference, etc., and b) I can’t provide investment advice and the above information could be viewed as such.
Summary
Summing up, it seems that we are about to see a short-term corrective upswing in the precious metals sector (after another very short-term move lower), even though the medium-term trend remains clearly down.
The medium-term downtrend is likely to continue shortly (perhaps after a weekly or a few-day long correction). As investors are starting to wake up to the reality, the precious metals sector (particularly junior mining stocks) is declining sharply. Here are the key aspects of the reality that market participants have ignored:
- rising real interest rates,
- rising USD Index values.
Both of the aforementioned are the two most important fundamental drivers of the gold price. Since neither the USD Index nor real interest rates are likely to stop rising anytime soon (especially now that inflation has become highly political), the gold price is likely to fall sooner or later. Given the analogy to 2012 in gold, silver, and mining stocks, “sooner” is the more likely outcome.
It seems that our profits from short positions are going to become truly epic in the coming months.
For now, I’m adjusting the exit price levels. Please note that they are “binding exit prices”, which means that I think that exiting the short positions without an additional (manual) confirmation from me is a good idea. I think that once these short positions are closed, entering long ones (100% of the regular position size) is also a good idea. If one wants to use a leveraged ETF for this long trade, the JNUG might be worth considering. However, it seems that in most cases, simply using the GDXJ would be sufficient (I’m writing about 100% of the regular position size, not 200% or 300% as I am right now in the case of the short positions). Then again, it’s your capital, and you can do with it whatever you want and are comfortable with.
Of course, if you’re not comfortable with such short-term trading, you can ignore this quick trade and focus on the bigger downturn.
After the final sell-off (that takes gold to about $1,350-$1,500), I expect the precious metals to rally significantly. The final part of the decline might take as little as 1-5 weeks, so it's important to stay alert to any changes.
As always, we'll keep you – our subscribers – informed.
To summarize:
Trading capital (supplementary part of the portfolio; our opinion): Full speculative short positions (300% of the full position) in junior mining stocks are justified from the risk to reward point of view with the following binding exit profit-take price levels:
Mining stocks (price levels for the GDXJ ETF): binding profit-take exit price: $36.23; stop-loss: none (the volatility is too big to justify a stop-loss order in case of this particular trade)
Alternatively, if one seeks leverage, we’re providing the binding profit-take levels for the JDST (2x leveraged) and GDXD (3x leveraged – which is not suggested for most traders/investors due to the significant leverage). The binding profit-take level for the JDST: $11.98; stop-loss for the JDST: none (the volatility is too big to justify a SL order in case of this particular trade); binding profit-take level for the GDXD: $15.98; stop-loss for the GDXD: none (the volatility is too big to justify a SL order in case of this particular trade).
For-your-information targets (our opinion; we continue to think that mining stocks are the preferred way of taking advantage of the upcoming price move, but if for whatever reason one wants / has to use silver or gold for this trade, we are providing the details anyway.):
Silver futures downside profit-take exit price: no position (the target was already reached)
SLV profit-take exit price: no position (the target was already reached)
ZSL profit-take exit price: no position (the target was already reached)
Gold futures downside profit-take exit price: no position (the target was already reached)
HGD.TO – alternative (Canadian) inverse 2x leveraged gold stocks ETF – the upside profit-take exit price: $7.78
HZD.TO – alternative (Canadian) inverse 2x leveraged silver ETF – the upside profit-take exit price: no position (the target was already reached)
Long-term capital (core part of the portfolio; our opinion): No positions (in other words: cash
Insurance capital (core part of the portfolio; our opinion): Full position
Whether you already subscribed or not, we encourage you to find out how to make the most of our alerts and read our replies to the most common alert-and-gold-trading-related-questions.
Please note that we describe the situation for the day that the alert is posted in the trading section. In other words, if we are writing about a speculative position, it means that it is up-to-date on the day it was posted. We are also featuring the initial target prices to decide whether keeping a position on a given day is in tune with your approach (some moves are too small for medium-term traders, and some might appear too big for day-traders).
Additionally, you might want to read why our stop-loss orders are usually relatively far from the current price.
Please note that a full position doesn't mean using all of the capital for a given trade. You will find details on our thoughts on gold portfolio structuring in the Key Insights section on our website.
As a reminder - "initial target price" means exactly that - an "initial" one. It's not a price level at which we suggest closing positions. If this becomes the case (like it did in the previous trade), we will refer to these levels as levels of exit orders (exactly as we've done previously). Stop-loss levels, however, are naturally not "initial", but something that, in our opinion, might be entered as an order.
Since it is impossible to synchronize target prices and stop-loss levels for all the ETFs and ETNs with the main markets that we provide these levels for (gold, silver and mining stocks - the GDX ETF), the stop-loss levels and target prices for other ETNs and ETF (among other: UGL, GLL, AGQ, ZSL, NUGT, DUST, JNUG, JDST) are provided as supplementary, and not as "final". This means that if a stop-loss or a target level is reached for any of the "additional instruments" (GLL for instance), but not for the "main instrument" (gold in this case), we will view positions in both gold and GLL as still open and the stop-loss for GLL would have to be moved lower. On the other hand, if gold moves to a stop-loss level but GLL doesn't, then we will view both positions (in gold and GLL) as closed. In other words, since it's not possible to be 100% certain that each related instrument moves to a given level when the underlying instrument does, we can't provide levels that would be binding. The levels that we do provide are our best estimate of the levels that will correspond to the levels in the underlying assets, but it will be the underlying assets that one will need to focus on regarding the signs pointing to closing a given position or keeping it open. We might adjust the levels in the "additional instruments" without adjusting the levels in the "main instruments", which will simply mean that we have improved our estimation of these levels, not that we changed our outlook on the markets. We are already working on a tool that would update these levels daily for the most popular ETFs, ETNs and individual mining stocks.
Our preferred ways to invest in and to trade gold along with the reasoning can be found in the how to buy gold section. Furthermore, our preferred ETFs and ETNs can be found in our Gold & Silver ETF Ranking.
As a reminder, Gold & Silver Trading Alerts are posted before or on each trading day (we usually post them before the opening bell, but we don't promise doing that each day). If there's anything urgent, we will send you an additional small alert before posting the main one.
Thank you.
Przemyslaw Radomski, CFA
Founder, Editor-in-chief

