

Briefly: in our opinion, full (300% of the regular position size) speculative short positions in junior mining stocks are justified from the risk/reward point of view at the moment of publishing this Alert.
Last week’s powerful, huge-volume reversal in gold was likely to be followed by declines. It was – but that’s just the beginning.
Yesterday’s $24 decline might seem significant on a day-to-day basis, but compared to last week’s enormous reversal, it’s really tiny.
The modest extent of yesterday’s decline is by no means bullish – my emphasis on the small size of the decline so far should be viewed as an indication that much more is likely on the horizon. Besides, gold was down by about $20 in today’s pre-market trading.
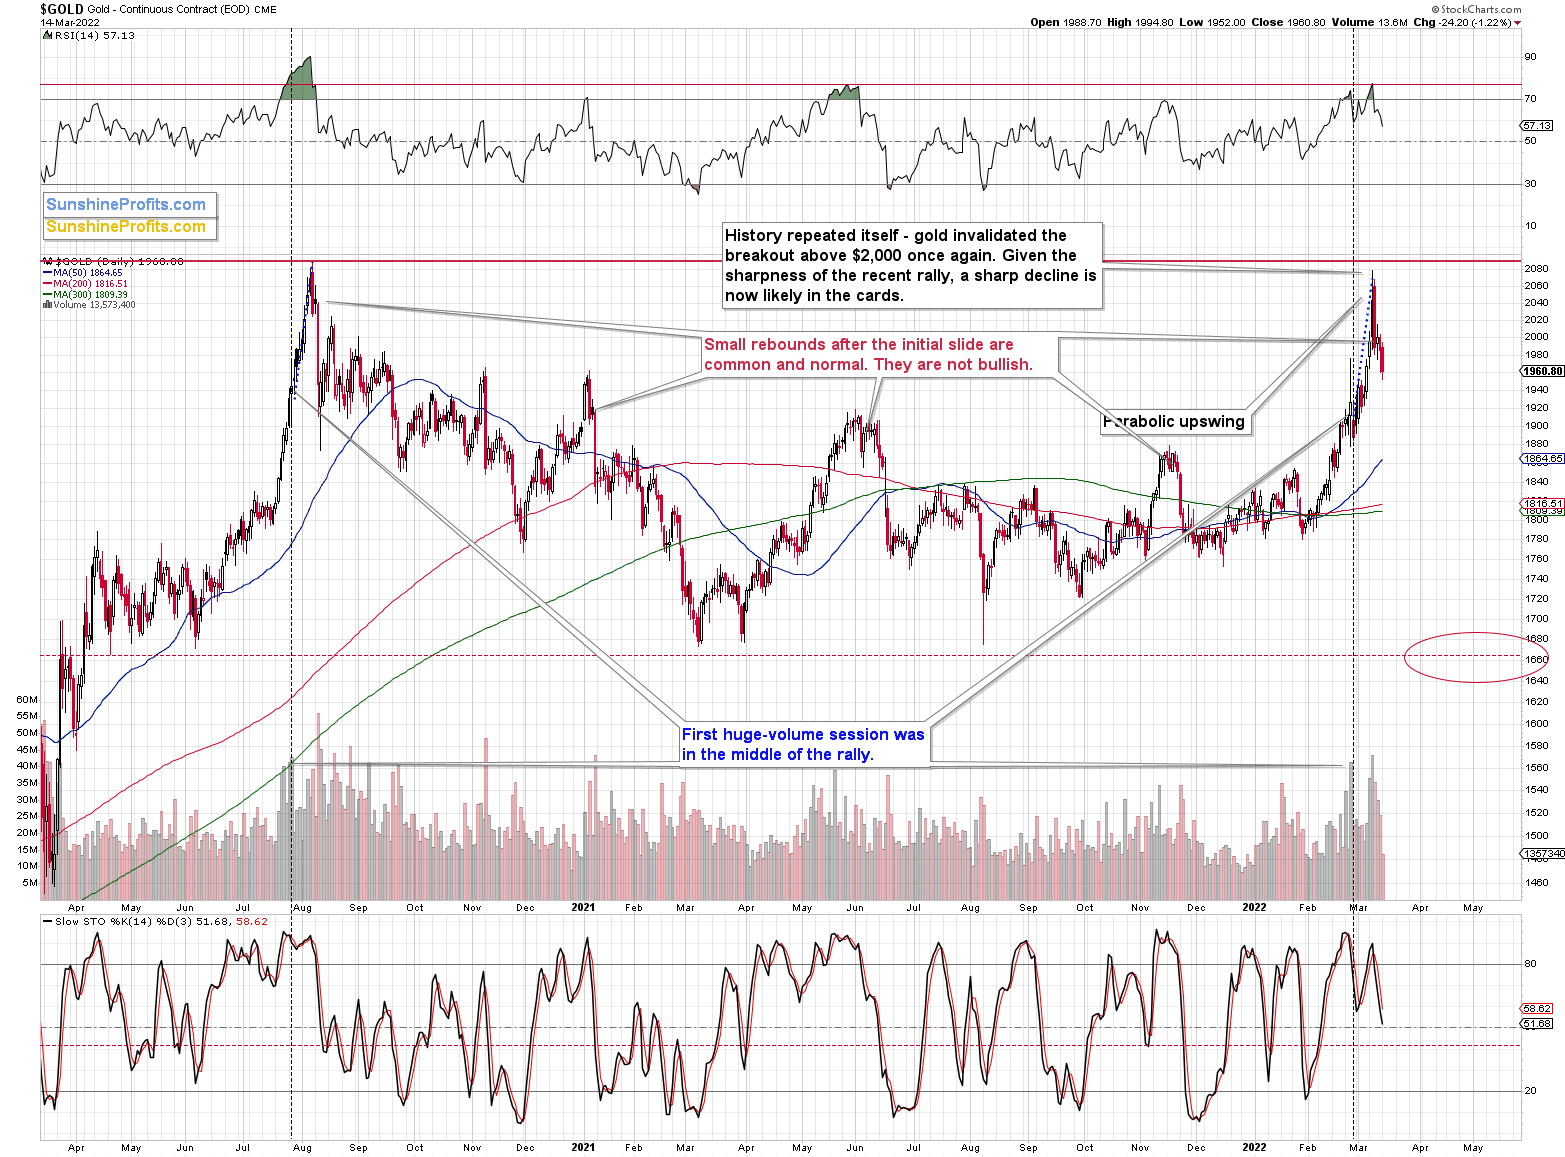
As I wrote yesterday, gold’s breakout above $2,000 was officially invalidated, and given the weekly reversal, it seems that the war-uncertainty-based rally is over.
The decisive move below 70 in the RSI indicator after it was trading above 70 clearly confirms that the top is already behind us. Just like it was in 2020 and 2021 when similar things happened, history appears to have rhymed.
On Friday, I wrote the following:
Gold’s move of $0.40 (yes, forty cents) above $2,000 is not important as the breakout above this level was just invalidated the previous day. Technically, this is another attempt to break above this level, which is likely to be invalidated based on what we see in today’s pre-market trading.
The fact that I would like to emphasize today is that this kind of small rebound after the initial slide is common and perfectly normal for gold. We saw exactly the same thing right after gold’s 2020 top and after its 2021 top, and also two more times in 2021 (as marked on the above chart).
This means that yesterday’s upswing is not particularly bullish. It’s a normal post-top reaction. Lower gold values are to be expected.
Silver declined yesterday, and it closed the day below its late-2021 high.
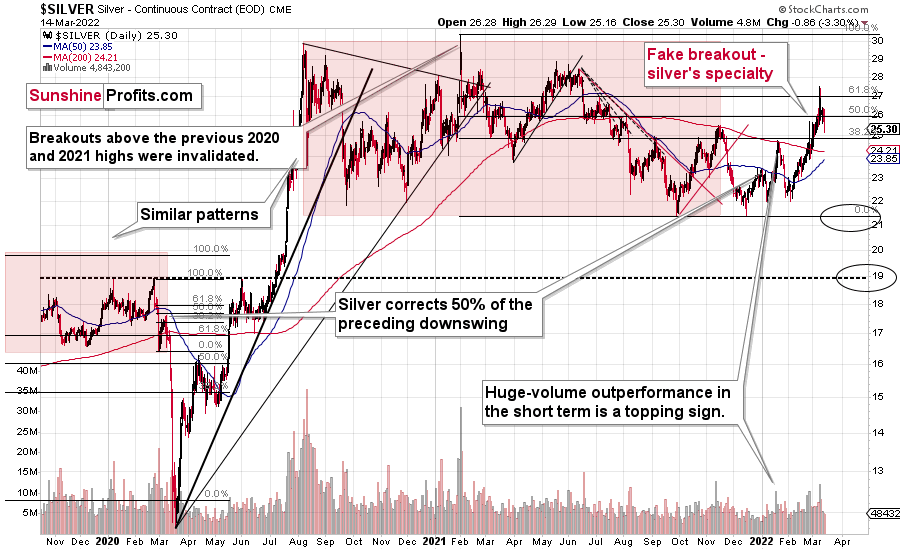
In other words, the breakout above this level was invalidated. This is a strong bearish confirmation from the white metal.
The white metal just invalidated the move above its 61.8% Fibonacci retracement.
That’s bearish on its own, but let’s keep in mind that it happened right after silver outperformed gold.
Last Tuesday, the GDXJ ETF was up by less than 1%, gold was up by 2.37%, and silver was up by 4.57%. Silver’s outperformance and miners’ underperformance is what we tend to see right at the tops. That’s exactly what it was – a top. Silver declined profoundly, and the attempt to break above its 61.8% Fibonacci retracement level will soon be just a distant (in terms of price) memory.
On a medium-term basis, silver was simply weak relative to gold, but we saw short-term outperformance. In short, that was and continues to be bearish.
As far as silver’s big picture is concerned, please note that it also provides us with a confirmation of the analogy between 2012 and now.
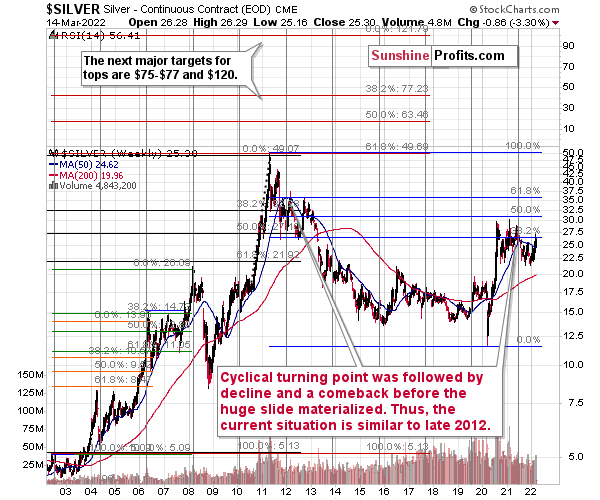
At the turn of the year in 2011/2012, there was a cyclical turning point in silver, and we saw a sizable decline in silver shortly thereafter. The same happened in 2021, after silver’s cyclical turning point.
Back in 2012, silver declined more or less to its previous lows and then rallied back up, but it didn’t reach its previous top. It more or less rallied to its 50-week moving average and then by about the same amount before topping.
Recently, we saw exactly the same thing. After the initial decline, silver bottomed close to its previous lows, and most recently it rallied to its 50-week moving average and then by about the same amount before topping – below the previous high.
Thus, the situation is just like what it was during the 2012 top in all three key components of the precious metals sector: gold, silver, and mining stocks.
We have a situation in the general stock market that points to an even quicker slide than what we saw in 2012-2013. If stocks slide sharply and significantly just like in 2008, then the same fate may await the precious metals sector – just like in 2008. In this case, silver and mining stocks (in particular, junior mining stocks) would be likely to fall in a spectacular manner.
All the above was confirmed by silver’s invalidation of its breakout above the late-2021 high. Not only has the medium-term outlook been bearish, but now the short-term outlook for silver is bearish too.
Just like silver, junior mining stocks just invalidated their recent move above their late-2021 top.
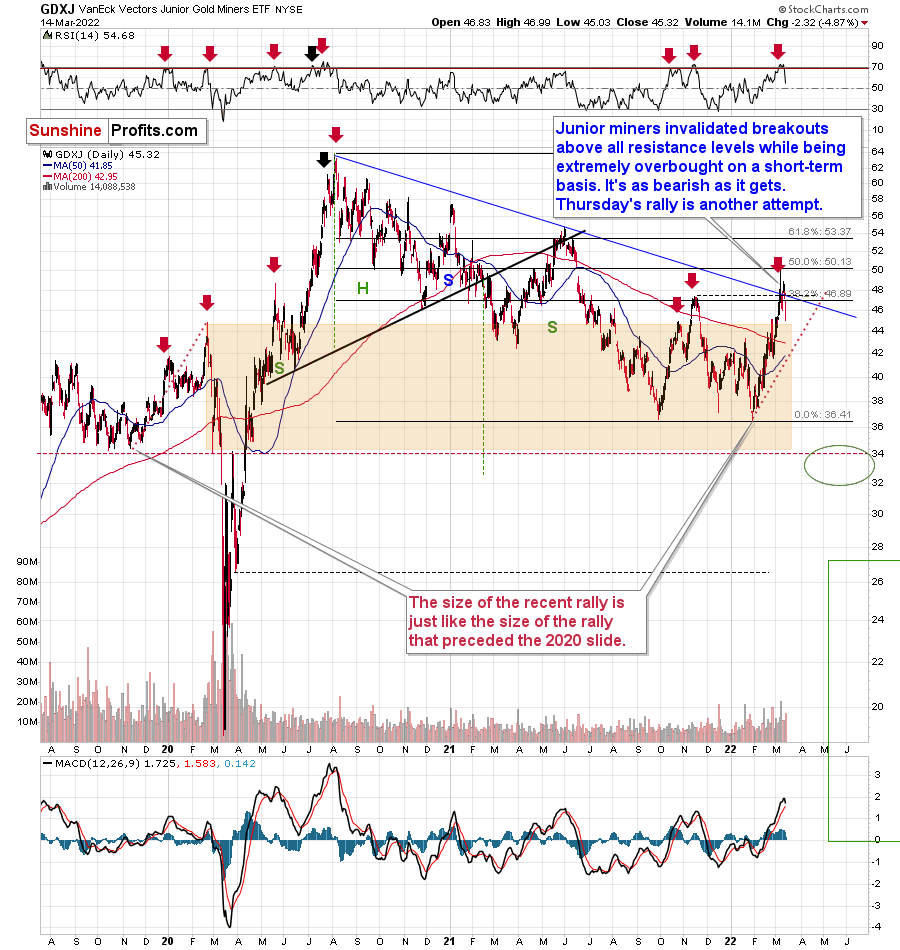
In the case of junior miners, we also saw a decisive move – and a daily close – below the declining medium-term resistance line.
It’s also the invalidation of a move above the 38.2% Fibonacci retracement based on the 2020-2022 decline.
Yes, all those invalidations are bearish. This is particularly the case, since the RSI just moved below 70, which is one of the things that usually confirms that the final top for a given rally is already in.
Now, if we zoom in even further, we’ll see that miners moved to their very short-term rising support line.
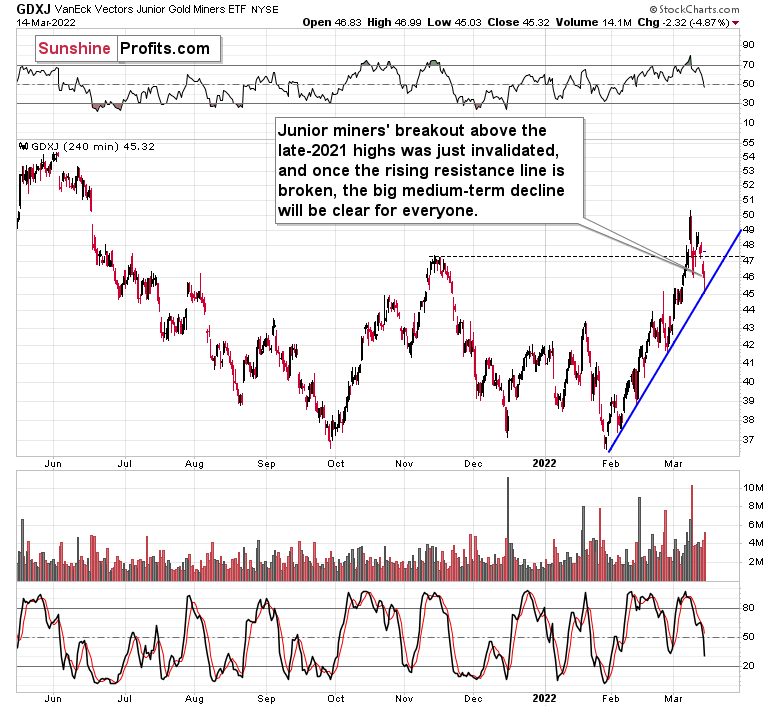
This means that it won’t be that odd if we see some kind of breather right now, before the decline continues.
Given that the Fed’s interest rate decision and the following press conference are scheduled for Wednesday, it would be rather normal to see the markets’ hesitation on Tuesday. There might be some immediate-term volatility, but the big moves might wait for the interest rate decision.
Whatever that decision is, when the dust settles, junior miners are likely to decline further.
Speaking of that decision, I would like to quote what I wrote about the likely incoming rate hike in yesterday’s Gold & Silver Trading Alert:
Why do I think that the Fed will want to tighten the inflation screw in a significant manner? Because it got political – simple as that. Biden’s approval numbers were hit hard as inflation hit the wallets of U.S. voters. He tries to blame it all on Putin, but people remember that the problem existed well before Russia’s invasion. Besides, even if people blame this on Putin, they will likely still request that inflation be handled. Thus, the Fed will be pressured to act. The markets are already pricing in a 0.25% hike this week, so if the Fed wants to really change anything and show that they are “actively doing something,” they might even hike by 0.5%.
Declining gold prices would also imply that inflation is getting under control, don’t you think? So, the former might be “politically useful”, and I wouldn’t be surprised to see wide price swings to the downside “proving” how well Biden is handling everything.
To prove my point, here’s a chart from Google Trends showing the popularity of searches for “inflation” in the U.S. since 2004.
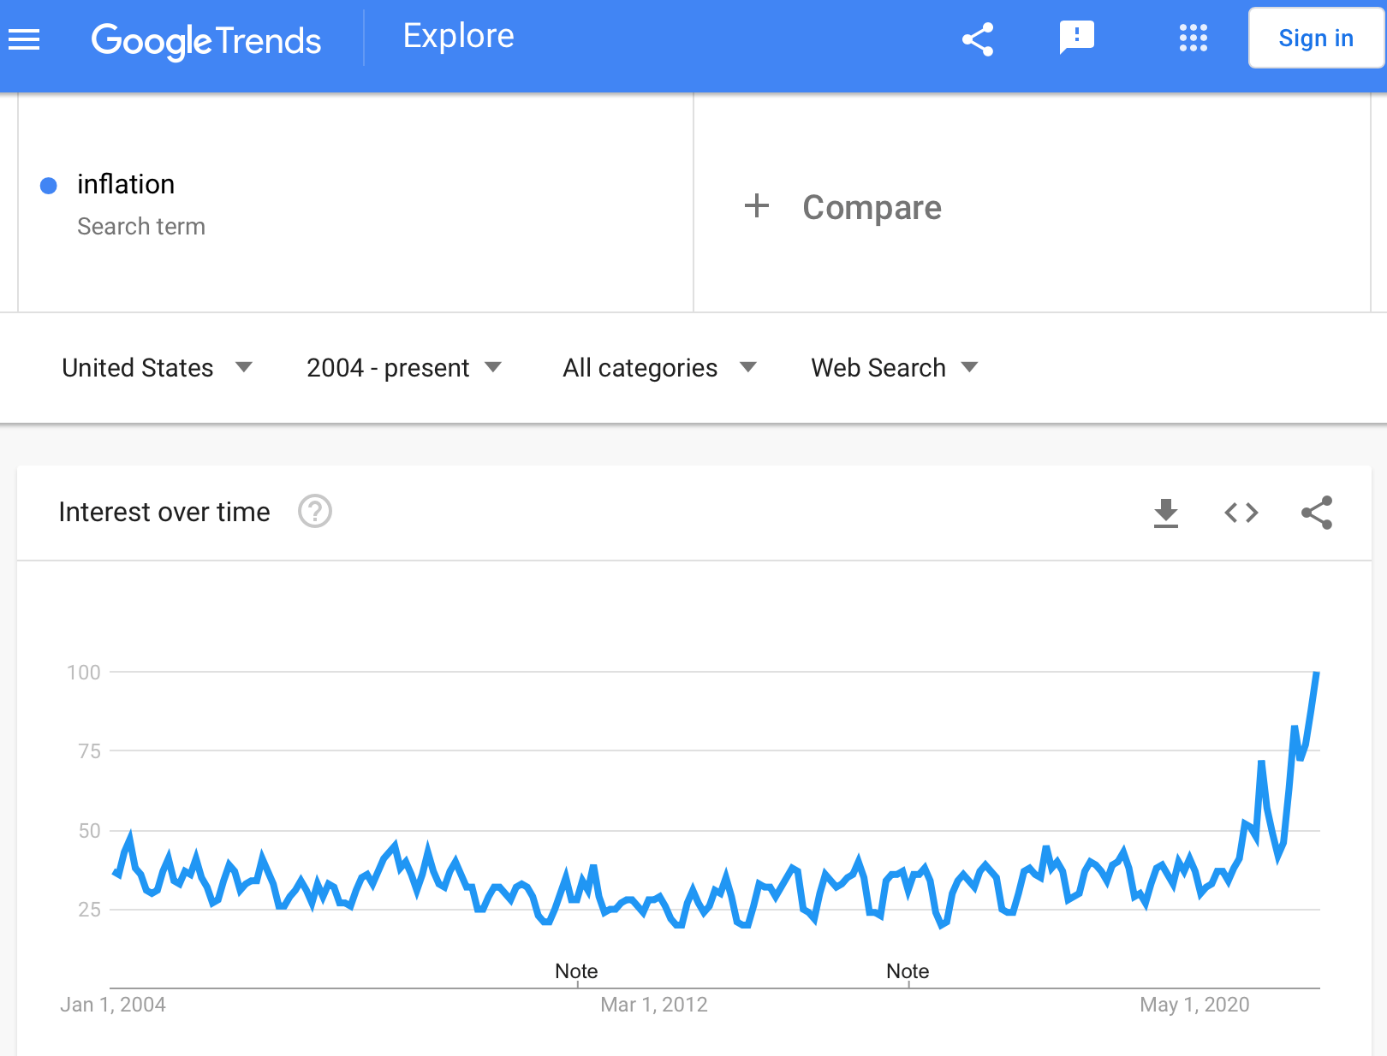
People are more concerned about inflation than they’ve been in a long time. If I was able to get this data in just a few minutes, the government officials would definitely be well aware of that too. This means that the Fed might want to raise interest rates faster and more significantly than many expect.
The stock market will most likely tank in this case, but this can now easily be blamed on Putin. So, this looks like a great opportunity (from the administration’s point of view) to raise interest rates significantly and frequently. The implications would be very bearish for the precious metals market.
Having said that, let’s take a look at other fundamental matters.
Reversion to the Mean
While the PMs enjoyed war premiums and investors’ unabated demand for commodities in recent weeks, the gambit is starting to unravel. To explain, I warned previously that the S&P Goldman Sachs Commodity Index (S&P GSCI) could act as the fundamental canary in the coal mine.
For context, the S&P GSCI contains 24 commodities from all sectors: six energy products, five industrial metals, eight agricultural products, three livestock products, and two precious metals. However, energy accounts for roughly 54% of the index’s movement.
I wrote on Mar. 8:
With commodities running wild amid the Russia-Ukraine conflict, the S&P GSCI has become the new FAANG. And with gold, silver and mining stocks riding the momentum higher, profound pain should confront the PMs when the all-time outperformance reverses.
Please see below:
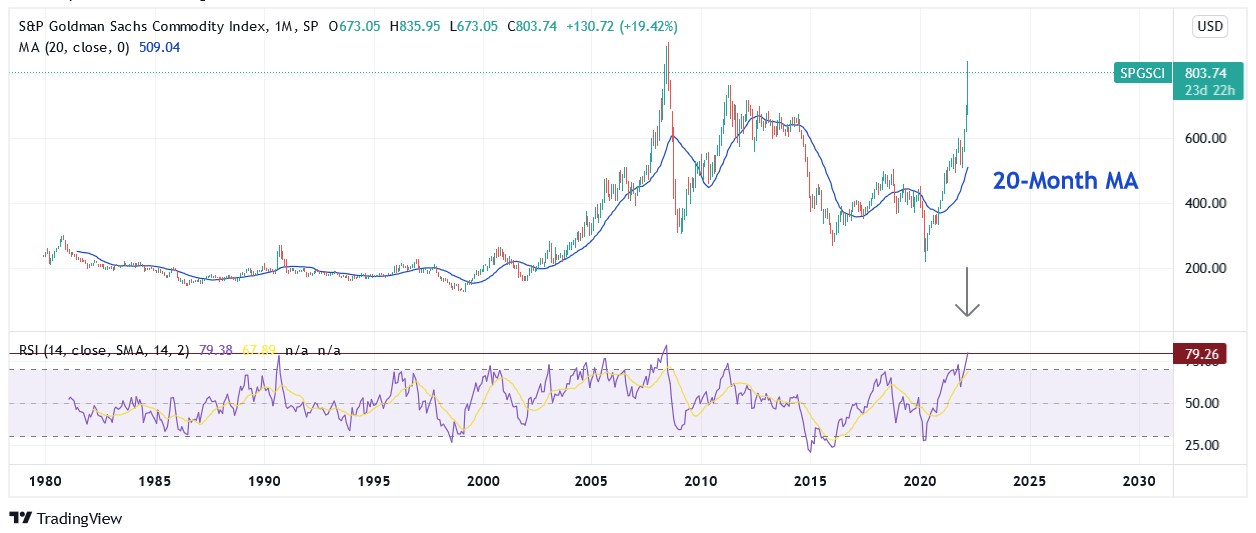
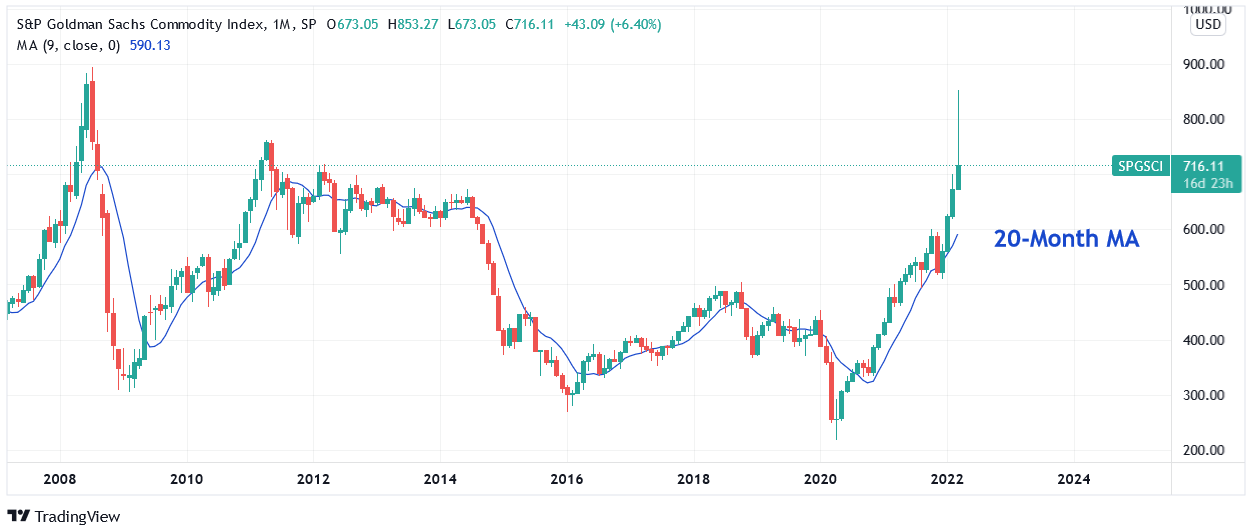
To that point, with the S&P GSCI declining by another 3.34% on Mar. 14, the PMs have mirrored the negativity. Moreover, even though the index has fallen from a high of ~853 and closed at ~716 on Mar. 14, the gap between the current price and the 20-month moving average remains abundant. As a result, there is still plenty of room to move lower.
Please see below:
Furthermore, I noted above that energy accounts for roughly 54% of the S&P GSCI’s movement. Since Russia is the third-largest oil-producing country globally, Brent and WTI have been the greatest beneficiaries of the Russia-Ukraine conflict. However, with Deutsche Bank’s fair value model implying a WTI price of $61.20, another sharp drop in the S&P GSCI could occur sooner rather than later.
Please see below:
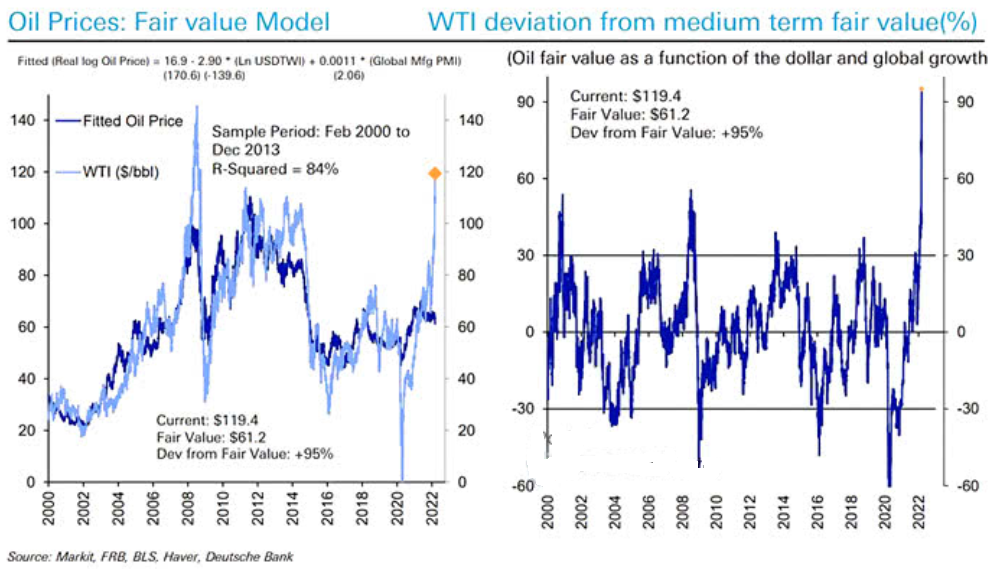
To explain, the light blue line on the left chart above tracks the WTI oil price, while the dark blue line tracks Deutsche Bank’s fair value model price. For context, the chart was created when WTI was trading at $119.40. However, if you analyze the gap between the light blue line and the dark blue line, you can see that crude prices have materially outperformed due to the Russia-Ukraine conflict. Likewise, if you analyze the chart on the right, you can see that a WTI price of $119.40 is 95% higher than the model-implied price of $61.20.
Moreover, with the model showcasing an r-squared of 0.84 (correlation of ~0.92), it’s been a reliable predictor of future oil prices. With WTI, the S&P GSCI, and the PMs all benefiting from the same geopolitical risk trade, a reversion to the mean could profoundly impact them all.
Furthermore, with the geopolitical risk premium completely wiped out of the bond market, fixed-income investors are looking past the current conflict. For context, I wrote on Mar. 14:
The policy mix is extremely bullish for the USD Index and the U.S. 10-Year Treasury yield. And with the latter rallying back to 2% on Mar. 11, its geopolitical risk premium has already been erased. As a result, the PMs should suffer similar fates over the medium term.
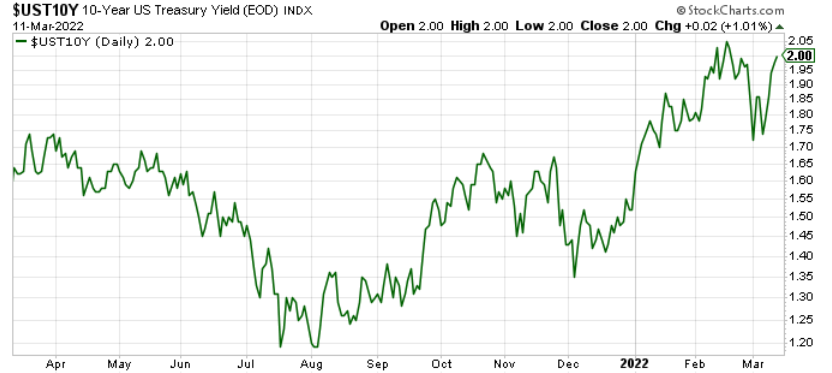
To that point, with the U.S. 10-Year Treasury yield closing at a new 2022 high of 2.14% on Mar. 14, the entire U.S. yield curve rallied sharply:
Please see below:
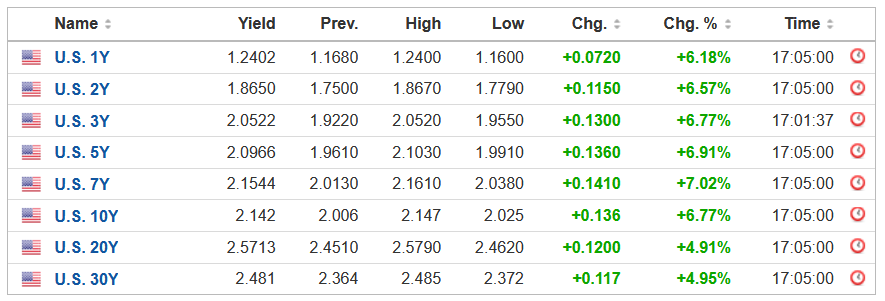 Source: Investing.com
If that wasn’t enough, I’ve warned on numerous occasions that investor psychology often forces people to buy high and sell low. To explain, I wrote on Mar. 3:
It's important to remember that investors are often the most bullish at the top and the most bearish at the bottom. Because human nature doesn't change, is this time really different?
Please see below:
 Source: Commitment of Traders (COT) report
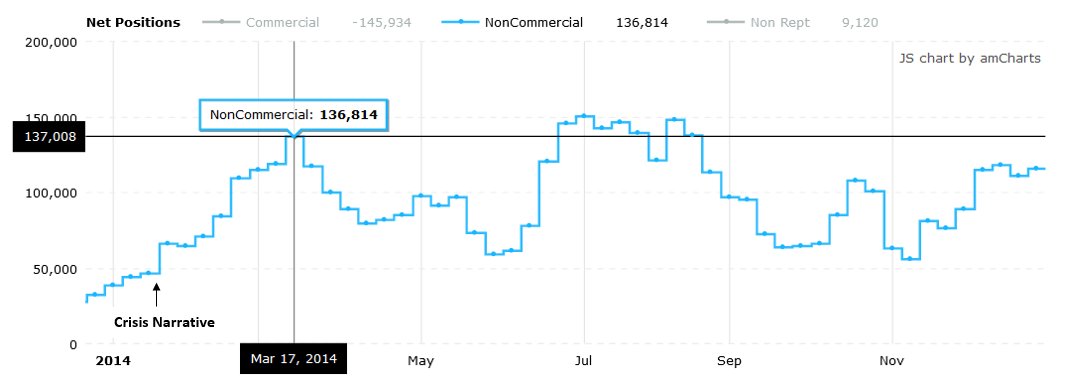
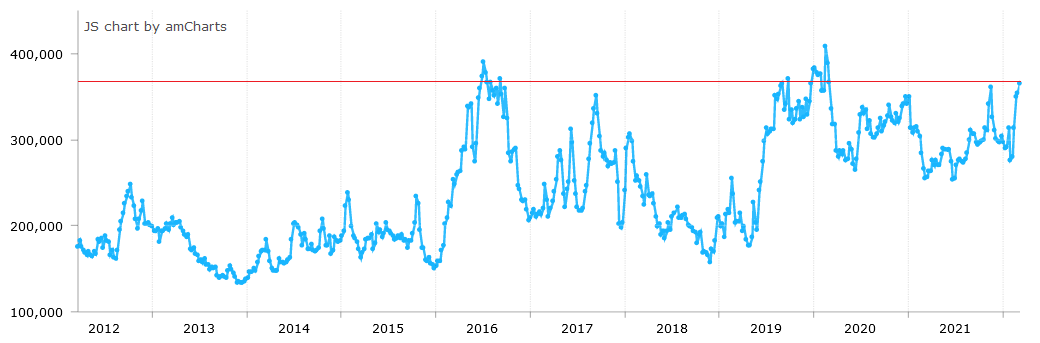
Let's analyze how the price action and positioning in 2014 compares to 2022. As mentioned, gold futures' intraday trough-to-peak rallies are quite similar. Moreover, the behavior of speculative futures traders is nearly identical. For example, with investors tripping over themselves to go long the yellow metal, speculative net-futures positioning has spiked since the beginning of February. Since momentum begets momentum, the crisis narrative has investors piling into gold futures like in 2014.
Moreover, with peak speculative positioning coinciding with peak gold back then, it's another indicator that we're likely much closer to the top than the bottom (if it hasn't already topped).
To provide another update, it’s clear that human nature never changes. If you analyze the chart below, you can see that non-commercial (speculative) futures traders were all-in on gold at the end of last week (the latest data available).
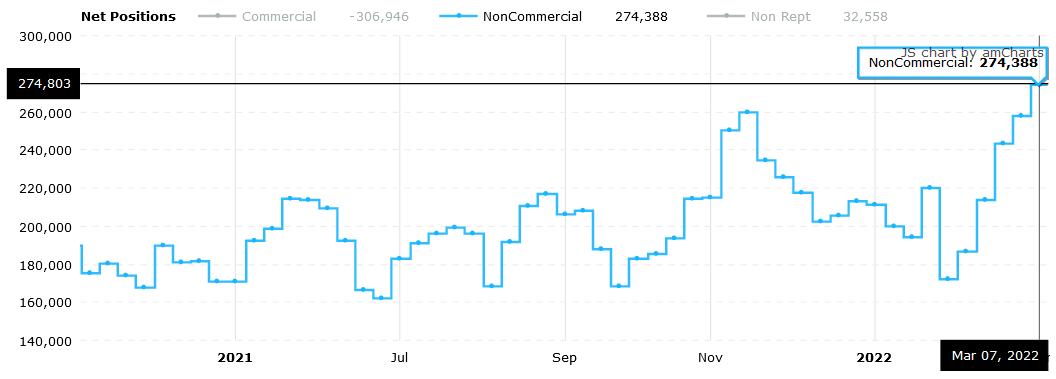 Source: COT report
Moreover, with speculative long positions increasing materially in recent weeks, and the crowd often the most bullish at the top, it’s another contrarian indicator that supports lower gold prices over the medium term.
Please see below:
 Source: COT report
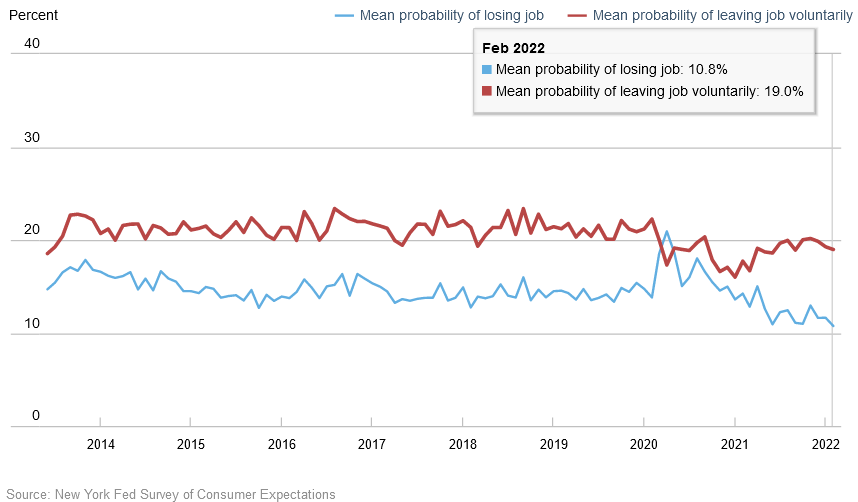
Turning to the economic climate, the doomsday narrative uplifting the PMs and throwing cold water on the U.S. economy has also helped underwrite gold, silver and mining stocks’ ascent. However, the New York Fed released its Survey of Consumer Expectations on Mar. 14. The report revealed:
“The mean perceived probability of losing one’s job in the next 12 months declined by 0.8 percentage point to 10.8%, reaching a new series low. The mean probability of leaving one’s job voluntarily in the next 12 months also decreased to 18.9% from 19.3%.”
Please see below:
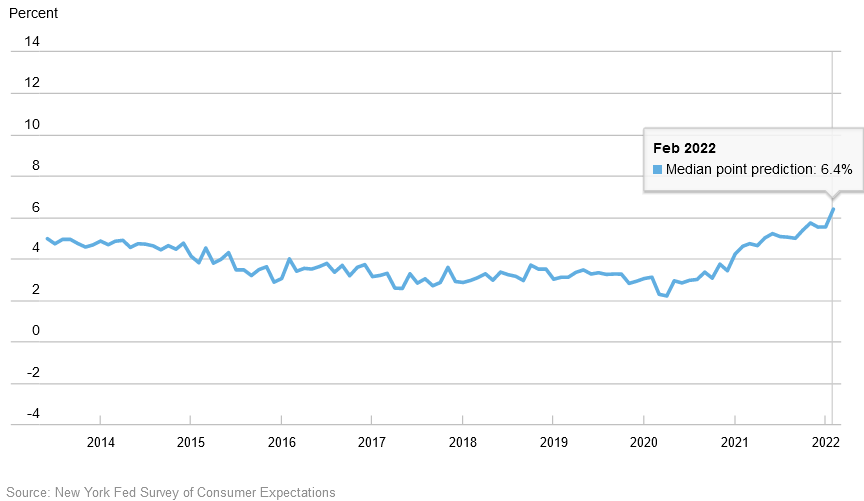
In addition:
“Median year-ahead household spending growth expectations increased sharply to 6.4% from 5.5% in January, reaching a new series high since the start of the series in June 2013. The increase was broad-based across age, income, and education groups.”
Please see below:
Furthermore:
“Median one-year-ahead inflation expectations increased to 6.0% in February from 5.8% in January, matching its November 2021 series’ high. The increase was widespread across age, education, and income groups, but largest for the respondents without a high school degree. After a sharp decline in January, median three-year ahead inflation expectations ticked up by 0.3 percentage point to 3.8%, while remaining below its November and December 2021 levels of 4.2% and 4.0%, respectively.”
Please see below:
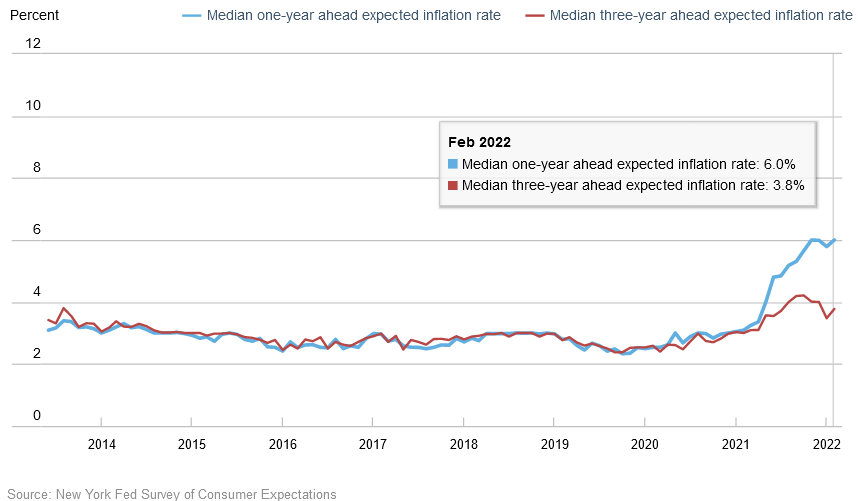
Thus, while I've been warning for some time that a strong U.S. economy is bullish for the USD Index and U.S. Treasury yields and bearish for the PMs, consumers continue to support the thesis. Whether it's Visa's U.S. Spending Momentum Index (SMI), the Chicago Fed's Weekly Index of Retail Trade projections, or the New York Fed's Survey of Consumer Expectations, plenty of data signals robust consumer spending.
Moreover, whether it's JOLTs job openings, U.S. nonfarm payrolls, or the New York Fed's Survey of Consumer Expectations, plenty of data also signals a robust labor market.
As a result, the cocktail of inflation, employment, and consumer spending is bullish for hawkish Fed policy and bearish for the PMs. Moreover, hawkish Fed policy is bullish for the USD Index and U.S. Treasury yields. Thus, while the PMs can hang their hats on the Russia-Ukraine conflict in the short term, their medium-term fundamentals continue to deteriorate.
Finally, it's important to remember that the EUR/USD accounts for nearly 58% of the USD Index's movement. With the Russia-Ukraine conflict having a larger fundamental impact on the Eurozone than the U.S., the developments should support the dollar basket over the medium term.
Please see below:
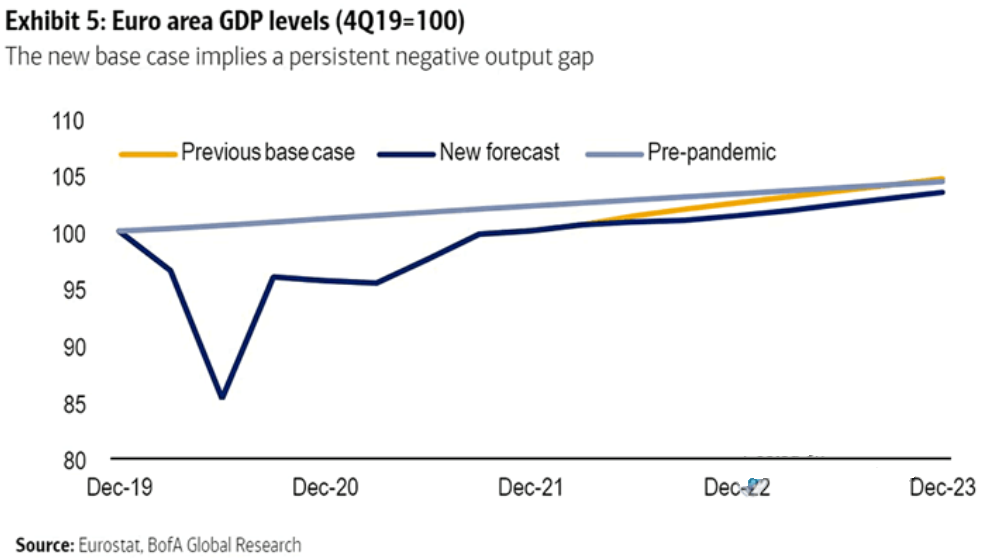
To explain, the light blue line above tracks the Eurozone's pre-pandemic GDP trend, while the orange line above tracks Bank of America's old forecast for when the region would reduce its output gap. For context, an output gap is the difference between realized and potential GDP.
Moreover, if you analyze the dark blue line above, you can see that Bank of America reduced its Eurozone GDP growth expectations and now projects that the region will remain below its pre-pandemic trend at the end of 2023. As a result, Eurozone economic underperformance is fundamentally bearish for the EUR/USD and bullish for the USD Index.
The bottom line? While the PMs have come down recently, there is still plenty of room to move lower. With the Fed set to raise interest rates on Mar. 16, and a healthy U.S. economy poised to elicit more rate hikes in the coming months, the PMs' medium-term outlooks remain precarious. Moreover, if the fundamental realization occurs alongside a resolution in the Russia-Ukraine conflict, the shift in sentiment could result in profound drawdowns.
In conclusion, the PMs declined on Mar. 14, as mean reversion has caught up to gold, silver, mining stocks, WTI and the S&P GSCI. Moreover, with overbought conditions still present, downside risk remains. As a result, while the Russia-Ukraine conflict delayed the PMs' likely slide, a reversal of fortunes should occur over the next few months.
Overview of the Upcoming Part of the Decline
- It seems to me that the corrective upswing is now over or very close to being over , and that gold, silver, and mining stocks are now likely to continue their medium-term decline.
- It seems that the first (bigger) stop for gold will be close to its previous 2021 lows, slightly below $1,700. Then it will likely correct a bit, but it’s unclear if I want to exit or reverse the current short position based on that – it depends on the number and the nature of the bullish indications that we get at that time.
- After the above-mentioned correction, we’re likely to see a powerful slide, perhaps close to the 2020 low ($1,450 - $1,500).
- If we see a situation where miners slide in a meaningful and volatile way while silver doesn’t (it just declines moderately), I plan to – once again – switch from short positions in miners to short positions in silver. At this time, it’s too early to say at what price levels this could take place, and if we get this kind of opportunity at all – perhaps with gold close to $1,600.
- I plan to exit all remaining short positions once gold shows substantial strength relative to the USD Index while the latter is still rallying. This may be the case with gold close to $1,350 - $1,400. I expect silver to fall the hardest in the final part of the move. This moment (when gold performs very strongly against the rallying USD and miners are strong relative to gold after its substantial decline) is likely to be the best entry point for long-term investments, in my view. This can also happen with gold close to $1,375, but at the moment it’s too early to say with certainty.
- As a confirmation for the above, I will use the (upcoming or perhaps we have already seen it?) top in the general stock market as the starting point for the three-month countdown. The reason is that after the 1929 top, gold miners declined for about three months after the general stock market started to slide. We also saw some confirmations of this theory based on the analogy to 2008. All in all, the precious metals sector is likely to bottom about three months after the general stock market tops.
- The above is based on the information available today, and it might change in the following days/weeks.
You will find my general overview of the outlook for gold on the chart below:
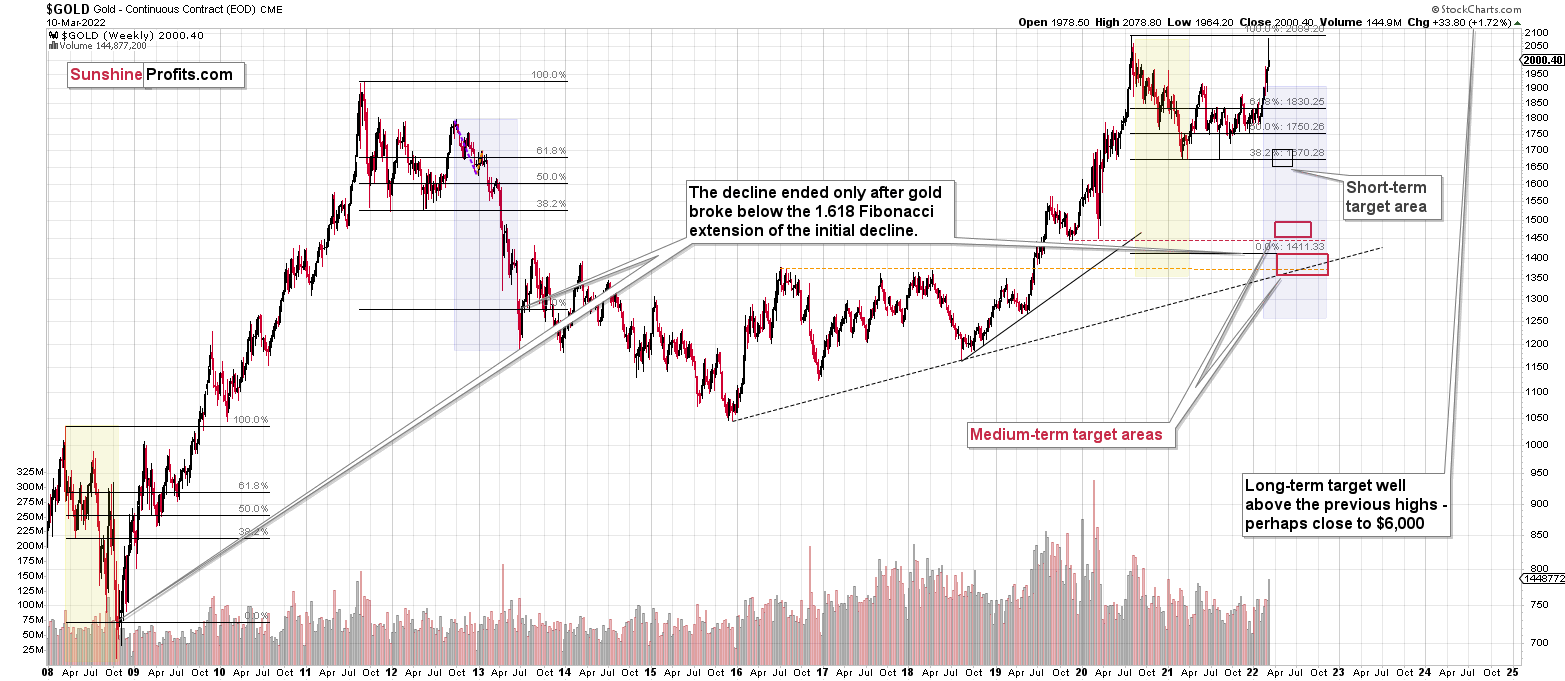
Please note that the above timing details are relatively broad and “for general overview only” – so that you know more or less what I think and how volatile I think the moves are likely to be – on an approximate basis. These time targets are not binding or clear enough for me to think that they should be used for purchasing options, warrants or similar instruments.
Summary
Summing up, despite the recent rally in gold, the outlook for junior mining stocks remains exactly as I described previously.
Crude oil’s extreme outperformance, the stock market’s weakness, and critical medium-term resistance levels reached by gold (all-time high!) and junior mining stocks, all indicate that the tops are at hand or have just formed. The huge-volume reversals in gold and (especially) mining stocks, along with silver’s short-term outperformance, all point to lower precious metals prices in the following days/weeks. It seems that the top is in.
Investing and trading are difficult. If it was easy, most people would be making money – and they’re not. Right now, it’s most difficult to ignore the urge to “run for cover” if you physically don’t have to. The markets move on “buy the rumor and sell the fact.” This repeats over and over again in many (all?) markets, and we have direct analogies to similar situations in gold itself. Junior miners are likely to decline the most, also based on the massive declines that are likely to take place (in fact, they have already started) in the stock markets.
From the medium-term point of view, the two key long-term factors remain the analogy to 2013 in gold and the broad head and shoulders pattern in the HUI Index. They both suggest much lower prices ahead.
It seems that our profits from short positions are going to become truly epic in the coming months.
After the sell-off (that takes gold to about $1,350-$1,500), I expect the precious metals to rally significantly. The final part of the decline might take as little as 1-5 weeks, so it's important to stay alert to any changes.
Most importantly, please stay healthy and safe. We made a lot of money last March and this March, and it seems that we’re about to make much more in the upcoming decline, but you have to be healthy to enjoy the results.
As always, we'll keep you - our subscribers - informed.
To summarize:
Trading capital (supplementary part of the portfolio; our opinion): Full speculative short positions (300% of the full position) in junior mining stocks are justified from the risk to reward point of view with the following binding exit profit-take price levels:
Mining stocks (price levels for the GDXJ ETF): binding profit-take exit price: $34.63; stop-loss: none (the volatility is too big to justify a stop-loss order in case of this particular trade)
Alternatively, if one seeks leverage, we’re providing the binding profit-take levels for the JDST (2x leveraged) and GDXD (3x leveraged – which is not suggested for most traders/investors due to the significant leverage). The binding profit-take level for the JDST: $14.98; stop-loss for the JDST: none (the volatility is too big to justify a SL order in case of this particular trade); binding profit-take level for the GDXD: $25.48; stop-loss for the GDXD: none (the volatility is too big to justify a SL order in case of this particular trade).
For-your-information targets (our opinion; we continue to think that mining stocks are the preferred way of taking advantage of the upcoming price move, but if for whatever reason one wants / has to use silver or gold for this trade, we are providing the details anyway.):
Silver futures downside profit-take exit price: $19.12
SLV profit-take exit price: $17.72
ZSL profit-take exit price: $38.28
Gold futures downside profit-take exit price: $1,683
HGD.TO – alternative (Canadian) inverse 2x leveraged gold stocks ETF – the upside profit-take exit price: $11.79
HZD.TO – alternative (Canadian) inverse 2x leveraged silver ETF – the upside profit-take exit price: $29.48
Long-term capital (core part of the portfolio; our opinion): No positions (in other words: cash
Insurance capital (core part of the portfolio; our opinion): Full position
Whether you already subscribed or not, we encourage you to find out how to make the most of our alerts and read our replies to the most common alert-and-gold-trading-related-questions.
Please note that we describe the situation for the day that the alert is posted in the trading section. In other words, if we are writing about a speculative position, it means that it is up-to-date on the day it was posted. We are also featuring the initial target prices to decide whether keeping a position on a given day is in tune with your approach (some moves are too small for medium-term traders, and some might appear too big for day-traders).
Additionally, you might want to read why our stop-loss orders are usually relatively far from the current price.
Please note that a full position doesn't mean using all of the capital for a given trade. You will find details on our thoughts on gold portfolio structuring in the Key Insights section on our website.
As a reminder - "initial target price" means exactly that - an "initial" one. It's not a price level at which we suggest closing positions. If this becomes the case (like it did in the previous trade), we will refer to these levels as levels of exit orders (exactly as we've done previously). Stop-loss levels, however, are naturally not "initial", but something that, in our opinion, might be entered as an order.
Since it is impossible to synchronize target prices and stop-loss levels for all the ETFs and ETNs with the main markets that we provide these levels for (gold, silver and mining stocks - the GDX ETF), the stop-loss levels and target prices for other ETNs and ETF (among other: UGL, GLL, AGQ, ZSL, NUGT, DUST, JNUG, JDST) are provided as supplementary, and not as "final". This means that if a stop-loss or a target level is reached for any of the "additional instruments" (GLL for instance), but not for the "main instrument" (gold in this case), we will view positions in both gold and GLL as still open and the stop-loss for GLL would have to be moved lower. On the other hand, if gold moves to a stop-loss level but GLL doesn't, then we will view both positions (in gold and GLL) as closed. In other words, since it's not possible to be 100% certain that each related instrument moves to a given level when the underlying instrument does, we can't provide levels that would be binding. The levels that we do provide are our best estimate of the levels that will correspond to the levels in the underlying assets, but it will be the underlying assets that one will need to focus on regarding the signs pointing to closing a given position or keeping it open. We might adjust the levels in the "additional instruments" without adjusting the levels in the "main instruments", which will simply mean that we have improved our estimation of these levels, not that we changed our outlook on the markets. We are already working on a tool that would update these levels daily for the most popular ETFs, ETNs and individual mining stocks.
Our preferred ways to invest in and to trade gold along with the reasoning can be found in the how to buy gold section. Furthermore, our preferred ETFs and ETNs can be found in our Gold & Silver ETF Ranking.
As a reminder, Gold & Silver Trading Alerts are posted before or on each trading day (we usually post them before the opening bell, but we don't promise doing that each day). If there's anything urgent, we will send you an additional small alert before posting the main one.
Thank you.
Przemyslaw Radomski, CFA
Founder, Editor-in-chief

