

Briefly: in our opinion, full (300% of the regular position size) speculative short positions in junior mining stocks are justified from the risk/reward point of view at the moment of publishing this Alert.
The precious metals just performed exactly as they were likely to. Despite the increase in war tensions, PMs and miners reversed instead of rallying, which indicated that the rally has probably run its course. Since the tensions can now (most likely) either decline or stabilize, gold and silver prices will presumably fall right away, or after a while, as the market starts paying attention to gold’s two key fundamental drivers:
- the USD Index
- the real interest rates.
Both are inversely correlated with the price of gold, and both are on the rise. It’s therefore most likely only a matter of time before gold declines, and the same goes for silver and mining stocks. In fact, silver and mining stocks are likely to fall harder than gold, as they’ve been very weak in recent years anyway. Let’s not forget that while gold moved above its 2011 highs, silver and miners are well below the 50% retracement from their respective 2011 highs.
Let’s check what gold did yesterday.
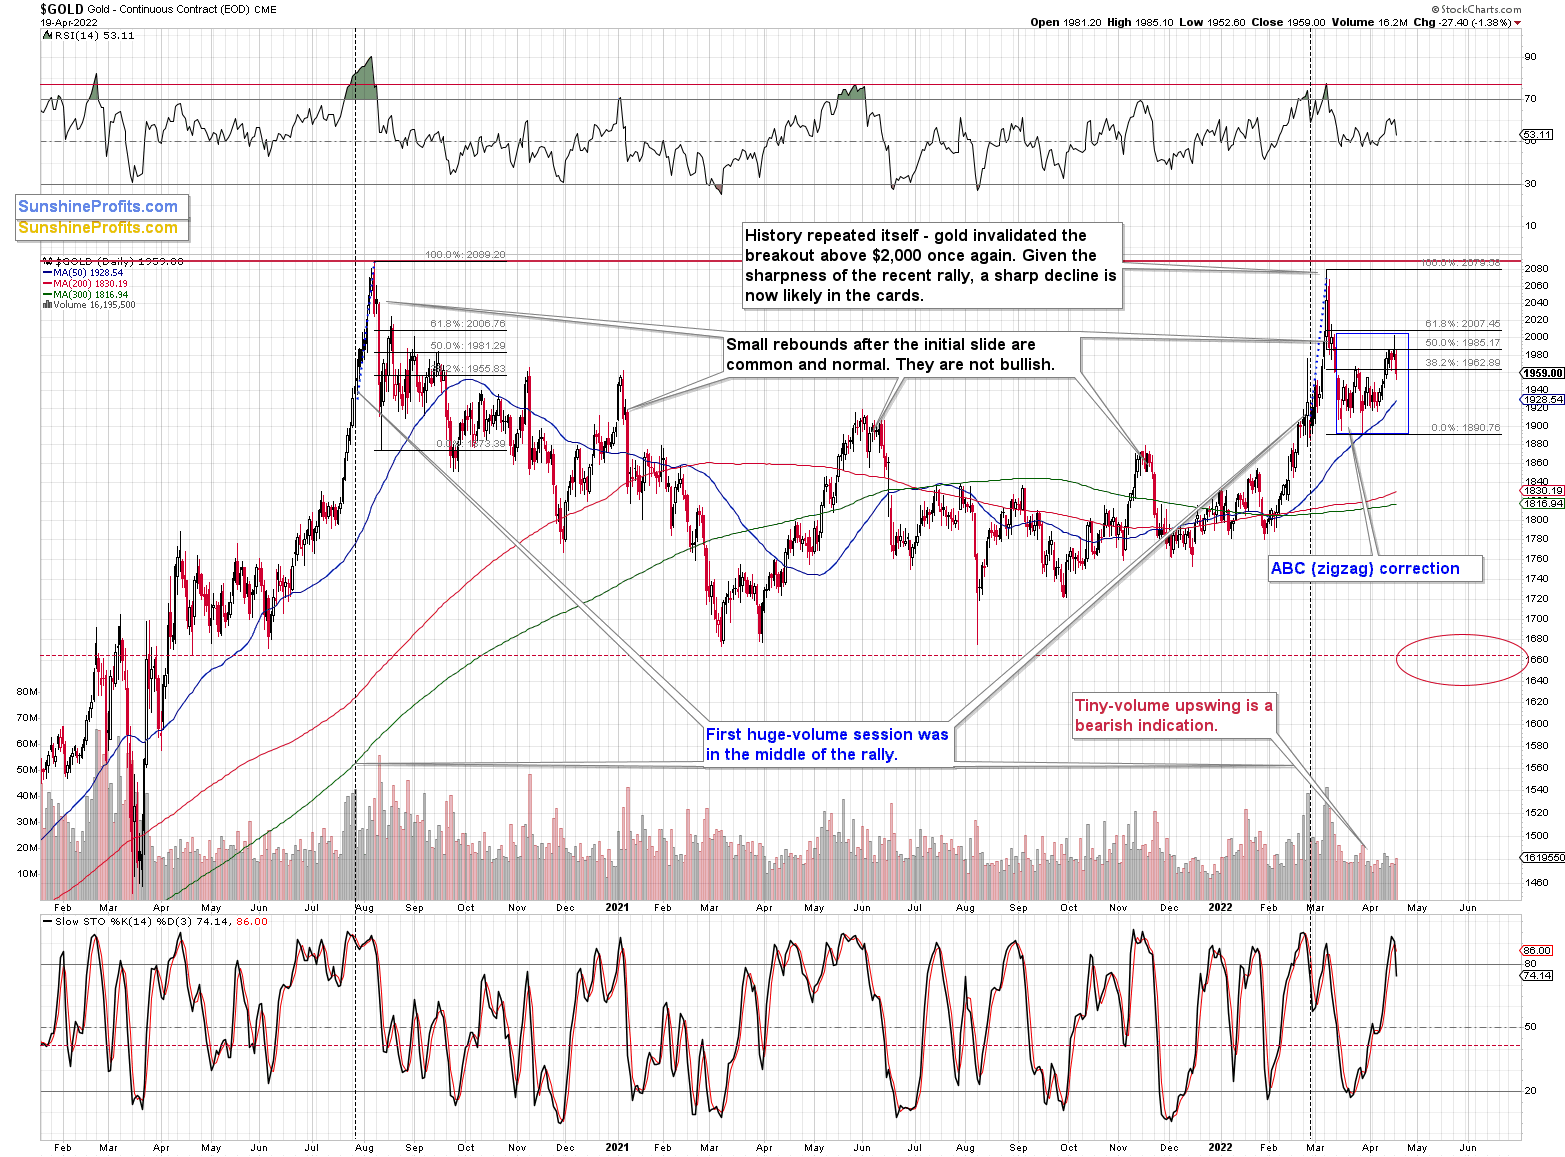
The gold price declined substantially, and it closed below its late-March 2022 high, thus invalidating the breakout above it. Instead of the breakout above $2,000, we saw the above. Instead of a bullish sign, we got a sell signal.
We also got another from the stochastic indicator that not only moved below its signal line, but also below the 80 level.
Moreover, let’s not forget that it all happened in tune with what we saw back in 2020, after gold’s major top.
Back then, gold retraced slightly more than 61.8% of the decline. Although this time it retraced slightly less, both cases are still very similar.
Consequently, this month’s recent upswing was not really bullish – it was a natural part of a bigger bearish pattern.
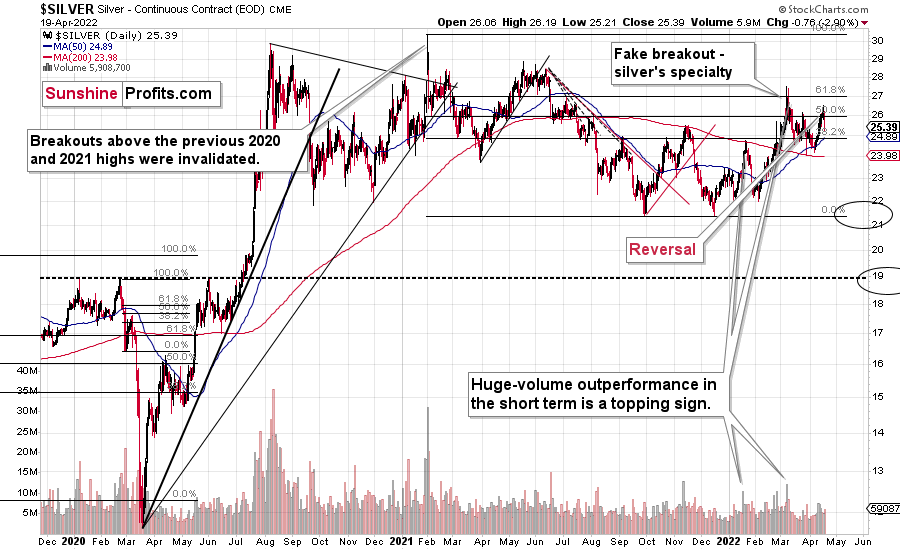
Just as gold reversed on Monday, so did silver. It also outperformed gold on a very short-term basis, which served as another bearish confirmation.
Silver’s outperformance of gold is often a sell signal, especially when it’s accompanied by mining stocks’ weakness, and we saw the latter too.
During yesterday’s trading, silver and junior miners were down rather similarly, but the latter had also been down on Monday, while silver had ended the session in the green.
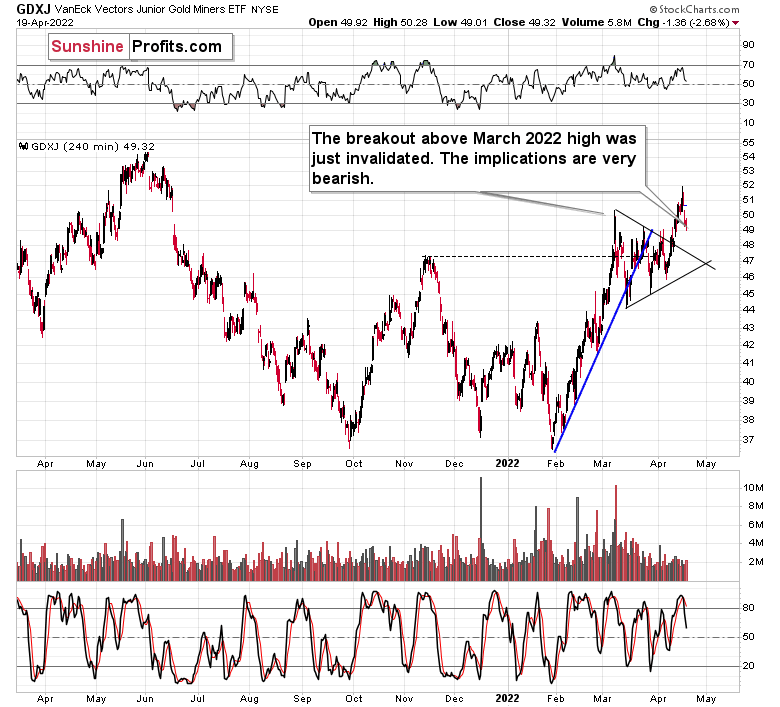
Also, miners just invalidated their breakout above the March 2022 high in terms of the closing prices. No wonder here – the attempt to rally above the previous highs was accompanied by rather weak volume, suggesting that it would fail.
It did, and that’s a sell sign on its own.
Consequently, the current outlook for the precious metals market appears bullish in the long run but bearish in the medium- and short term.
On a final note, I would like to once again (I already featured this yesterday, but it deserves to be repeated) draw your attention to the fact that, based on its recent strength, the USD Index managed to do something very profound.
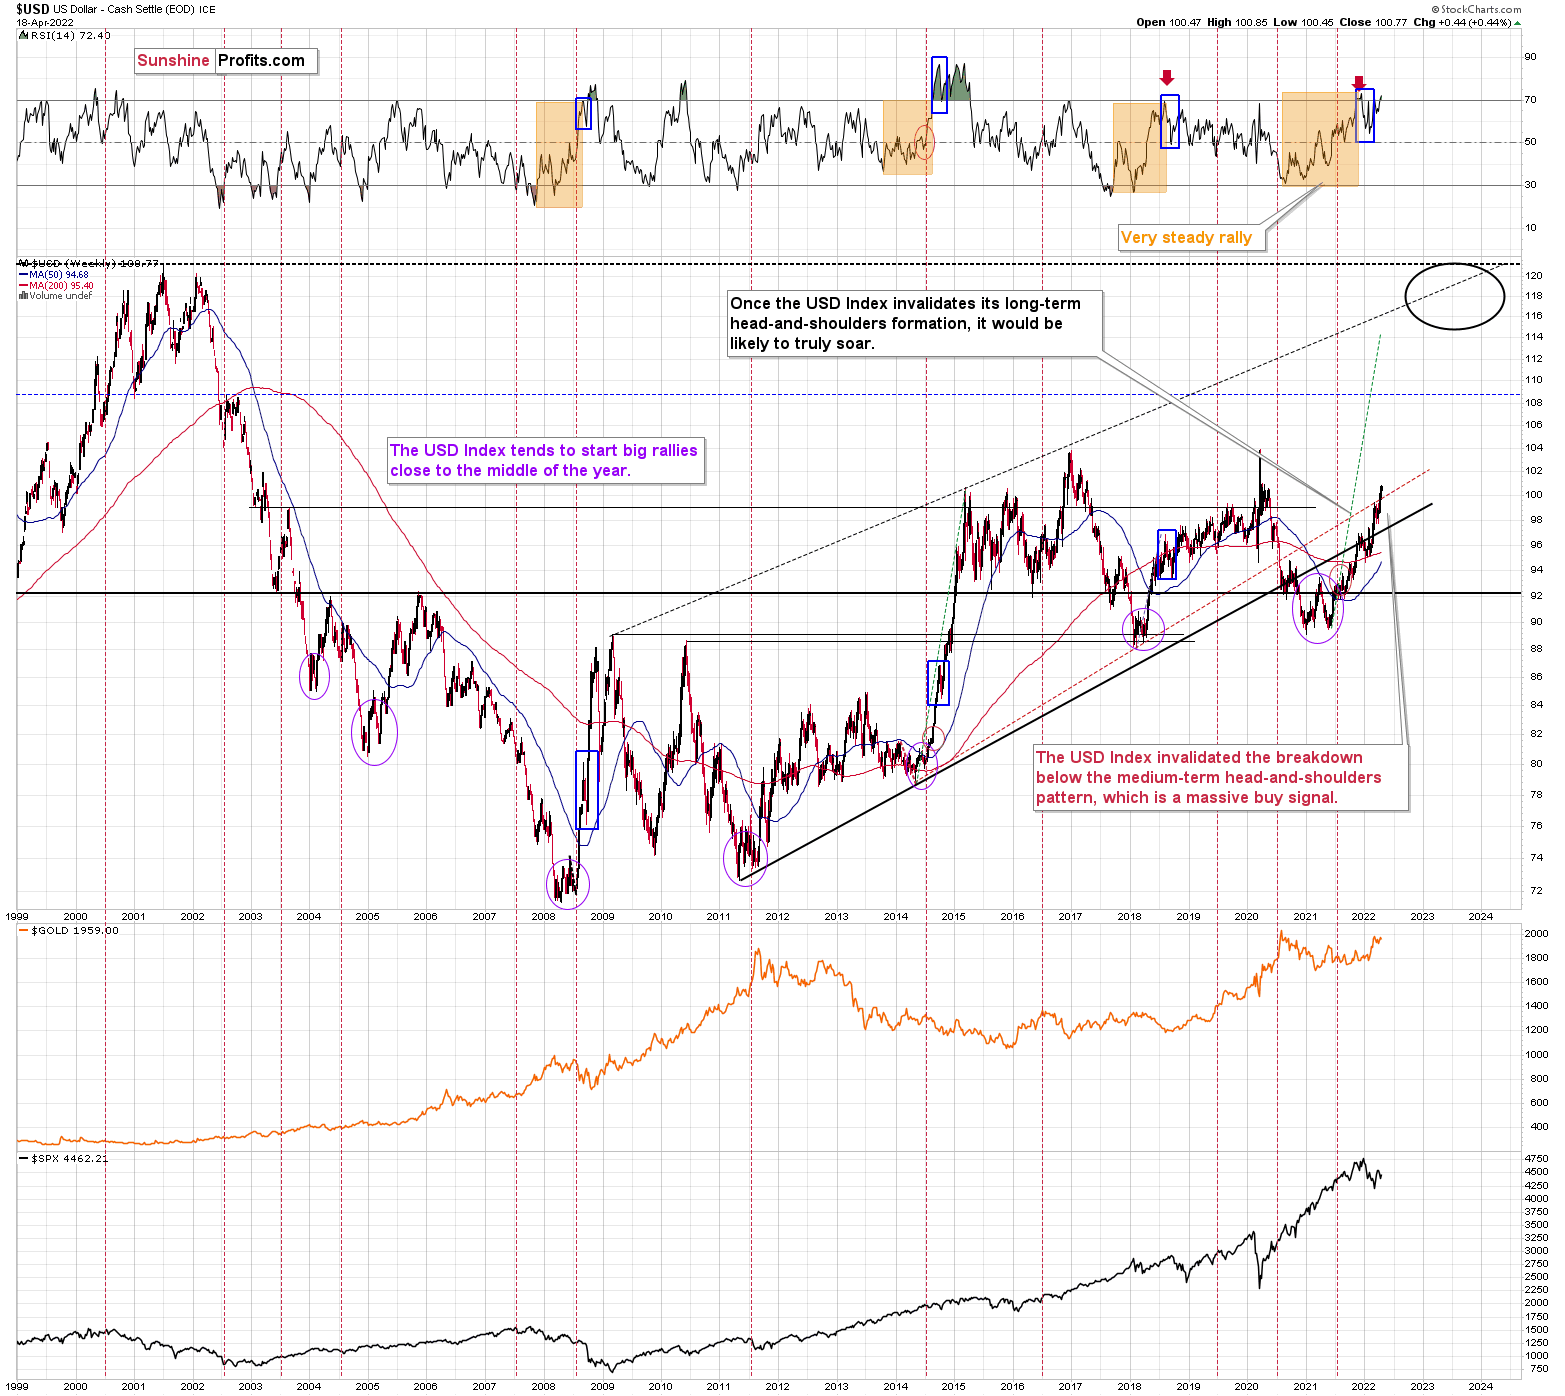
Namely, it invalidated the breakdowns below the neck level of its long-term head-and-shoulders formation. This formation didn’t fit the USD’s very long-term chart, so I didn’t think that it would really result in much lower USD prices. Indeed, instead of big declines, we saw a relatively small (from the long-term point of view) move lower – from 94 in 2020 to about 89 in the final part of that year, but then a powerful rally started and it took the USD Index much, much higher.
The thing is that the USDX rallied well above the neck level, thus not only nullifying the bearish implications of the formation, but actually creating a powerful buy signal. Invalidations of patterns have the opposite effect of what the pattern would have if held. In this case, the implications are bullish.
Now, one could draw the neck level of the pattern in two ways, depending on what bottoms one decides to use. One of them is in black (a thick line) and one of them is in red (a dashed line). The point is that the USD Index invalidated breakdowns below both those lines. Therefore, it’s clear that the bullish implications are present.
Let’s check when the previous times were when the USD Index was about to rally profoundly. The three cases that are most visible on the above chart are mid-2008, mid-2011, and mid-2014. In all those cases, it was right before a major decline in the price of gold.
Yes, we still have some war-concern-based premium in the price of gold, but as the situation stabilizes or at least the tensions don’t increase further (and that’s very unlikely as they are very high right now), gold is likely to react to the things that it’s usually reacting to: the USD Index and real interest rates. The former is very likely to go up and… so does the latter. Therefore, gold, silver, and mining stocks are likely to move lower in the following weeks and months, even though it might not look this way based on the day-to-day price swings.
All in all, technicals favor a decline in the precious metals sector sooner rather than later.
Having said that, let’s take a look at the markets from a more fundamental point of view.
Negative No More
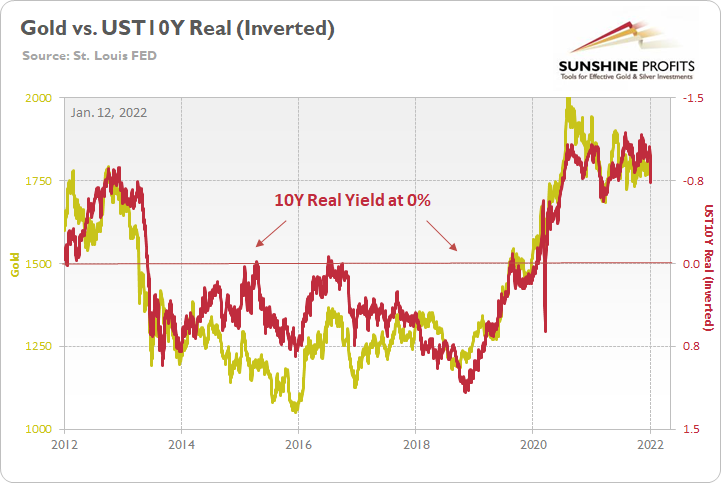
While the PMs remain relatively uplifted given the sharp deterioration in their medium-term fundamentals, the bearish evidence continues to mount. For example, the U.S. 10-Year real yield hit 0% on Apr. 19, and I warned previously that real interest rates were poised to make a comeback. I wrote on Jan. 12:
The PMs are less volatile than speculative assets. However, it's important to remember that gold, silver, and mining stocks peaked amid the liquidity-fueled surge in the summer of 2020. Likewise, their uprisings coincided with real interest rates that were at all-time lows at the time.
Conversely, with the Fed's liquidity drain already unfolding and real interest rates poised to rise in the coming months, the PMs should suffer from the likely re-pricings. For example, when the U.S 10-Year real yield was at 0% or higher from June 2013 until October 2018, gold was stuck below $1,400 during that timeframe and actually fell below $1,100. As a result, if the Fed pushes its hawkish chips into the middle, don't be surprised if the PMs fold in 2022.
Please see below:
To that point, while liquidity has been drained from the system and real yields have risen materially, the PMs have focused their attention on the Russia-Ukraine conflict. However, with gold, silver, and mining stocks fighting battles they haven’t won in 15+ years, the medium term should be unkind to the permabulls.
Please see below:
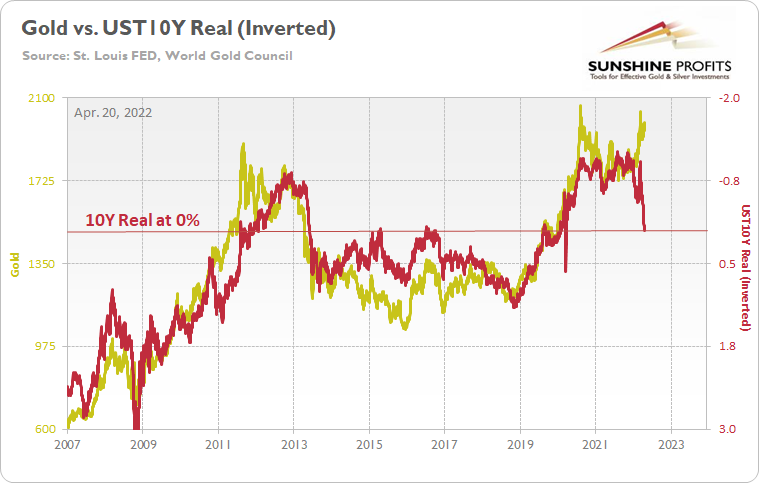
To explain, the gold line above tracks the price tallied by the World Gold Council, while the red line above tracks the inverted U.S. 10-Year real yield. For context, inverted means that the latter's scale is flipped upside down and that a rising red line represents a falling U.S. 10-Year real yield, while a falling red line represents a rising U.S. 10-Year real yield.
Do you know when were the previous two cases when the real yield moved to 0%? In early 2013 and early 2020 – and that’s when we saw powerful slides in gold, but in particular in silver and mining stocks.
For more context, I wrote on Apr. 11:
If you analyze the left side of the chart, you can see that the U.S. 10-Year real yield soared and gold plunged during the global financial crisis (GFC). However, when the Fed launched QE and the U.S. 10-Year real yield sank to an all-time low, gold hit a new all-time high along the way.
Furthermore, the current situation is a spitting image of the past. When Fed Chairman Jerome Powell performed a dovish pivot in late 2018, the U.S. 10-Year real yield suffered. Then, when the Fed fired its liquidity bazooka in March 2020, it pushed the metric to another all-time low. And surprise, surprise, gold hit another all-time high.
However, with the Fed normalizing policy, the U.S. 10-Year real yield has surged in recent weeks. Moreover, the Fed needs to push the metric above 0% to curb inflation.
Thus, it's likely only a matter of time until the milestone is achieved. In addition, a U.S. 10-Year real yield of 0% implies a gold price of $1,500, and while the current narrative suggests otherwise, is this time really different?
In addition, a subscriber asked about the potential direction of interest rates in the coming months. For context, he cited the weekly head & shoulders pattern present on the iShares 20+ Year Treasury Bond ETF (TLT) chart.
Please see below:
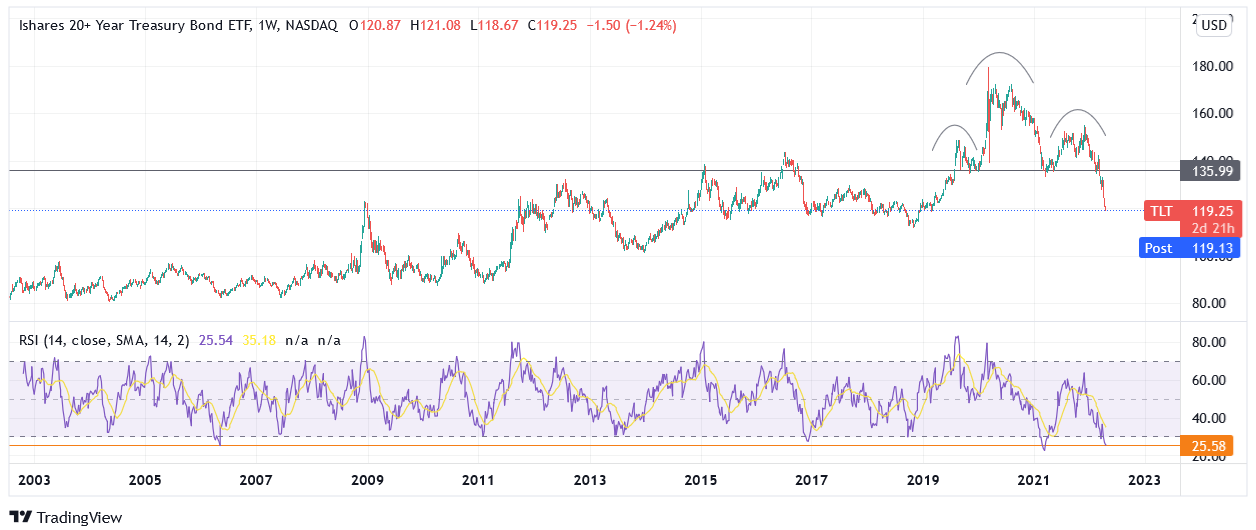
To explain, the arch shapes on the right side of the chart represent the left shoulder, the head, and the right shoulder. As you can see, TLT has already broken below the neckline (the horizontal gray line) and the drawdown in 2022 has been fast and furious.
However, the suffering has also coincided with TLT’s weekly RSI (Relative Strength Index) declining to levels that often mark medium-term bottoms (the orange line at the bottom of the chart). As a result, plenty of technical damage has been done, and the data could be used to support higher bond prices and lower long-term interest rates. However, even if oversold conditions elicit a short-term rally, the medium-term fundamentals remain intact.
Please see below:
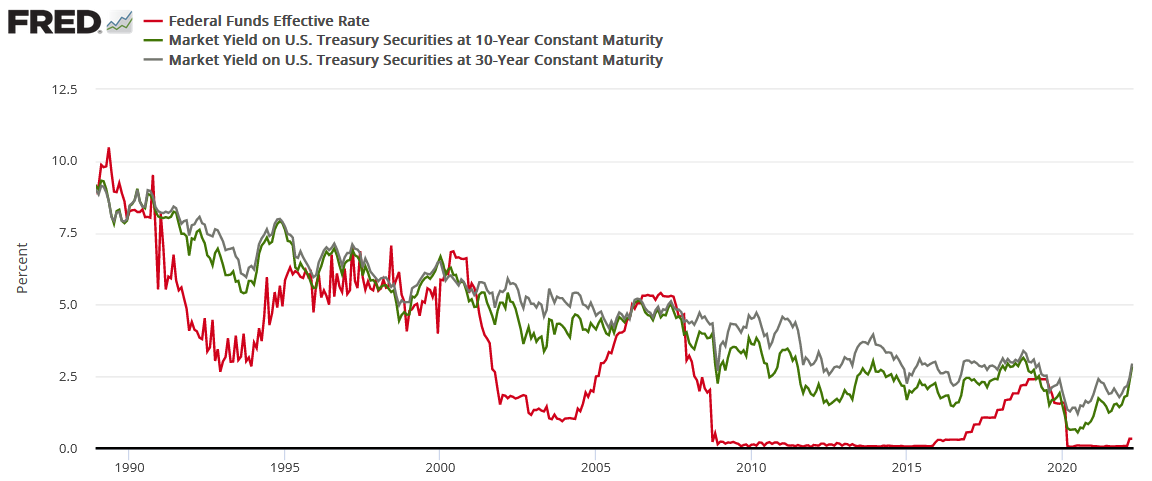
To explain, the red line above tracks the U.S. federal funds rate, while the green and gray lines above track the U.S. 10-Year and 30-Year Treasury yields. If you analyze the connection, you can see that the latter two often take their orders from the former. In a nutshell: when the Fed raises interest rates, it takes several hikes of 0.25% before long-term yields rollover. For example:
- In 2018, the U.S. 10-Year Treasury yield peaked after ~9 rate hikes.
- In 2006, the U.S. 10-Year Treasury yield peaked after ~17 rate hikes.
- In 2000, the U.S. 10-Year Treasury yield peaked after ~7 rate hikes.
- In 1994, the U.S. 10-Year Treasury yield peaked after ~12 rate hikes.
For context, I'm prioritizing the U.S. 10-Year Treasury yield because its real yield is what we use to value gold. However, if you focus your attention on the red and gray lines above, you can see that the 10-and-30-year nominal yields have a tight relationship. As a result, it's an ominous medium-term sign for TLT.
Thus, with modern history showcasing that the U.S. 10-Year Treasury yield doesn't peak until the Fed is well within its rate hike cycle, please remember that the Fed has only hiked once. Therefore, with seven rate hikes as the minimum to elicit a peak over the last ~28 years, the U.S. 10-Year Treasury yield should have room to run, and this is bullish for real yields and bearish for gold.
Also, please note that we don't need nominal yields to rise for real yields to rise. For example, my initial bullish outlook for U.S. real yields was built upon surging inflation uplifting nominal yields. I wrote on May 11, 2021:
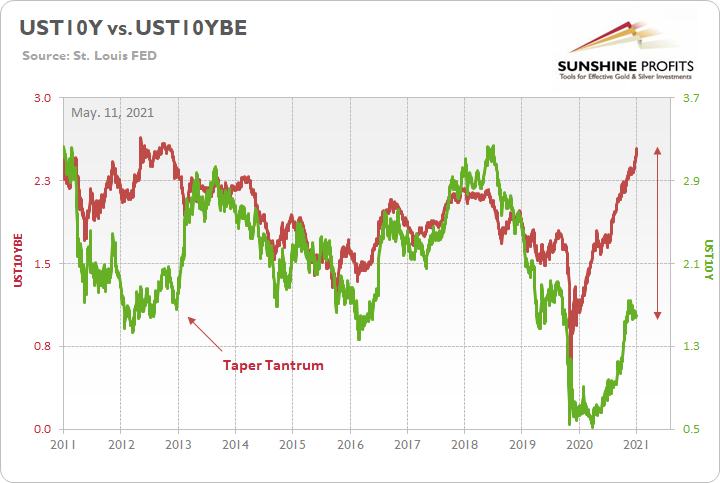
To explain, the green line above tracks the U.S. 10-Year Treasury yield, while the red line above tracks the U.S. 10-Year breakeven inflation rate. If you analyze the left side of the chart, you can see that when the bond market finally snapped in 2013, the U.S. 10-Year Treasury yield’s surge was fast and furious. More importantly, though, if you analyze the right side of the chart, you can see that today’s gap makes 2013 look like an appetizer. As a result, with material divergences often reversing in violent fashion, it’s only a matter of time until the next earthquake erupts.
Furthermore, while the fundamental thesis took time to play out, the U.S. 10-Year Treasury yield equals the U.S. 10-Year breakeven inflation rate (real yield at 0%). Now, it’s the gap between gold and the U.S. 10-Year real yield that makes 2011 look like an appetizer.
Therefore, while it takes time for investors to wrap their heads around fundamental developments, it’s a spitting image: the U.S. 10-Year Treasury yield eventually reconnected with the U.S. 10-Year breakeven inflation rate, and gold will eventually reconnect with the U.S. 10-Year real yield.
However, the next leg higher for the U.S. 10-Year real yield may occur for the opposite reasons. For example, I noted above that we don’t need nominal yields to rise for real yields to rise. Moreover, while the U.S. 10-Year Treasury yield was undervalued in 2021 and was poised to move higher, the U.S. 10-Year breakeven inflation rate is overvalued in 2022 and is poised to move lower.
Please see below:
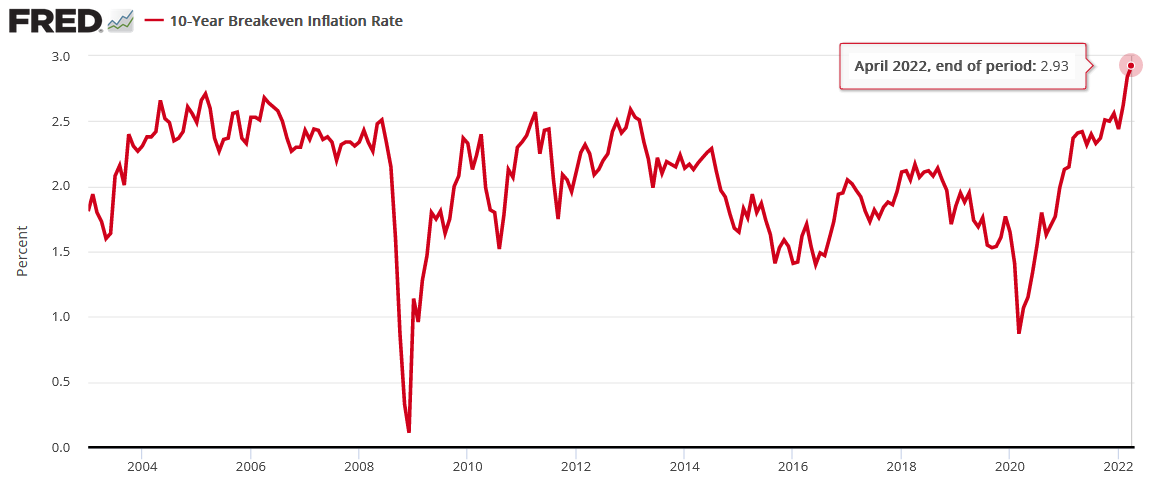
To explain, the U.S. 10-Year breakeven inflation rate ended the Apr. 19 session at 2.93%, only slightly below the all-time high of 2.95% set in March. However, like the PMs, investors’ long-term inflation expectations remain in la-la land.
With the Fed on a hawkish crusade to stifle demand and reduce inflation, the central bank can achieve this goal. The only question is how much economic pain officials are willing to tolerate to get the job done.
Either way, when the Fed embarks on rate hikes four, five, six, etc., realized inflation (the CPI) should decline and expectations should follow suit. Moreover, with nominal yields often remaining uplifted during the Fed’s rate hike cycles, the medium-term outlook is profoundly bullish for the U.S. 10-Year real yield and the USD Index.
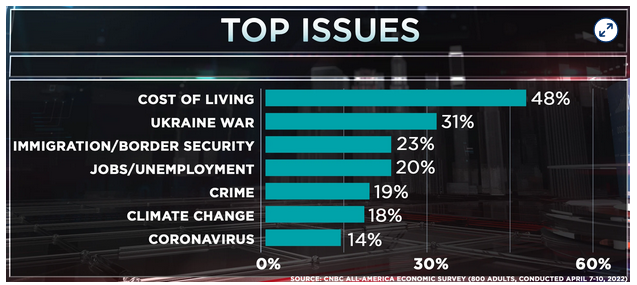
Finally, gold permabulls may rebut the argument by assuming that the Fed will chicken out, QE will commence once again and the commodities supercycle will be realized. However, I’ve warned on numerous occasions that inflation is a political issue, which makes the prospect of a dovish 180 by the Fed slim to none.
For example, CNBC released its All-America Economic Survey on Apr. 13. The report revealed that “47% of the public say the economy is ‘poor,’ the highest number in that category since 2012. Only 17% rank the economy as excellent or good, the lowest since 2014.”
Please see below:
Likewise, I’ve also noted on numerous occasions that U.S. President Joe Biden’s approval rating is inversely correlated with inflation.
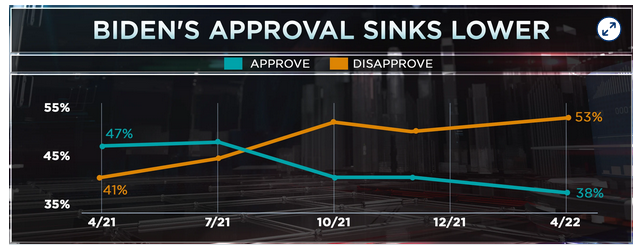
As a result, while investors assume that the Fed will bow down to the financial markets, the reality is that the game has changed. Previously, the Fed could support asset prices without the general public noticing. Now, inflation is front-page news and is hurting middle-class and poor Americans. Therefore, the Fed has to deal with the issue, and political pressure should force officials’ hands, whether they like it or not.
The bottom line? While it took almost a year for the U.S. 10-Year Treasury yield to reconnect with the U.S. 10-Year breakeven inflation rate, the milestone highlights how you can only run from reality for so long. Moreover, with gold and the U.S. 10-Year real yield in the same situation now, an identical outcome should eventually materialize. Furthermore, with the Fed’s rate hike cycle poised to push real yields even higher over the medium term, it shouldn’t take as long for reality to re-emerge this time around.
In conclusion, the PMs declined on Apr. 19, though they’re still a long way from reflecting their fundamental values. With the Fed hawked up, the USD Index north of 100, and the U.S. 10-Year real yield at 0%, commodities (like the PMs) and the general stock market are the only ones that think the coast is clear. However, while old habits die hard, history shows that when fundamentals shift, sentiment eventually follows suit.
Overview of the Upcoming Part of the Decline
- It seems to me that the post-decline consolidation is now over or very close to being over , and that gold, silver, and mining stocks are now likely to continue their medium-term decline.
- It seems that the first (bigger) stop for gold will be close to its previous 2021 lows, slightly below $1,800 . Then it will likely correct a bit, but it’s unclear if I want to exit or reverse the current short position based on that – it depends on the number and the nature of the bullish indications that we get at that time.
- After the above-mentioned correction, we’re likely to see a powerful slide, perhaps close to the 2020 low ($1,450 - $1,500).
- If we see a situation where miners slide in a meaningful and volatile way while silver doesn’t (it just declines moderately), I plan to – once again – switch from short positions in miners to short positions in silver. At this time, it’s too early to say at what price levels this could take place, and if we get this kind of opportunity at all – perhaps with gold close to $1,600.
- I plan to exit all remaining short positions once gold shows substantial strength relative to the USD Index while the latter is still rallying. This may be the case with gold close to $1,350 - $1,400. I expect silver to fall the hardest in the final part of the move. This moment (when gold performs very strongly against the rallying USD and miners are strong relative to gold after its substantial decline) is likely to be the best entry point for long-term investments, in my view. This can also happen with gold close to $1,375, but at the moment it’s too early to say with certainty.
- As a confirmation for the above, I will use the (upcoming or perhaps we have already seen it?) top in the general stock market as the starting point for the three-month countdown. The reason is that after the 1929 top, gold miners declined for about three months after the general stock market started to slide. We also saw some confirmations of this theory based on the analogy to 2008. All in all, the precious metals sector is likely to bottom about three months after the general stock market tops.
- The above is based on the information available today, and it might change in the following days/weeks.
You will find my general overview of the outlook for gold on the chart below:
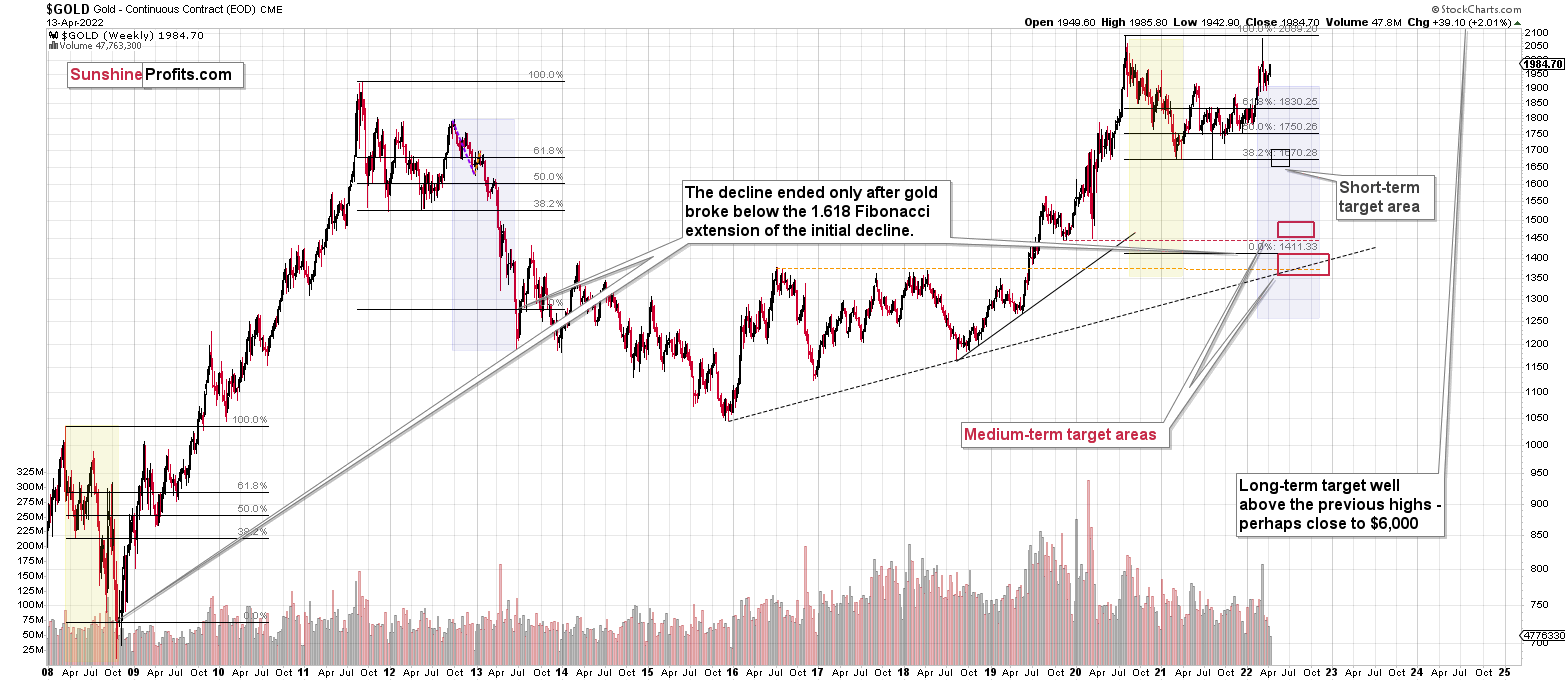
Please note that the above timing details are relatively broad and “for general overview only” – so that you know more or less what I think and how volatile I think the moves are likely to be – on an approximate basis. These time targets are not binding or clear enough for me to think that they should be used for purchasing options, warrants or similar instruments.
Summary
Summing up, despite the recent rally in gold, the outlook for junior mining stocks remains exactly as I described previously.
Investing and trading are difficult. If it was easy, most people would be making money – and they’re not. Right now, it’s most difficult to ignore the urge to trade along with the crowd that’s ignoring two critical factors:
- rising real interest rates,
- rising USD Index values.
Both of the aforementioned are the two most important fundamental drivers of the gold price. Since neither the USD Index nor real interest rates are likely to stop rising anytime soon (especially now that inflation has become highly political), the gold price is likely to fall sooner or later. Given the analogy to 2012 in gold, silver, and mining stocks, “sooner” is the more likely outcome.
It seems that our profits from short positions are going to become truly epic in the coming months.
Moreover, let’s keep in mind that we are not patient with this trade to just get out of it close to being even or with a reasonable (10%-30%) profit. Of course, I can’t promise anything, but this entire short trade is likely to end with gold below $1,500 and junior miners close to or below their 2020 lows. The upside potential for the inversely trading instruments is likely enormous. Yes, we might adjust the trade or exit it temporarily, only to get back to it shortly thereafter, but the overall potential remains gargantuan. It’s quite likely that none of those gains will be reaped by precious metals perma-bulls.
After the sell-off (that takes gold to about $1,350-$1,500), I expect the precious metals to rally significantly. The final part of the decline might take as little as 1-5 weeks, so it's important to stay alert to any changes.
As always, we'll keep you – our subscribers – informed.
To summarize:
Trading capital (supplementary part of the portfolio; our opinion): Full speculative short positions (300% of the full position) in junior mining stocks are justified from the risk to reward point of view with the following binding exit profit-take price levels:
Mining stocks (price levels for the GDXJ ETF): binding profit-take exit price: $34.63; stop-loss: none (the volatility is too big to justify a stop-loss order in case of this particular trade)
Alternatively, if one seeks leverage, we’re providing the binding profit-take levels for the JDST (2x leveraged) and GDXD (3x leveraged – which is not suggested for most traders/investors due to the significant leverage). The binding profit-take level for the JDST: $14.98; stop-loss for the JDST: none (the volatility is too big to justify a SL order in case of this particular trade); binding profit-take level for the GDXD: $25.48; stop-loss for the GDXD: none (the volatility is too big to justify a SL order in case of this particular trade).
For-your-information targets (our opinion; we continue to think that mining stocks are the preferred way of taking advantage of the upcoming price move, but if for whatever reason one wants / has to use silver or gold for this trade, we are providing the details anyway.):
Silver futures downside profit-take exit price: $19.12
SLV profit-take exit price: $17.72
ZSL profit-take exit price: $38.28
Gold futures downside profit-take exit price: $1,683
HGD.TO – alternative (Canadian) inverse 2x leveraged gold stocks ETF – the upside profit-take exit price: $11.79
HZD.TO – alternative (Canadian) inverse 2x leveraged silver ETF – the upside profit-take exit price: $29.48
Long-term capital (core part of the portfolio; our opinion): No positions (in other words: cash
Insurance capital (core part of the portfolio; our opinion): Full position
Whether you already subscribed or not, we encourage you to find out how to make the most of our alerts and read our replies to the most common alert-and-gold-trading-related-questions.
Please note that we describe the situation for the day that the alert is posted in the trading section. In other words, if we are writing about a speculative position, it means that it is up-to-date on the day it was posted. We are also featuring the initial target prices to decide whether keeping a position on a given day is in tune with your approach (some moves are too small for medium-term traders, and some might appear too big for day-traders).
Additionally, you might want to read why our stop-loss orders are usually relatively far from the current price.
Please note that a full position doesn't mean using all of the capital for a given trade. You will find details on our thoughts on gold portfolio structuring in the Key Insights section on our website.
As a reminder - "initial target price" means exactly that - an "initial" one. It's not a price level at which we suggest closing positions. If this becomes the case (like it did in the previous trade), we will refer to these levels as levels of exit orders (exactly as we've done previously). Stop-loss levels, however, are naturally not "initial", but something that, in our opinion, might be entered as an order.
Since it is impossible to synchronize target prices and stop-loss levels for all the ETFs and ETNs with the main markets that we provide these levels for (gold, silver and mining stocks - the GDX ETF), the stop-loss levels and target prices for other ETNs and ETF (among other: UGL, GLL, AGQ, ZSL, NUGT, DUST, JNUG, JDST) are provided as supplementary, and not as "final". This means that if a stop-loss or a target level is reached for any of the "additional instruments" (GLL for instance), but not for the "main instrument" (gold in this case), we will view positions in both gold and GLL as still open and the stop-loss for GLL would have to be moved lower. On the other hand, if gold moves to a stop-loss level but GLL doesn't, then we will view both positions (in gold and GLL) as closed. In other words, since it's not possible to be 100% certain that each related instrument moves to a given level when the underlying instrument does, we can't provide levels that would be binding. The levels that we do provide are our best estimate of the levels that will correspond to the levels in the underlying assets, but it will be the underlying assets that one will need to focus on regarding the signs pointing to closing a given position or keeping it open. We might adjust the levels in the "additional instruments" without adjusting the levels in the "main instruments", which will simply mean that we have improved our estimation of these levels, not that we changed our outlook on the markets. We are already working on a tool that would update these levels daily for the most popular ETFs, ETNs and individual mining stocks.
Our preferred ways to invest in and to trade gold along with the reasoning can be found in the how to buy gold section. Furthermore, our preferred ETFs and ETNs can be found in our Gold & Silver ETF Ranking.
As a reminder, Gold & Silver Trading Alerts are posted before or on each trading day (we usually post them before the opening bell, but we don't promise doing that each day). If there's anything urgent, we will send you an additional small alert before posting the main one.
Thank you.
Przemyslaw Radomski, CFA
Founder, Editor-in-chief

