

Briefly: in our opinion, full (200% of the regular size of the position) speculative long positions in gold, silver and mining stocks are justified from the risk/reward perspective at the moment of publishing this alert.
The week is about to end, and we’ll have the weekly closing prices and weekly volume levels shorty. Depending on them, gold could start the next week with a big rally or a big decline. Fortunately, there are signs that we already have right now that let us predict in advance how today’s session will end and thus what will surprise those who don’t know about their existence on Monday.
The first sign comes from platinum, so let’s start today’s analysis with its chart (charts courtesy of http://stockcharts.com/).
Platinum’s Breakdown and Its Invalidation
The second-most-popular white precious metal (silver takes the spotlight) paused yesterday, which may seem to be irrelevant, but it actually is meaningful. It didn’t invalidate the previous day’s reversal, but rather took a breather, indicating that it was a true reversal. This means that its implications remain in place and the short-term outlook remains bullish.
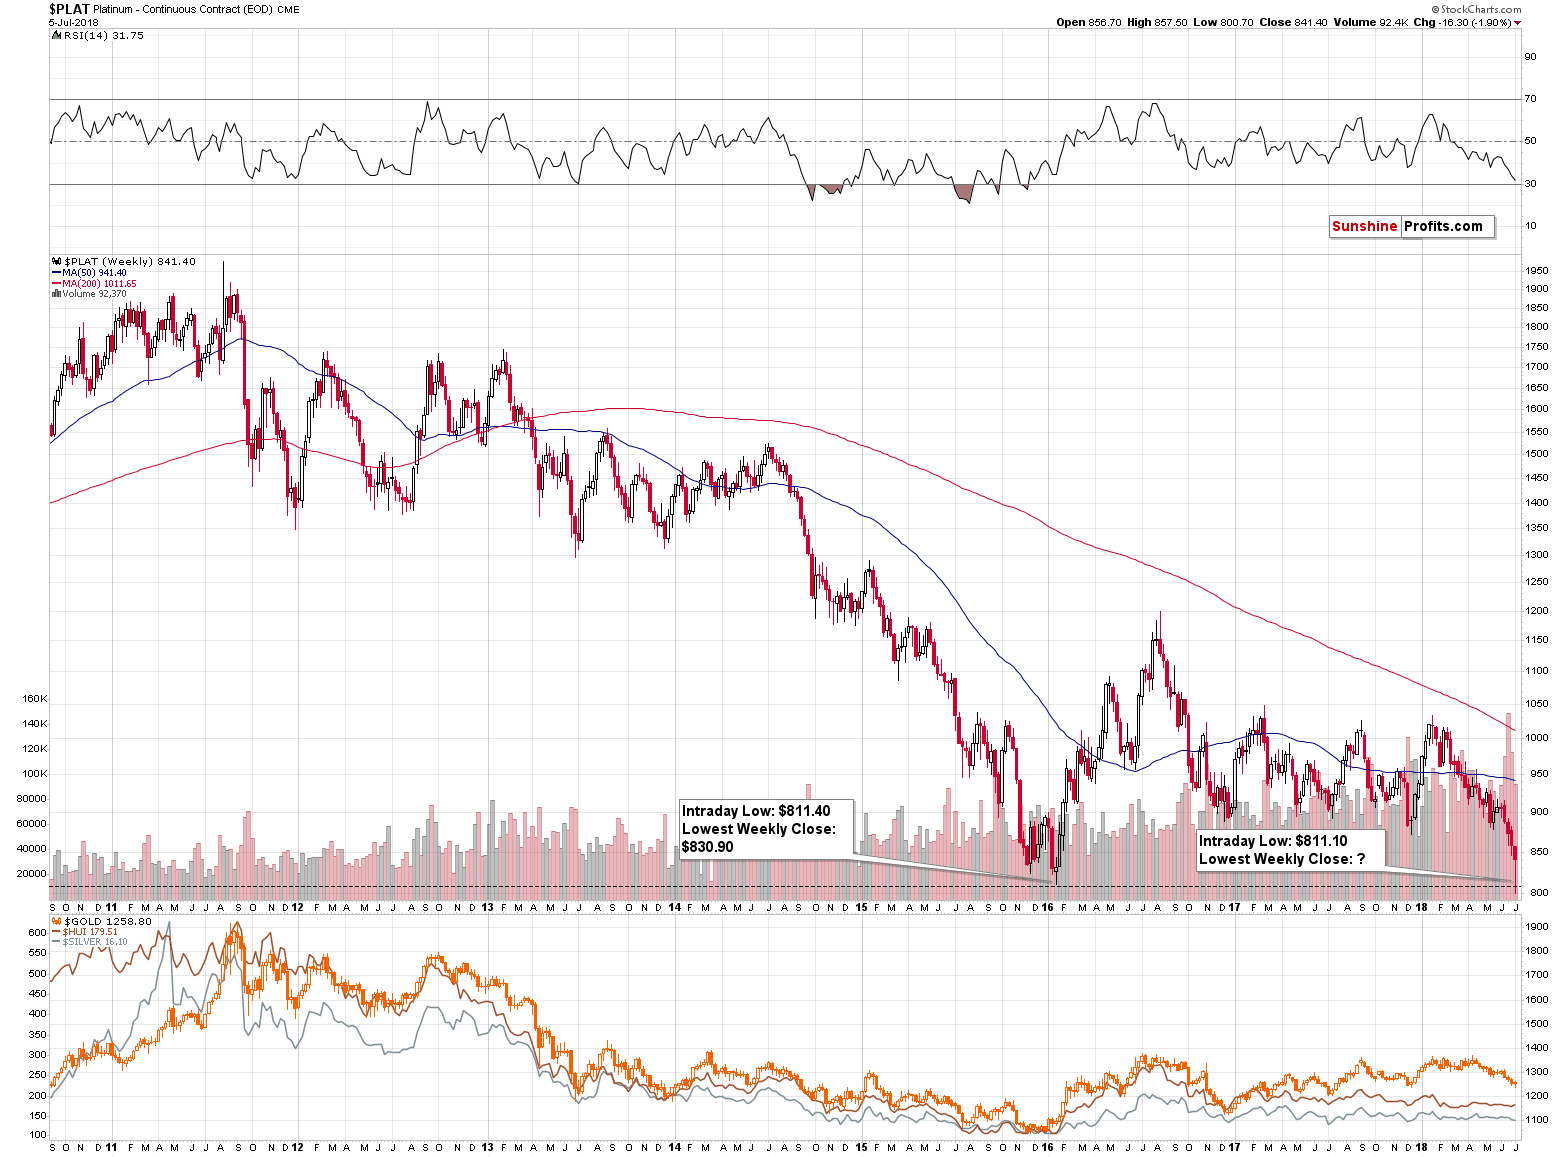
This in turn means that platinum is very likely to end the week where it is right now, or even higher. In both cases it means a powerful weekly reversal and an invalidation of the recent breakdown below the early 2016 lows. The implications are bullish at least for the next week.
These implications extent to the rest of the precious metals sector. We previously explained why this is the case and it seems that quoting this explanation will be useful also today:
The answer is: contagion effect and representativeness bias. The above links provide complex definitions, but to make a long story short, when people see that a part of a given market is failing, they start viewing the entire market as failing and they start selling, thus making this market really fail.
For instance, there are no major economic links between Argentina and Poland, but both economies are somewhat similar and they are both viewed as emerging markets. Crisis in Argentina shouldn’t have any impact on the exchange rate between the USD and the PLN (Polish Złoty – “Złoty” means “Golden” by the way). But it would. Crisis in Argentina would make investors view “emerging markets” as risky in general without them paying attention to details. They would just exit the emerging markets regardless of whether it really made economic sense with regard to countries other than Argentina. In this case, the investors who had previously used dollars to buy Polish equities or other assets, would likely sell them and then want to get back into the USD.
In our case, platinum declined profoundly and it likely took gold and silver with it, through the above-mentioned effects.
If platinum kept on declining, the negative impact on the rest of the precious metals sector could persist, or slowly fade away. But, it’s likely that this effect will be reversed due to two reasons:
- Platinum’s decline was most likely a news-based effect and such effects are usually only temporary
- Platinum already invalidated the breakdown in intraday terms and it seems likely that it will invalidate the one in terms of closing prices as well.
The likely direct reason behind platinum’s slide is the Car-tariff threat. You can read the full story here and the long story short version is that there is a threat of a trade war between the US and the EU with regard to cars. The EU exported $43.6 billion worth of cars to the US in 2017, while $7.2 billion worth of cars were exported to the EU from the US. Consequently, the trade war with regard to cars would likely result in less demand for European cars but bigger demand for US cars (US domestic demand would likely increase if cars from the EU became more expensive to the end users).
Gasoline cars dominate the US market, while diesel cars dominate the EU market. Consequently, the above implies significantly less demand for the diesel cars and since platinum is used in catalysts for diesel engines, the above means smaller demand for platinum. Therefore, the price dropped.
The markets are forward looking and thus they already discounted the above in the price to some extent, but let’s keep in mind that the risk of a trade war is not the same as an actual trade war. This is especially the case, since President Trump is known to change his mind relatively quickly. Consequently, in our view, market overreacted to what really changed.
The situation is similar to what happened in the USD Index in January. Back then Treasury Secretary Steven Mnuchin signaled that a weak greenback is good for trade, which shocked the markets as that was exactly the opposite of what a Treasury Secretary is supposed to say. The USD Index declined profoundly because of this and it even briefly moved below the key long-term support levels.
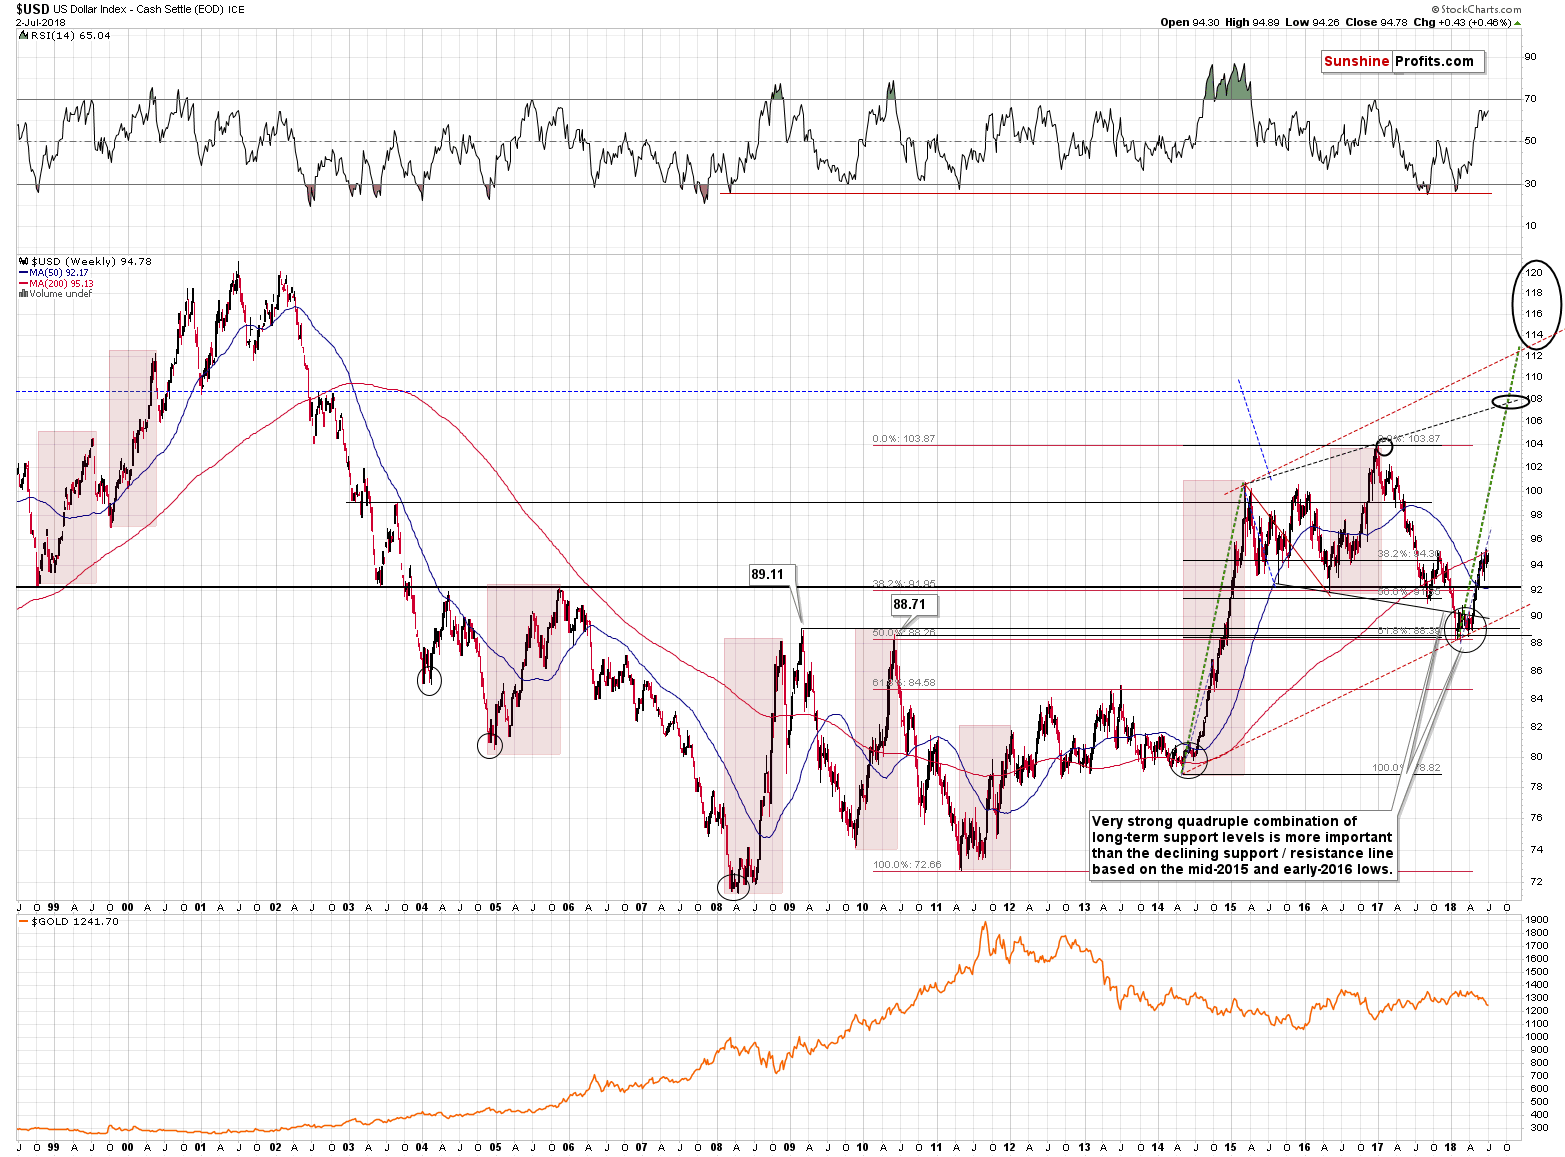
But, this breakdown was quickly invalidated (and so was the “megaphone pattern”) and it turned out that it was actually a beginning of a rally, not a decline.
We have something similar in platinum – big, news-driven decline after a decline and an invalidation of the breakdown below the key long-term support level. The implications are bullish, not bearish.
What does it imply to gold, silver and mining stocks? That yesterday’s decline was somewhat artificial and it should not be taken at face value. Consequently, even though the silver’s short-term chart doesn’t look favorable, it doesn’t mean that it changed the outlook. The same goes for other factors that might appear bearish based solely on yesterday’s session.
In fact, knowing what was likely behind yesterday’s price declines and seeing how this bearish factor is likely to become a bullish one serves as yet another bullish sign that further confirms our long position.
So, just as the above effects might have contributed to lower prices of gold, silver and gold and silver mining stocks, they are now likely to be bullish factors.
We can already see the results.
Gold’s Bottoming Pattern
In yesterday’s alert, we described the above chart in the following way:
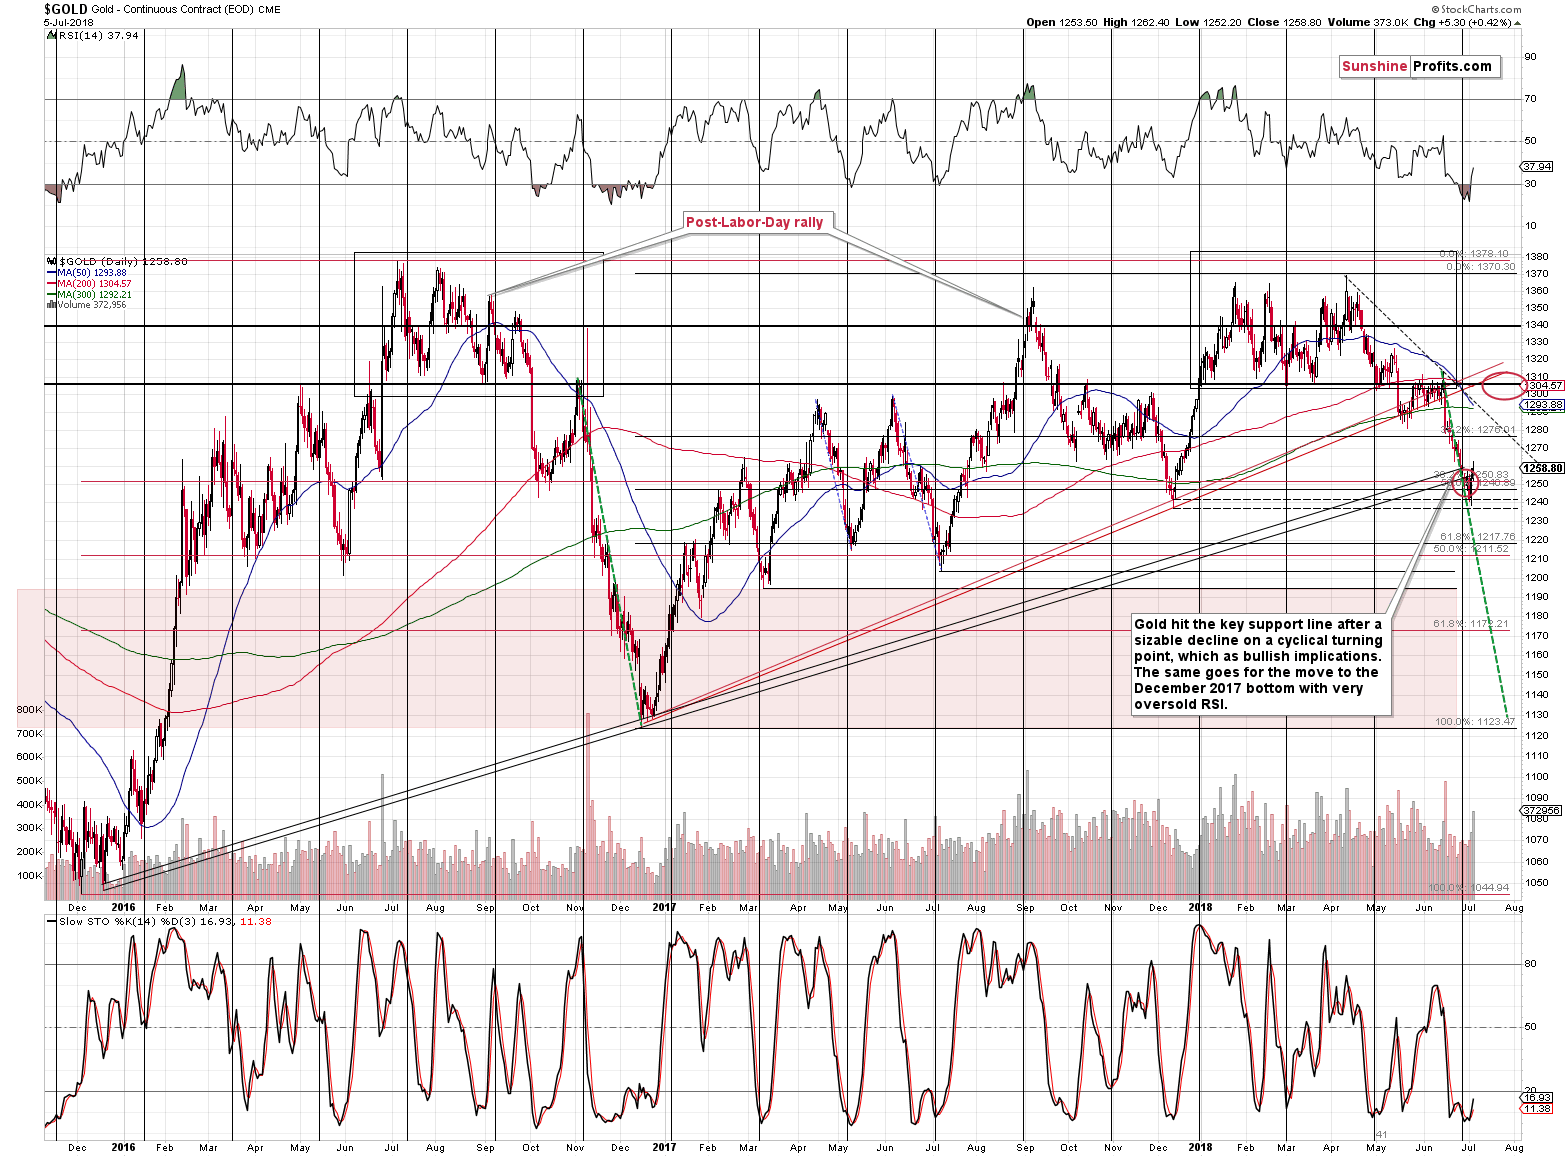
Gold moved only a bit below our target area before it rallied back up. Overall, technical levels are critical when determining how high or low can the price go, but if something unexpected happens (like the car-tariff news that just affected platinum) these levels can be breached temporarily. Unless the breach is major, it’s unlikely that the technically-driven (a.k.a. sentiment-driven) moves are going to be invalidated. The above chart serves as a great example. The outlook remains bullish and almost perfectly in tune with the technical patterns – the news-based decline was only able to trigger a small anomaly.
The above remains up-to-date. Based on yesterday’s session, we can add that gold moved higher on significant volume, which adds credibility to the bullish picture for the short term.
We would also like to emphasize that even though we marked only one (more probable) target area ($1,300 - $1,310), it is also possiblethat gold will top at a different price level, perhaps closer to $1,280 - $1,290. This range includes the 38.2% Fibonacci retracement based on the December 2016 – April 2018 rally, the May bottom, the 300-day moving average, and the declining dashed resistance line.
Please note that just because it’s not clear how high gold will go in the next week or two, the outlook is not any less bullish. It’s just that confirmations from other markets (especially silver and mining stocks) and the target for the USD Index will play a more important role in determining whether to close / switch the current long position than the price target for gold alone.
Before moving to silver, let’s take a look at the current weekly price change in gold.
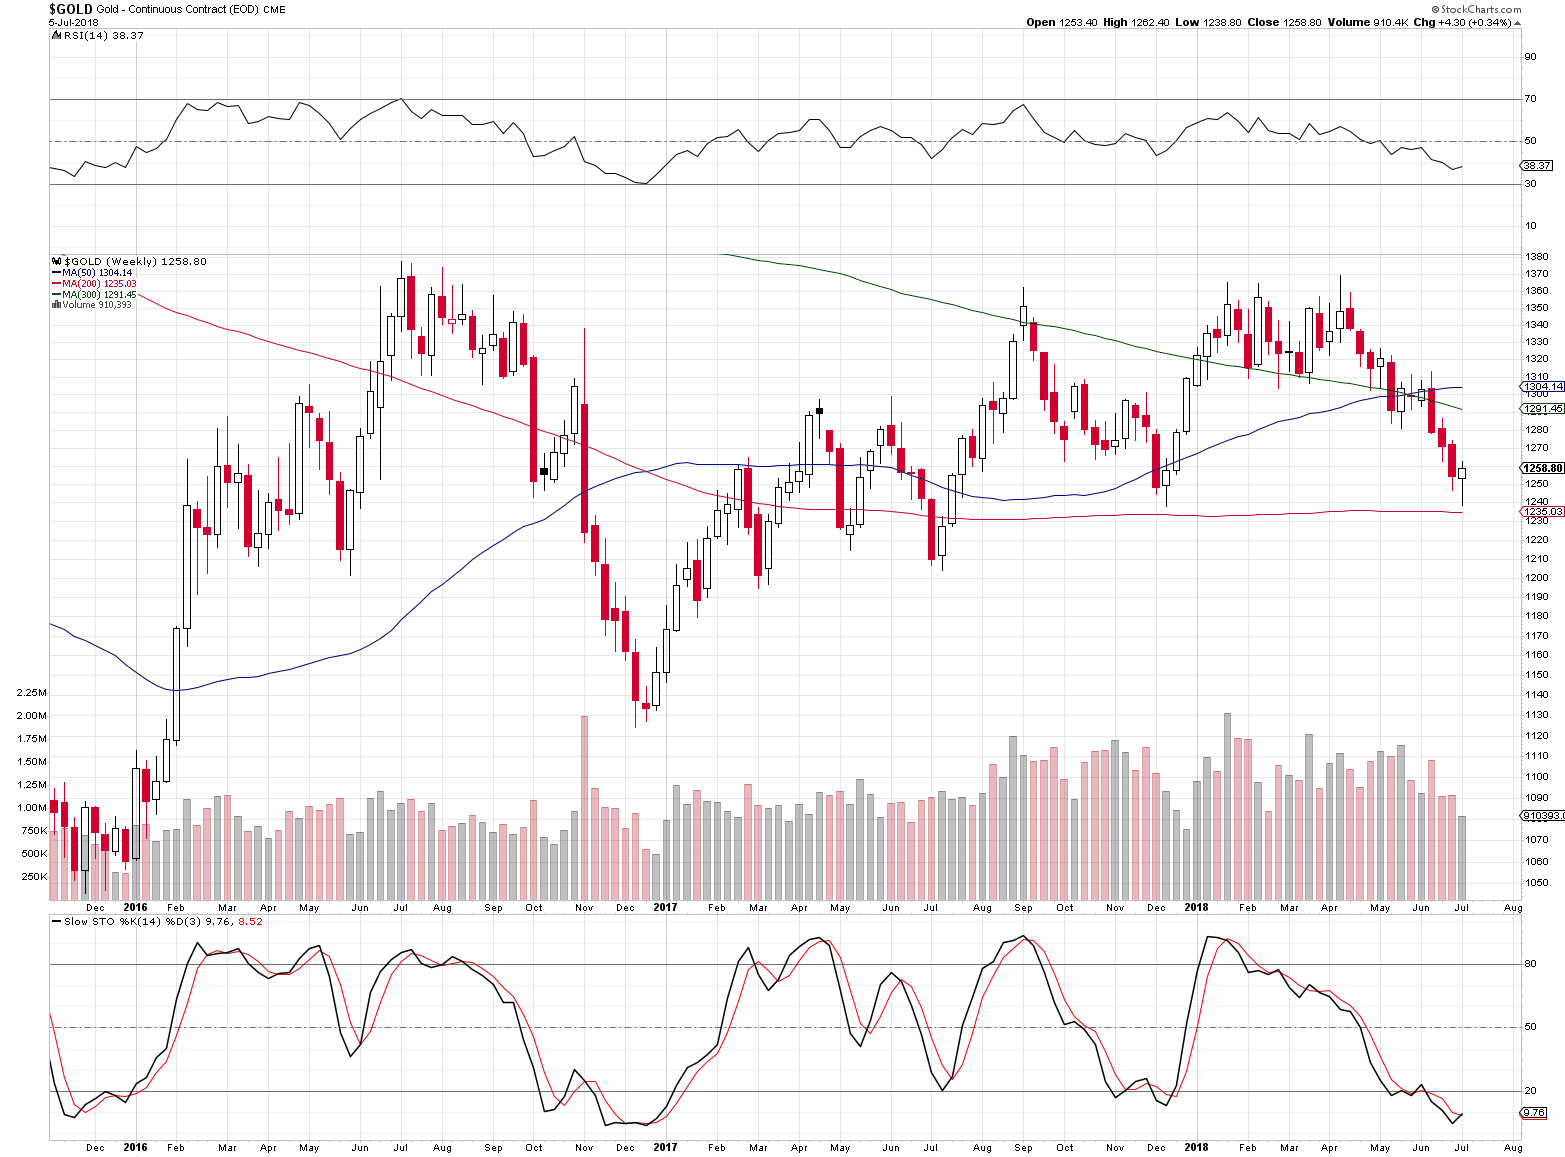
It’s an almost perfectly clear weekly reversal that we see after a sizable decline and we’re seeing a small buy signal from the weekly Stochastic indicator. Naturally, the above is just hypothetical, as the week is not over yet. The same goes for the volume level – its relatively small, but the week is not over, so it’s not particularly informative yet.
Consequently, unless gold declines today – and it’s unlikely to based on the likely action in the forex market – we will have a very bullish implication at least for the next week.
Silver’s Small Comeback
In our previous alerts, we commented on the above chart in the following way:
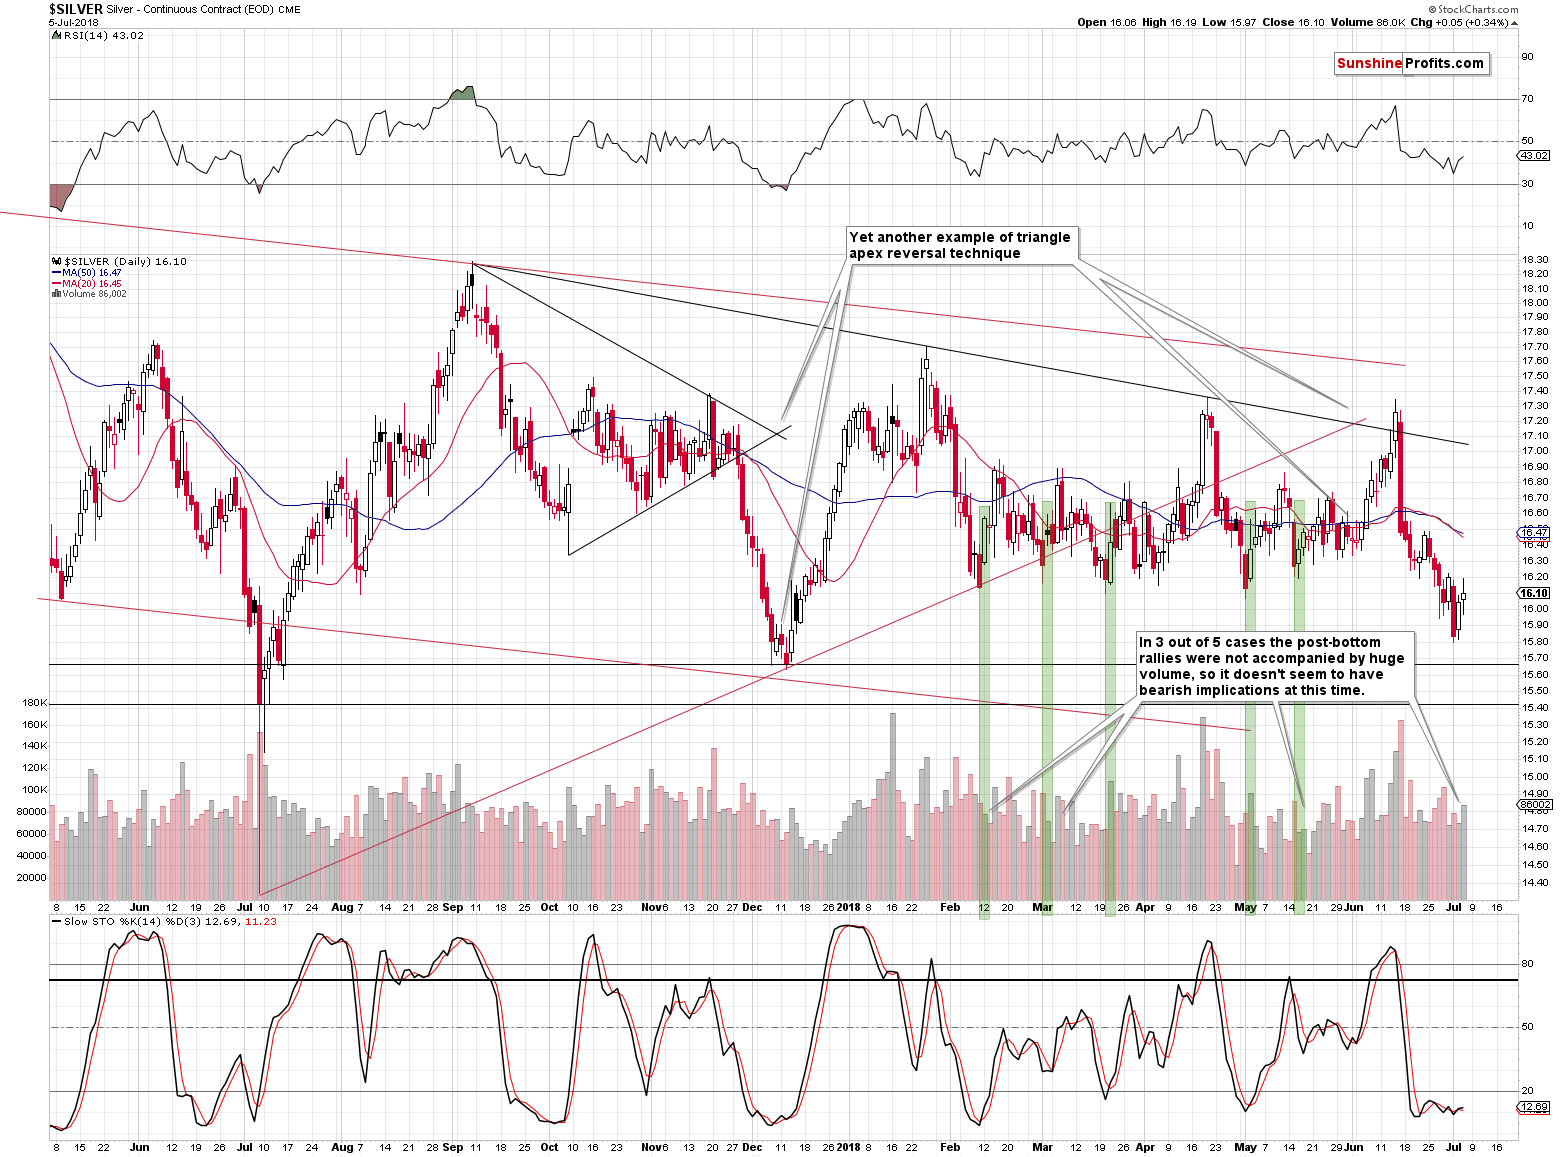
Silver declined on volume that was slightly higher than what we had seen on Friday, which is bearish. The fact that silver broke below the previous lows and closed visibly below them is also bearish. In yesterday’s alert, we wrote that at times silver started its post-bottom rally with low volume, so it was not something to be concerned with. Yet, in all these cases (mid-February, early March, mid-May) the following downswing didn’t take silver to new lows and it didn’t take place on higher volume. Consequently, the analogy to the cases marked with green rectangles on the above chart is no longer up-to-date.
All in all, the implications of the above chart have deteriorated significantly based on yesterday’s session.
The move higher that we saw was in tune with our overall expectations, but we admit that silver was not as strong as gold or mining stocks were. Does it change the bullish implications for the short term?
Not at all. When miners are getting ahead of gold and silver is lagging, it suggests that the move is beginning – not ending. This means that the rally has further to go and thus, the overall outlook is bullish.
The overall implications remain up-to-date. The above chart is not particularly bullish on its own as silver just closed below all the previous lows in terms of daily closing prices. Technically, the recent upswing looks like a verification of the breakdown, which is bearish.
But, based on more than a decade of analyzing the precious metals market on a daily basis, we know that in almost all cases when silver is indicating something and everything else is indicating the opposite, silver is the faker. Therefore, it seems that it’s more important to focus on silver's weak performance in relative terms to gold and mining stocks and view it as bullish, than it is to focus on its breakdown.
Mining Stocks’ Strong Performance
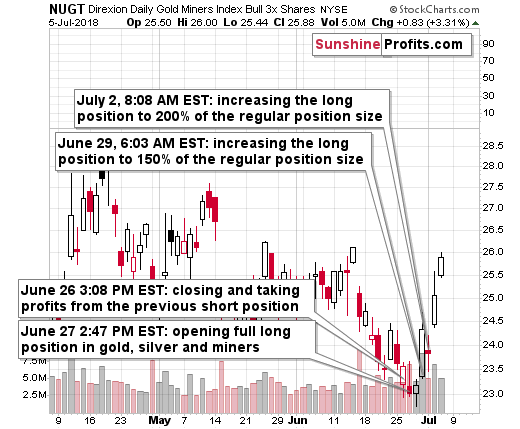
Speaking of miners, let’s see how well they did during the rebound.
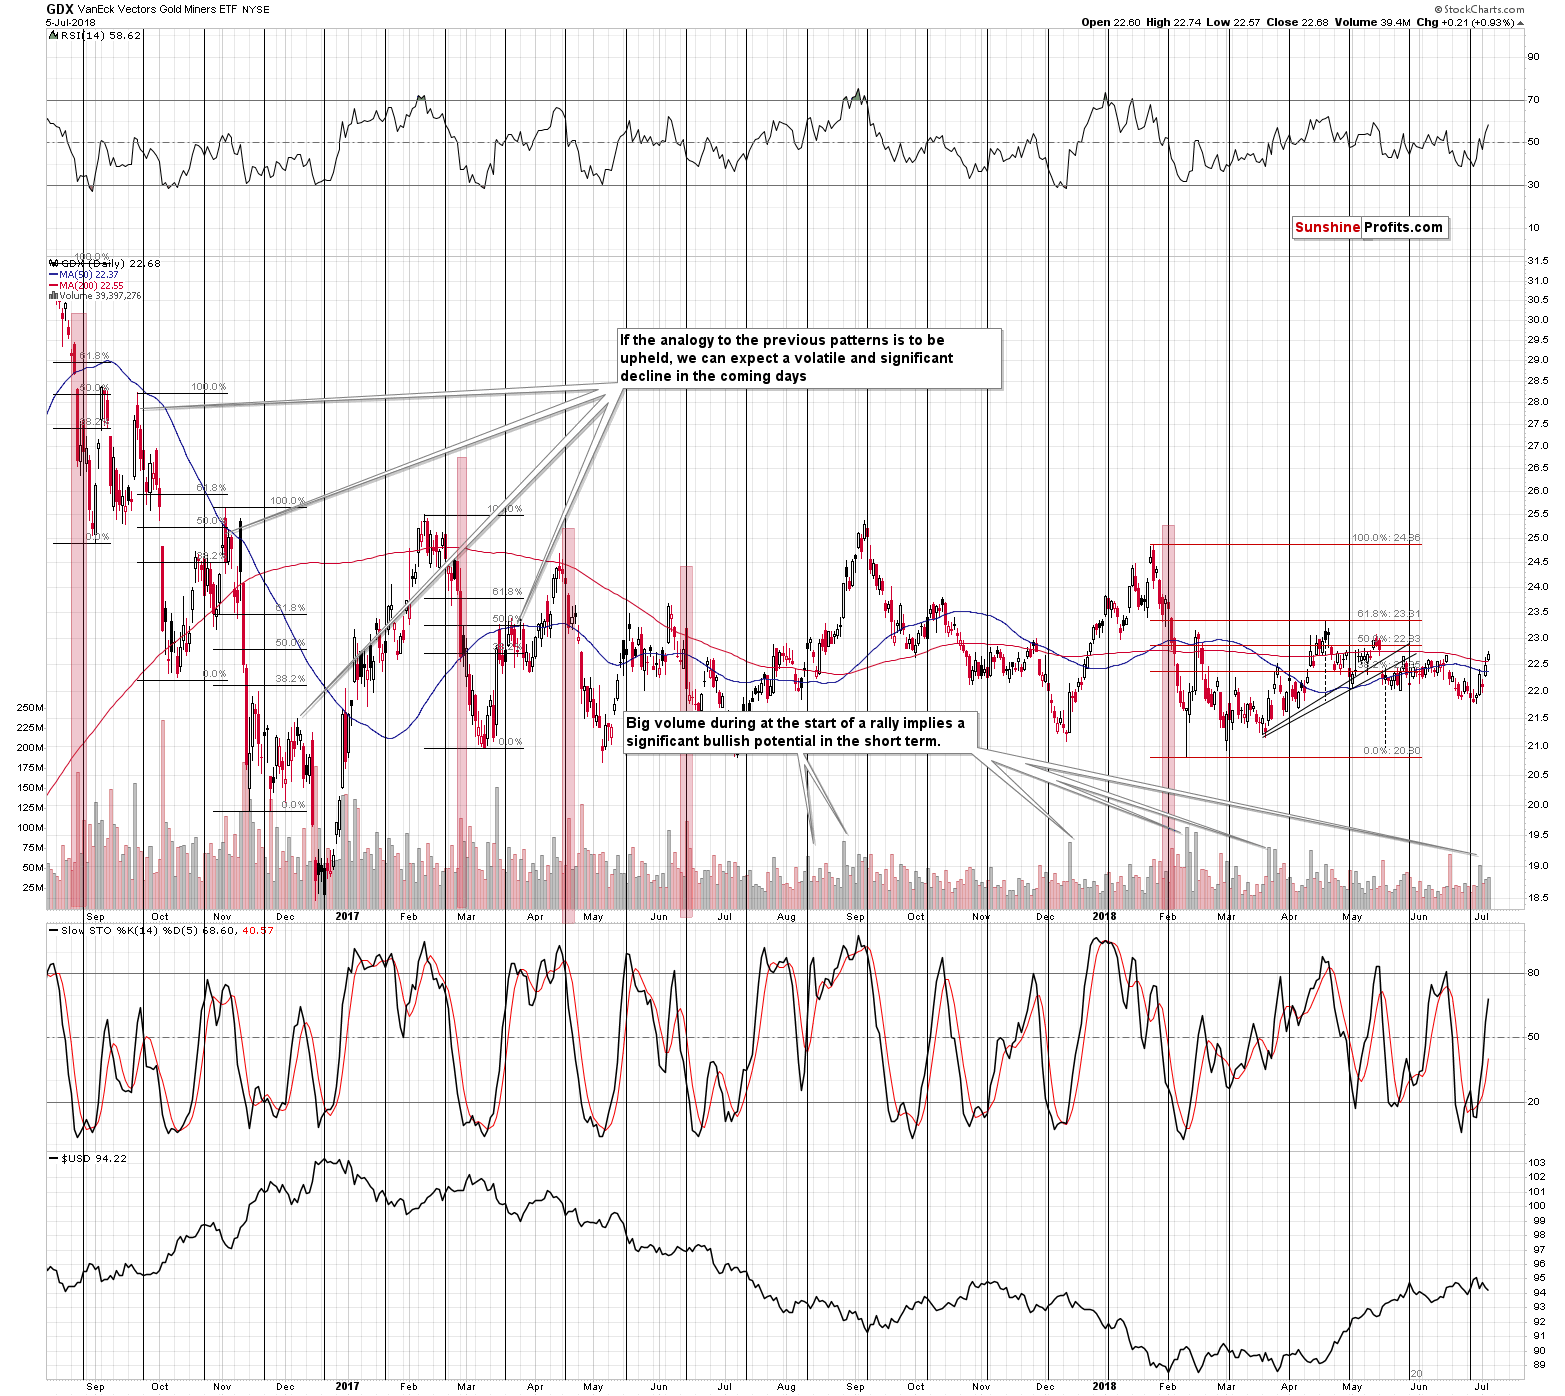
And they continue to do exceptionally well. The GDX ETF just moved to new monthly highs and also above June highs. This may be shocking as gold’s June high is above $1,300, but that’s exactly what happened.
After bottoming almost right at their and gold’s cyclical turning point, miners rallied and they keep on showing strength, while silver has been rather weak. Again, that is a bullish combination and it makes us expect even higher prices for mining stocks in the near future. At this time we are expecting a re-test of the April highs, which would be another move to the 61.8% Fibonacci retracement based on the January – February decline. We are moving our initial target prices higher based on the above.
The volume that accompanied Tuesday’s and yesterday’s rallies was sizable, which serves as a great bullish confirmation.
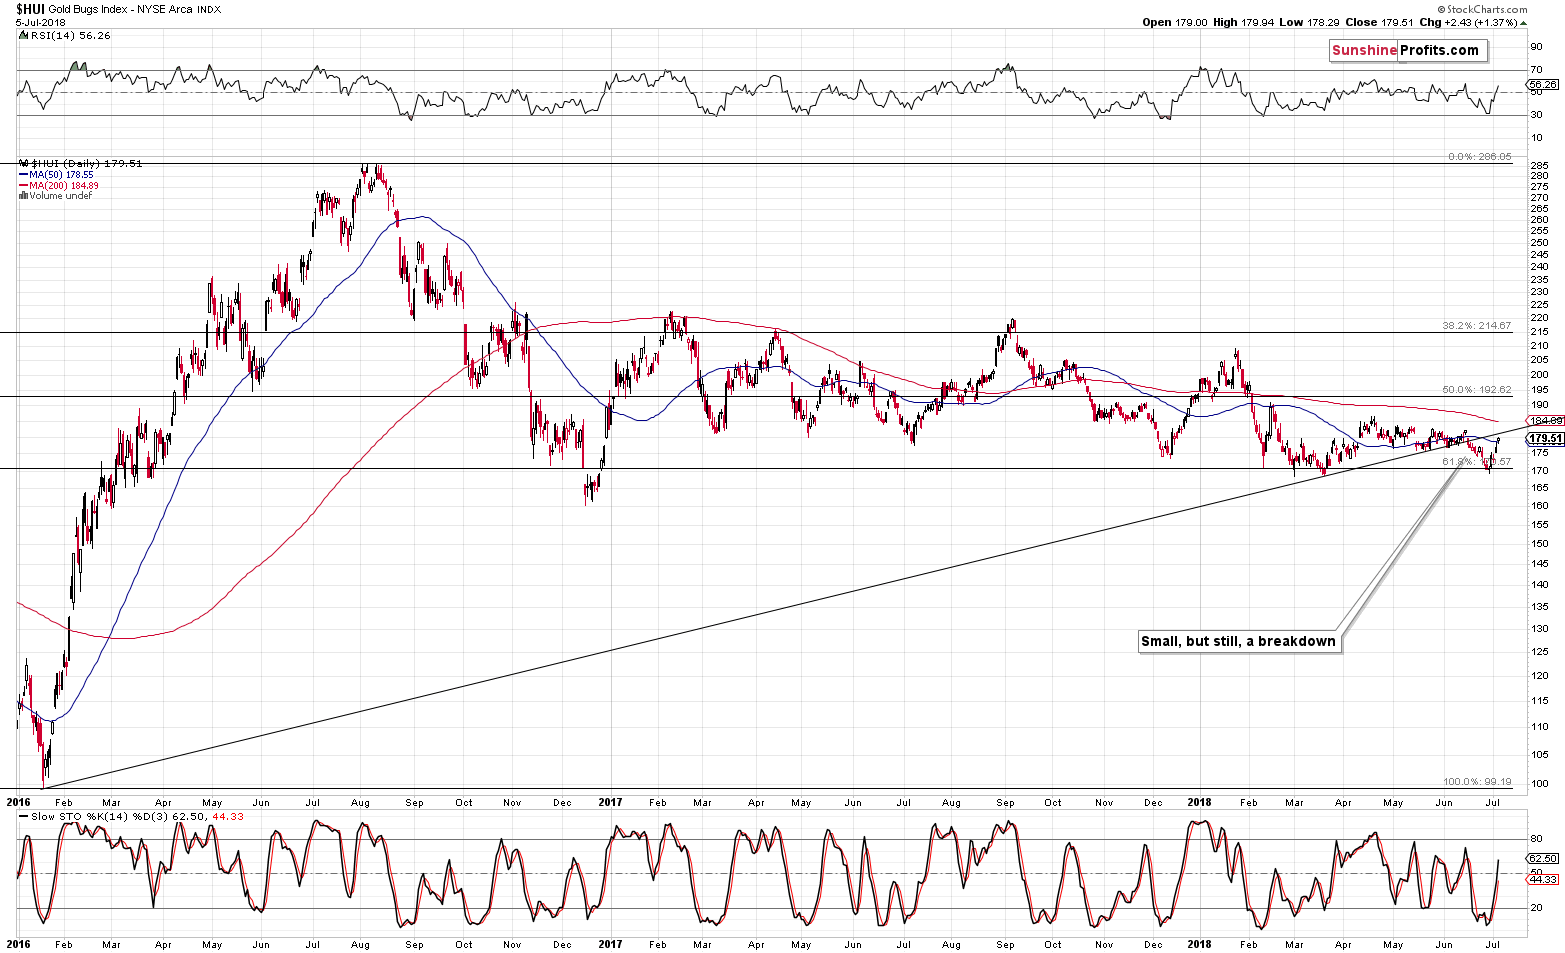
The HUI Index – proxy for gold stocks – hasn’t moved to its June highs or the rising medium-term support line so far and this level could still stop the rally, but it seems that a temporary move above it is more likely.
The reason is that we are seeing continuous strength in mining stocks and at the same time we are not seeing any topping signs from silver. The latter is a very effective and powerful signal and we’re seeing the opposite of what we should close to a rally’s end. This, plus the situation in the currency market makes us think that there is more upside in the short term.
In other words, just because the profits on the current long position in the miners are already significant it doesn’t mean that they can’t become even greater before this trade is over.
The final bullish confirmation of short-term nature for the precious metals market comes from the forex market.
USD Index and Its Short-term Downswing
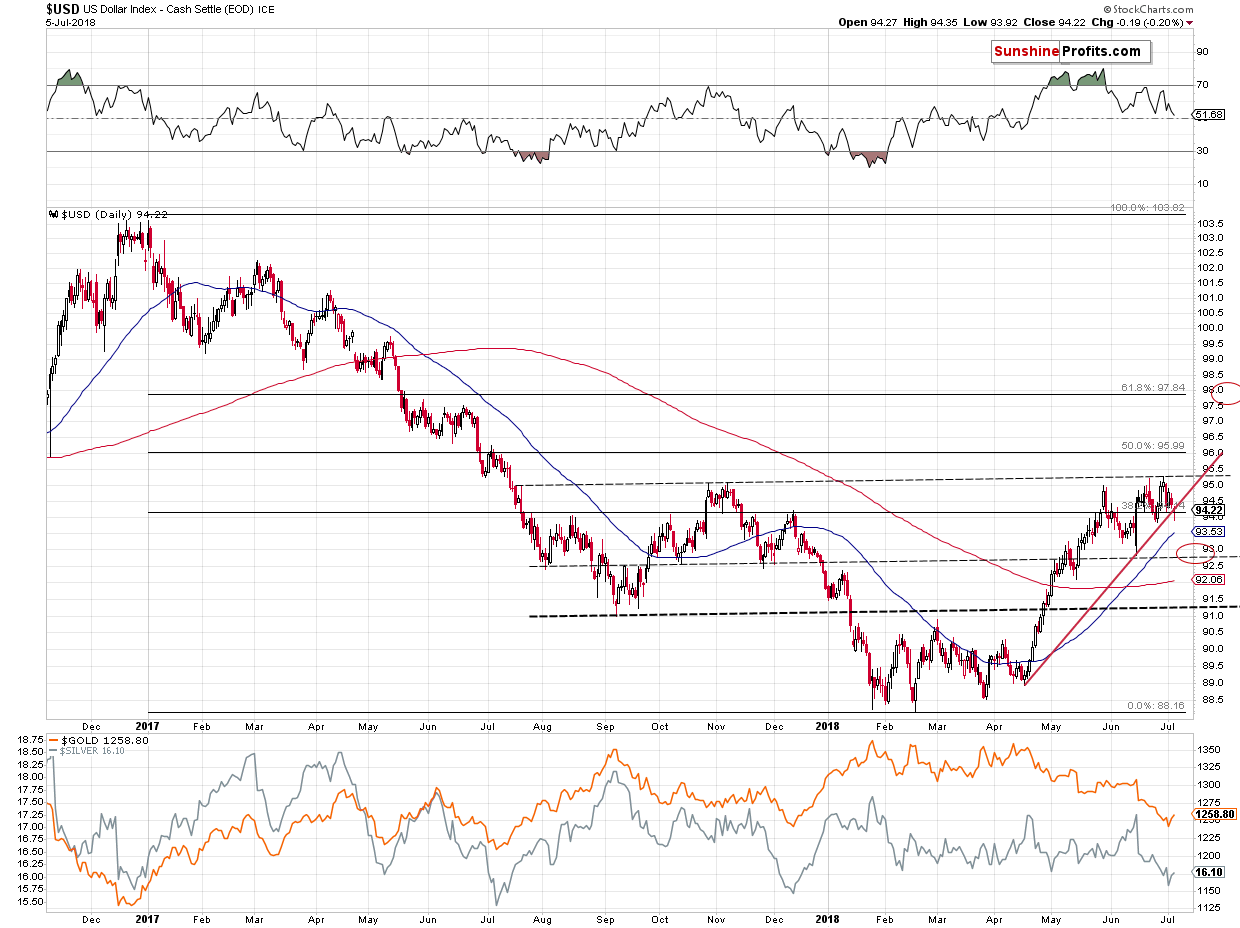
We previously commented on the above chart in the following way:
So far the April – June rally is symmetrical to the November 2017 – January 2018 decline in terms of the overall pace at which the moves took place and – more or less – the price levels that were reached.
If this symmetry continues to a big extent, then we may see a move to or a bit below 91.5, or – if the symmetry continues to a limited extent – a move to about 92.75 (approximately the June bottom).
The latter scenario seems more likely because of two factors:
- Gold was a bit above $1,300, when USD bottomed in June
- The analogy to 2014-2015 rally remains in place and a bigger decline seems unlikely in its light
But, there was one big obstacle on the above chart that – so far – has prevented the USD Index from sliding further. This may also be the reason why gold didn’t move much higher so far. It’s the rising red support line. The USD Index moved below it on an intraday basis yesterday, but it ultimately close a little above it, so there was no breakdown. Yet, it seems that we’ll see one shortly.
The explanation comes from the biggest (having a weight of over 50%) component of the USD Index: the EUR/USD currency exchange rate. The chart below (it’s from yesterday’s Forex Trading Alert) shows that the EUR/USD is already after a breakout.
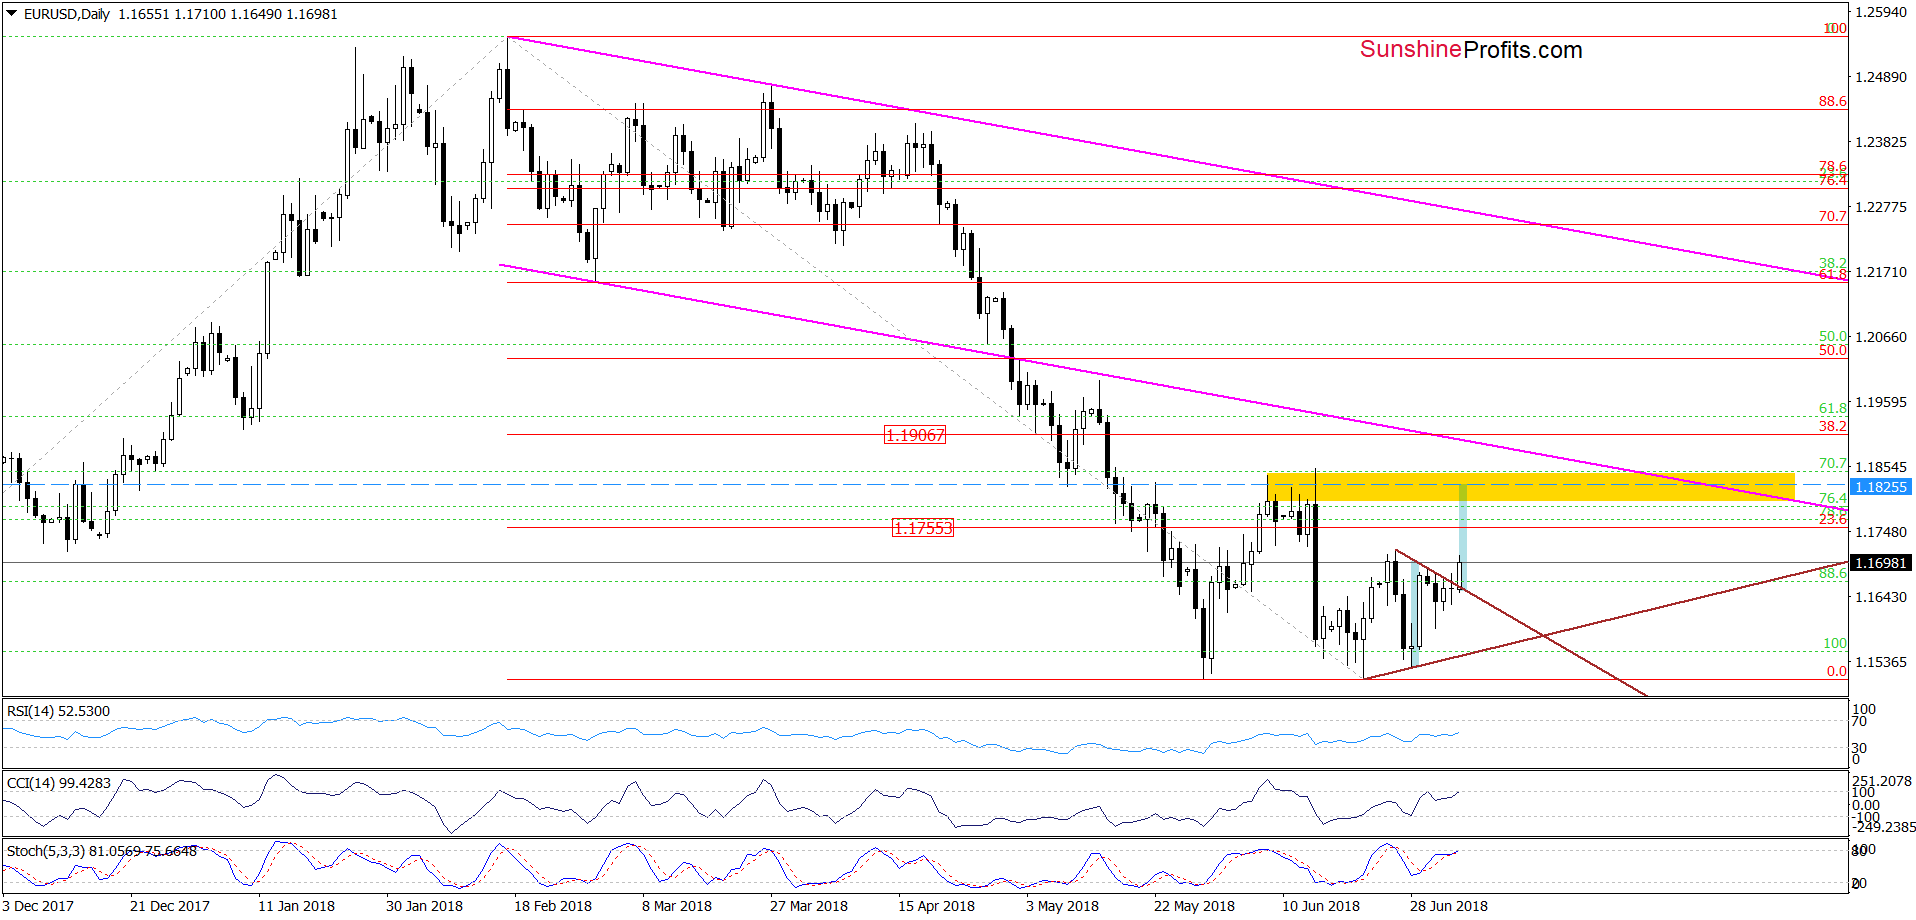
The move is based on more short-term lines and the implications are also of short-term nature. And that’s enough.
This breakout is likely to lead to further gains, which means that the USD Index is likely to decline further. This in turn means that we’ll likely see a breakdown below the rising red support line on the USDX chart, which will make the move to our target level much more likely. This, in turn, implies an increased likelihood of seeing a move to $1,300 in gold. Naturally, the rest of the precious metals market would likely follow and rally as well.
Summary
Summing up, the seemingly bearish sign from platinum is now a clearly bullish factor and with many additional bullish confirmations (i.a. from the forex market), it seems that the precious metals market will move higher in the next week or two. Naturally, the medium-term outlook remains bearish as we explained yesterday.
As always, we’ll keep you – our subscribers – informed.
To summarize:
Trading capital (supplementary part of the portfolio; our opinion): Full long positions (200% of the full position) in gold, silver and mining stocks are justified from the risk/reward perspective with the following stop-loss orders and initial target price levels:
- Gold: initial target price: $1,298; stop-loss: $1,228; initial target price for the UGLD ETN: $10.37; stop-loss for the UGLD ETN $8.67
- Silver: initial target price: $16.72; stop-loss: $15.57; initial target price for the USLV ETN: $10.47; stop-loss for the USLV ETN $8.47
- Mining stocks (price levels for the GDX ETF): initial target price: $22.97; stop-loss: $21.47; initial target price for the NUGT ETF: $26.17; stop-loss for the NUGT ETF $21.84
In case one wants to bet on junior mining stocks' prices (we do not suggest doing so – we think senior mining stocks are more predictable in the case of short-term trades – but if one wants to do it anyway, we provide the details), here are the stop-loss details and initial target prices:
- GDXJ ETF: initial target price: $33.57; stop-loss: $31.58
- JNUG ETF: initial target price: $14.58 stop-loss: $12.38
Long-term capital (core part of the portfolio; our opinion): No positions (in other words: cash)
Insurance capital (core part of the portfolio; our opinion): Full position
Important Details for New Subscribers
Whether you already subscribed or not, we encourage you to find out how to make the most of our alerts and read our replies to the most common alert-and-gold-trading-related-questions.
Please note that the in the trading section we describe the situation for the day that the alert is posted. In other words, it we are writing about a speculative position, it means that it is up-to-date on the day it was posted. We are also featuring the initial target prices, so that you can decide whether keeping a position on a given day is something that is in tune with your approach (some moves are too small for medium-term traders and some might appear too big for day-traders).
Plus, you might want to read why our stop-loss orders are usually relatively far from the current price.
Please note that a full position doesn’t mean using all of the capital for a given trade. You will find details on our thoughts on gold portfolio structuring in the Key Insights section on our website.
As a reminder – “initial target price” means exactly that – an “initial” one, it’s not a price level at which we suggest closing positions. If this becomes the case (like it did in the previous trade) we will refer to these levels as levels of exit orders (exactly as we’ve done previously). Stop-loss levels, however, are naturally not “initial”, but something that, in our opinion, might be entered as an order.
Since it is impossible to synchronize target prices and stop-loss levels for all the ETFs and ETNs with the main markets that we provide these levels for (gold, silver and mining stocks – the GDX ETF), the stop-loss levels and target prices for other ETNs and ETF (among other: UGLD, DGLD, USLV, DSLV, NUGT, DUST, JNUG, JDST) are provided as supplementary, and not as “final”. This means that if a stop-loss or a target level is reached for any of the “additional instruments” (DGLD for instance), but not for the “main instrument” (gold in this case), we will view positions in both gold and DGLD as still open and the stop-loss for DGLD would have to be moved lower. On the other hand, if gold moves to a stop-loss level but DGLD doesn’t, then we will view both positions (in gold and DGLD) as closed. In other words, since it’s not possible to be 100% certain that each related instrument moves to a given level when the underlying instrument does, we can’t provide levels that would be binding. The levels that we do provide are our best estimate of the levels that will correspond to the levels in the underlying assets, but it will be the underlying assets that one will need to focus on regarding the signs pointing to closing a given position or keeping it open. We might adjust the levels in the “additional instruments” without adjusting the levels in the “main instruments”, which will simply mean that we have improved our estimation of these levels, not that we changed our outlook on the markets. We are already working on a tool that would update these levels on a daily basis for the most popular ETFs, ETNs and individual mining stocks.
Our preferred ways to invest in and to trade gold along with the reasoning can be found in the how to buy gold section. Additionally, our preferred ETFs and ETNs can be found in our Gold & Silver ETF Ranking.
As a reminder, Gold & Silver Trading Alerts are posted before or on each trading day (we usually post them before the opening bell, but we don't promise doing that each day). If there's anything urgent, we will send you an additional small alert before posting the main one.
=====
Latest Free Trading Alerts:
The end is near. The end of quantitative easing. In June, the Fed lifted the federal funds rate for the second time this year, while the ECB announced that it would end its bond purchase program by the end of 2018. Is it the key change in macroeconomic outlook that will set the world on fire? We invite you to read our today’s article about the end of quantitative easing on both sides of the Atlantic Ocean and find out what does it mean for the gold market.
The End of Quantitative Easing and Gold
=====
Hand-picked precious-metals-related links:
PRECIOUS-Gold slips, but on track for gains this week on softer dollar
=====
In other news:
Stock futures dip as U.S.-China tariff war begins; jobs data awaited
Stock Gains Fade as Tariffs Sour Mood; Dollar Dips: Markets Wrap
German government, JPMorgan deny report on Deutsche Bank
A Traditional Stock Exchange Is Also Going to Trade Cryptocurrencies Like Bitcoin
There Are Fears About an Oil Spike Above $150
=====
Thank you.
Sincerely,
Przemyslaw Radomski, CFA
Founder, Editor-in-chief, Gold & Silver Fund Manager
Gold & Silver Trading Alerts
Forex Trading Alerts
Oil Investment Updates
Oil Trading Alerts

